The 5-HT and PLC Signaling Pathways Regulate the Secretion of IL-1 β, TNF- α and BDNF from NG2 Cells
- PMID: 35600957
- PMCID: PMC9122684
- DOI: 10.1155/2022/7425538
The 5-HT and PLC Signaling Pathways Regulate the Secretion of IL-1 β, TNF- α and BDNF from NG2 Cells
Abstract
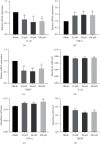
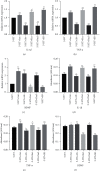
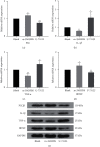
The present study was clarified the relationship between NG2 glial cells and 5-hydroxytryptamine (5-HT) to further revealed a role in the regulation of cortical excitability. The co-localization of NG2 cells and 5-HT in rat prefrontal cortex was determined using immunofluorescence. Different concentrations of 5-HT were applied to cultured NG2 cells. Real-time PCR measured the expression of interleukin-1β (IL-1β), tumor necrosis factor-α (TNF-α) and brain-derived neurotrophic factor (BDNF). Changes in the expression of IL-1β, TNF-α, and BDNF in NG2 cells were detected after the addition of 5-HT receptor specific blockers and phospholipase C (PLC) specific activators and inhibitors. The results confirmed that the NG2 protein and 5-HT co-localized in the prefrontal cortex. 5-HT treatment of NG2 cells significantly reduced the expression of IL-1β and BDNF mRNA and increased the expression of TNF-α. The 5-HT receptor specific inhibitors alverine citrate, ketanserin, ondansetron and SB-399885 blocked the regulatory effects of 5-HT on NG2 cells. The PLC signal was linked to the secretion of IL-1β, TNF-α and BDNF in NG2 cells. These results indicated that 5-HT affected IL-1β, TNF-α, and BDNF secretion from NG2 cells via the 5-HT1A, 5-HT2A, 5-HT3, 5-HT6 receptors and the PLC signaling pathway.
Copyright © 2022 Tingting Yang et al.
Conflict of interest statement
The authors declare that there are no conflicts of interest.
Figures


Similar articles
-
Regulation of inflammation by VEGF/BDNF signaling in mouse retinal Müller glial cells exposed to high glucose.Cell Tissue Res. 2022 Jun;388(3):521-533. doi: 10.1007/s00441-022-03622-z. Epub 2022 Apr 8. Cell Tissue Res. 2022. PMID: 35394215
-
The proinflammatory cytokines interleukin-1beta and tumor necrosis factor-alpha activate serotonin transporters.Neuropsychopharmacology. 2006 Oct;31(10):2121-31. doi: 10.1038/sj.npp.1301029. Epub 2006 Feb 1. Neuropsychopharmacology. 2006. PMID: 16452991
-
[Electroacupuncture improves insomnia by down-regulating peripheral benzodiazepine receptor expression in hippocampus, and up-regulating 5-HT, 5-HIAA, TNF-α and IL-1β contents in hypothalamus in insomnia rats].Zhen Ci Yan Jiu. 2019 Aug 25;44(8):560-5. doi: 10.13702/j.1000-0607.180610. Zhen Ci Yan Jiu. 2019. PMID: 31475488 Chinese.
-
Neurotrophic Factors (BDNF and GDNF) and the Serotonergic System of the Brain.Biochemistry (Mosc). 2017 Mar;82(3):308-317. doi: 10.1134/S0006297917030099. Biochemistry (Mosc). 2017. PMID: 28320272 Review.
-
Studies on the neuroendocrine role of serotonin.Dan Med Bull. 2007 Nov;54(4):266-88. Dan Med Bull. 2007. PMID: 18208678 Review.
Cited by
-
Gene expression profile associated with Asmt knockout-induced depression-like behaviors and exercise effects in mouse hypothalamus.Biosci Rep. 2022 Jul 29;42(7):BSR20220800. doi: 10.1042/BSR20220800. Biosci Rep. 2022. PMID: 35771226 Free PMC article.
-
Systemic Modulators: Potential Mechanism for the 5-HT System to Mediate Exercise Amelioration in Alzheimer's Disease.Aging Dis. 2024 Sep 30;16(5):2770-2802. doi: 10.14336/AD.2024.0834. Aging Dis. 2024. PMID: 39500357 Free PMC article. Review.
-
A Study of the Relationship between Inflammatory Immune Function and Intestinal Flora in Adolescent Patients with First-Episode Depression.Actas Esp Psiquiatr. 2024 Feb;52(1):1-9. Actas Esp Psiquiatr. 2024. PMID: 38454896 Free PMC article.
References
-
- Eugenín-Von Bernhardi J., Dimou L. NG2-glia, more than progenitor cells. Advances in Experimental Medicine and Biology . 2016;949:27–45. - PubMed
LinkOut - more resources
Full Text Sources

