

Mg-based materials diminish tumor spreading and cancer metastases
- PMID: 35600975
- PMCID: PMC9108521
- DOI: 10.1016/j.bioactmat.2022.05.002
Mg-based materials diminish tumor spreading and cancer metastases
Abstract
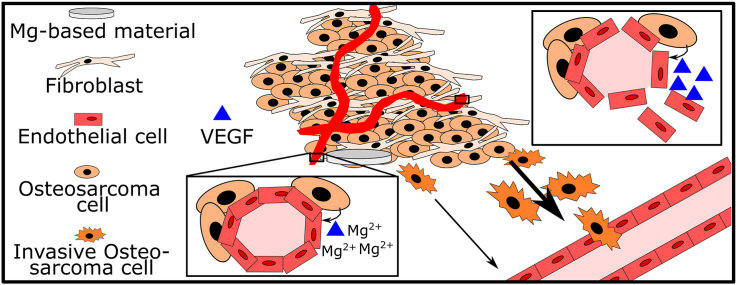
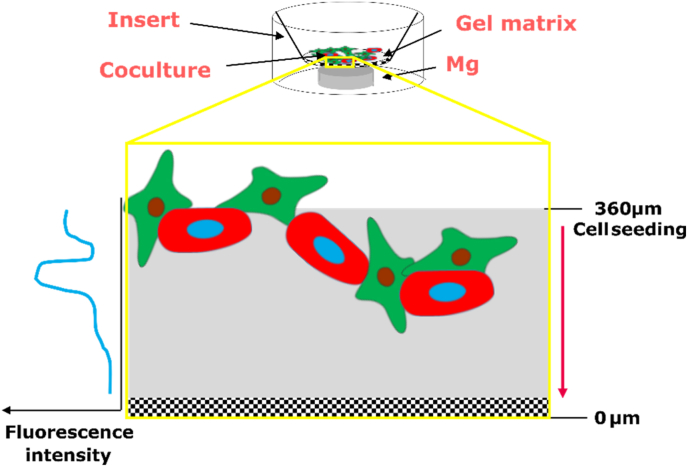
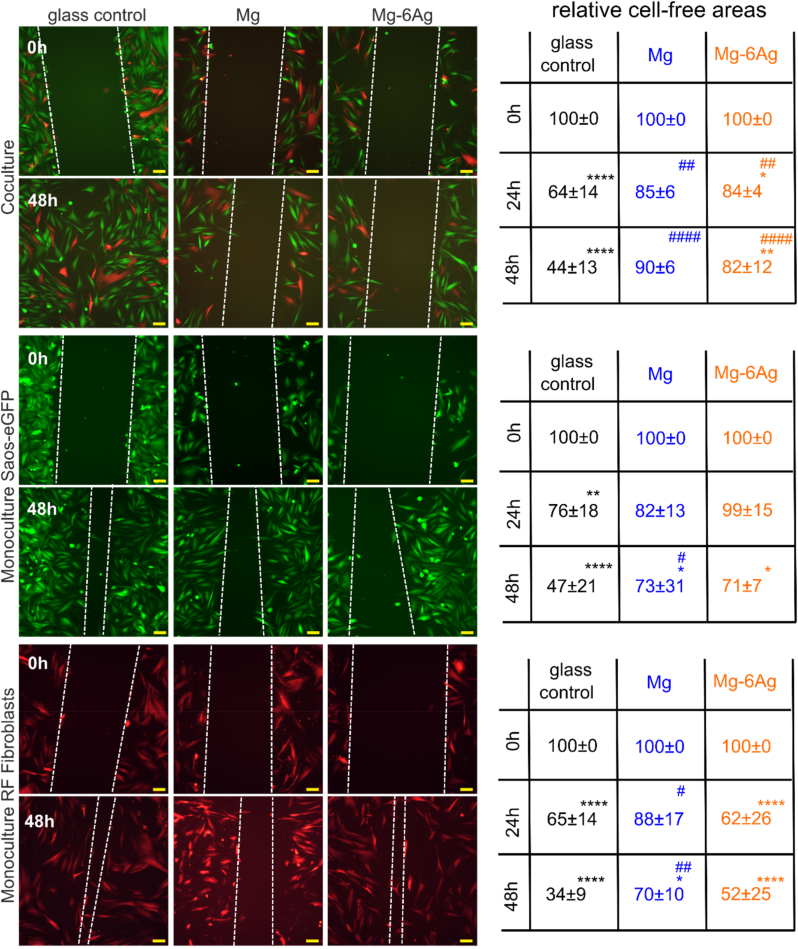
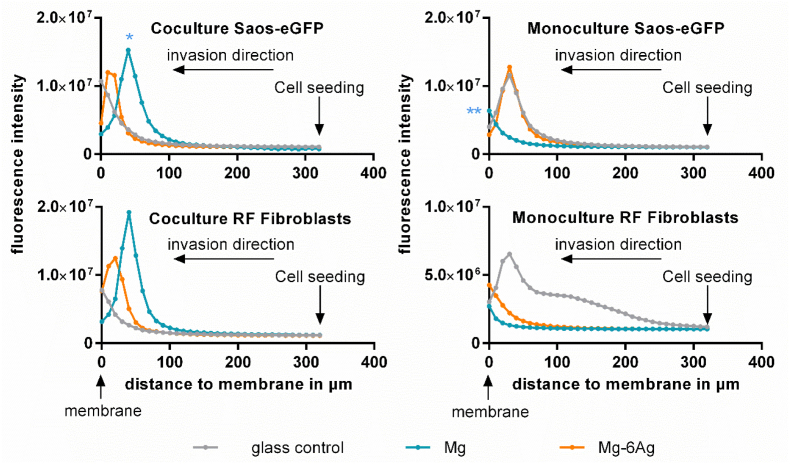
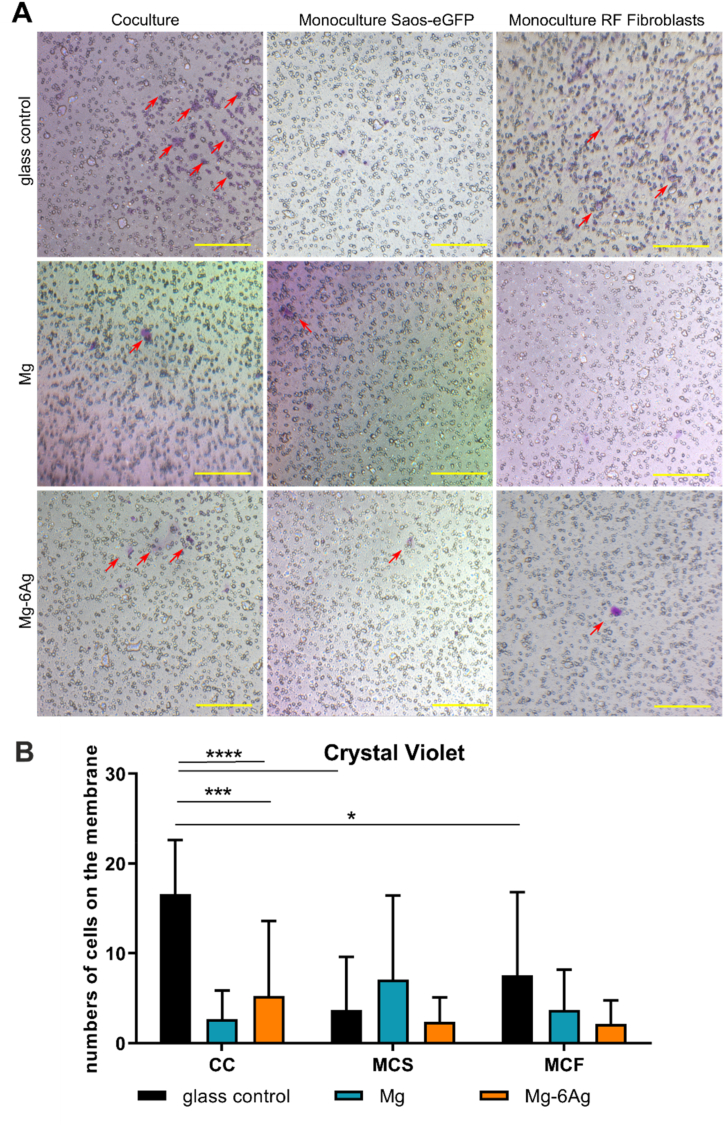
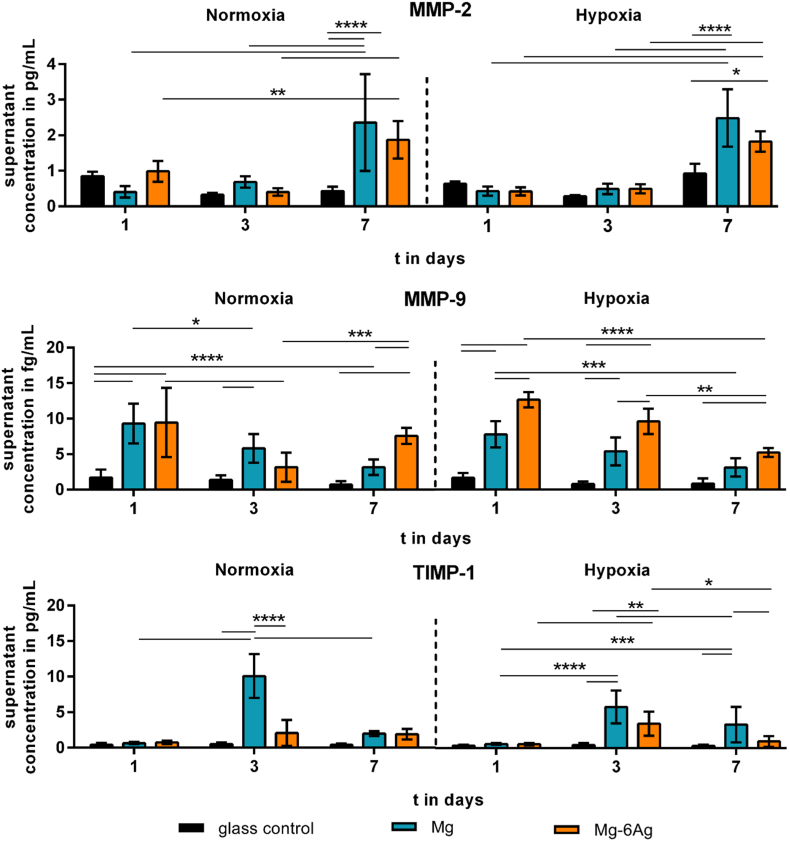
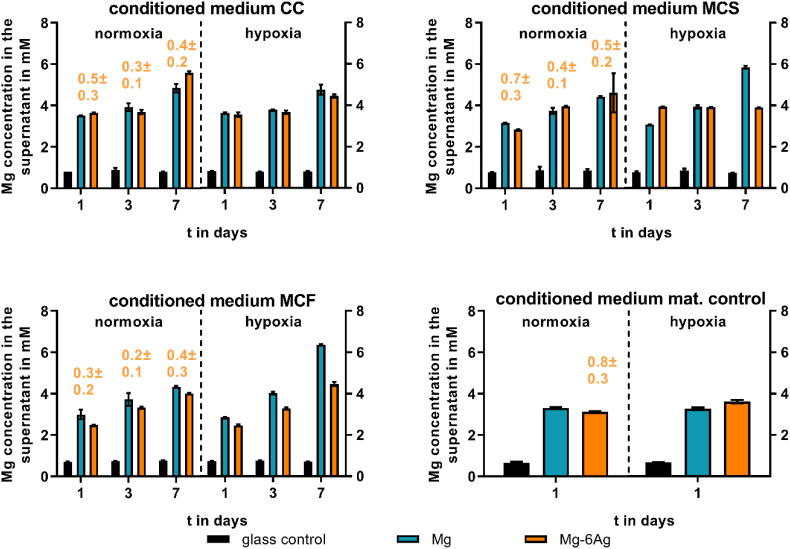
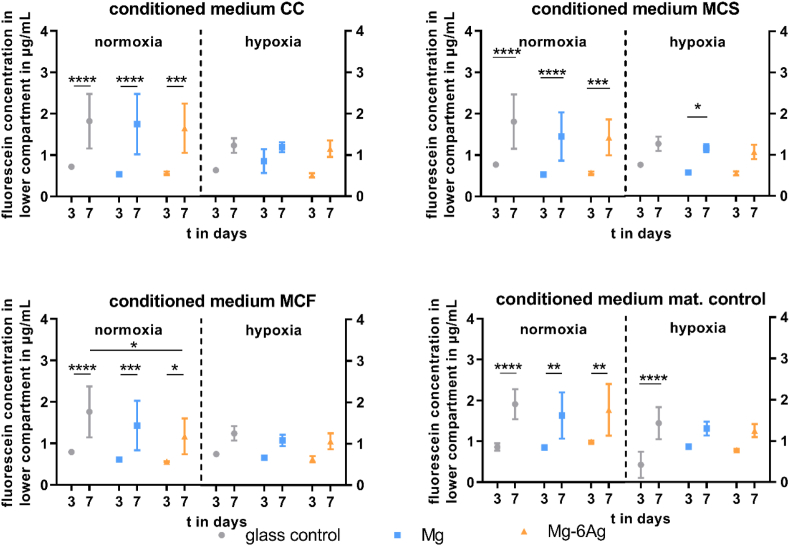
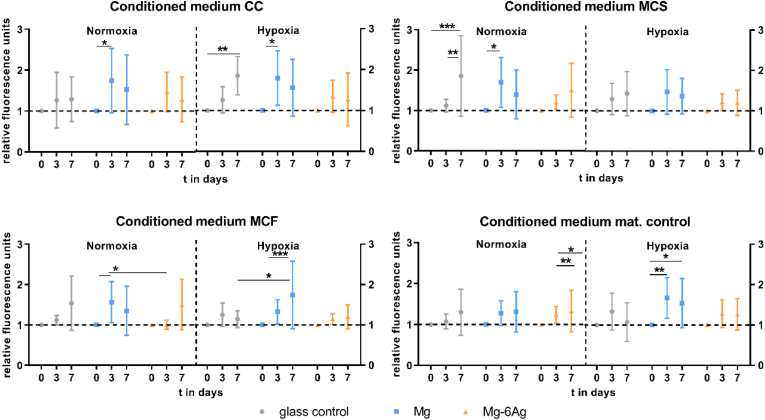
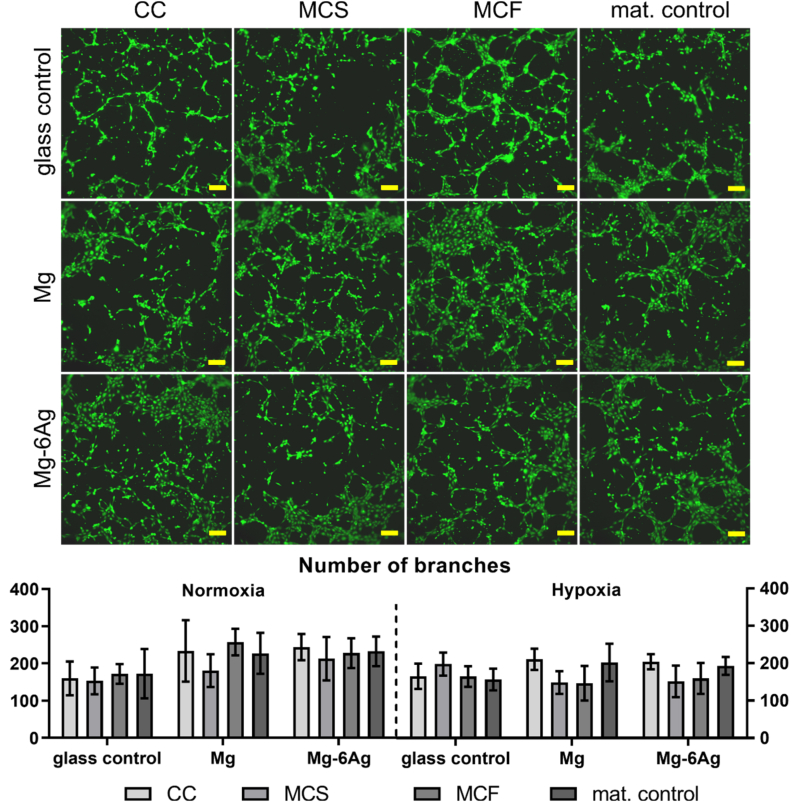
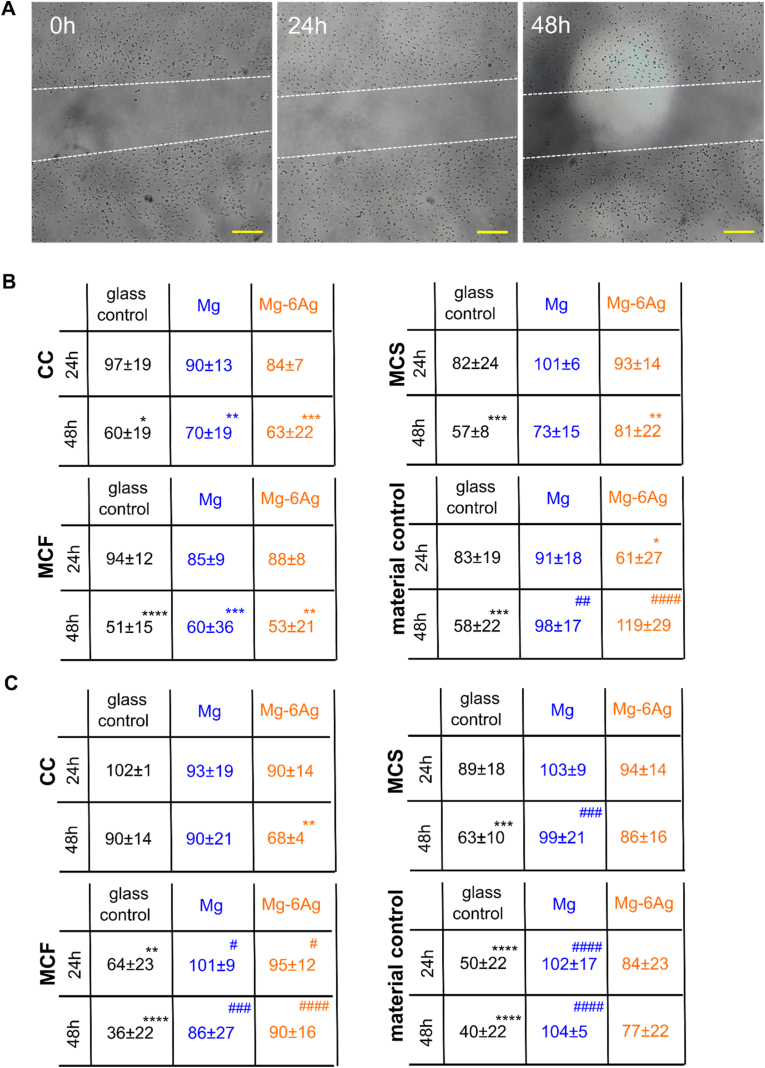
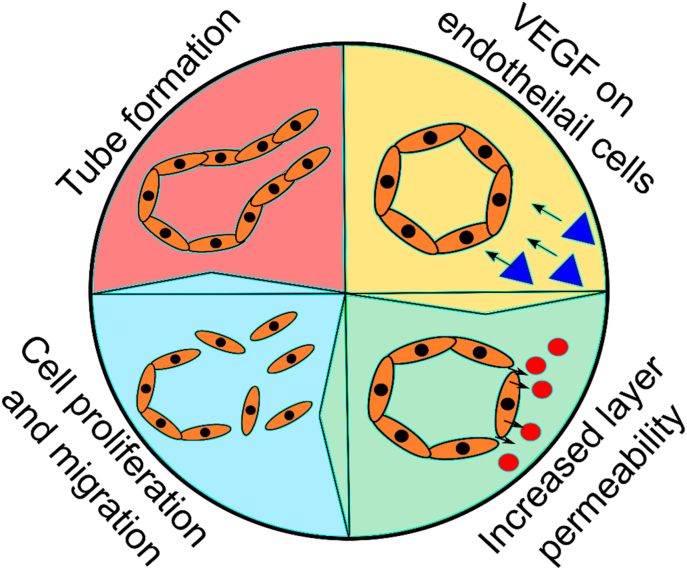
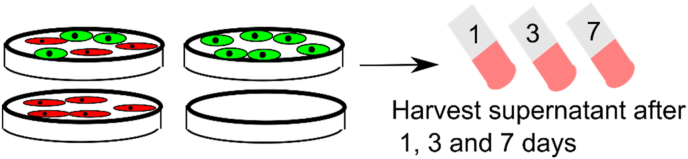
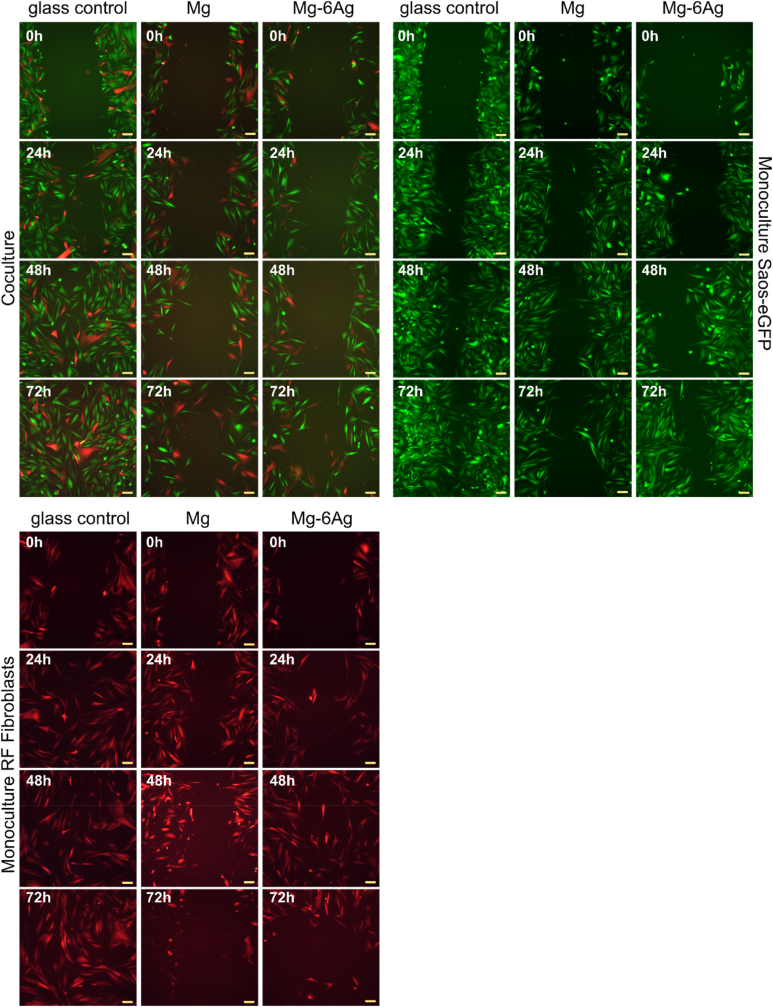
Cancer metastases are the most common causes of cancer-related deaths. The formation of secondary tumors at different sites in the human body can impair multiple organ function and dramatically decrease the survival of the patients. In this stage, it is difficulty to treat tumor growth and spreading due to arising therapy resistances. Therefore, it is important to prevent cancer metastases and to increase subsequent cancer therapy success. Cancer metastases are conventionally treated with radiation or chemotherapy. However, these treatments elicit lots of side effects, wherefore novel local treatment approaches are currently discussed. Recent studies already showed anticancer activity of specially designed degradable magnesium (Mg) alloys by reducing the cancer cell proliferation. In this work, we investigated the impact of these Mg-based materials on different steps of the metastatic cascade including cancer cell migration, invasion, and cancer-induced angiogenesis. Both, Mg and Mg-6Ag reduced cell migration and invasion of osteosarcoma cells in coculture with fibroblasts. Furthermore, the Mg-based materials used in this study diminished the cancer-induced angiogenesis. Endothelial cells incubated with conditioned media obtained from these Mg and Mg-6Ag showed a reduced cell layer permeability, a reduced proliferation and inhibited cell migration. The tube formation as a last step of angiogenesis was stimulated with the presence of Mg under normoxia and diminished under hypoxia.
Keywords: Angiogenesis; Cancer; Cell invasion; Cell migration; Magnesium degradation; Osteosarcoma.
© 2022 The Authors.
Conflict of interest statement
The authors declare no conflict of interest. The funders had no role in the design of the study; in the collection, analyses, or interpretation of data; in the writing of the manuscript, or in the decision to publish the results.
Figures
Similar articles
-
Optimizing an Osteosarcoma-Fibroblast Coculture Model to Study Antitumoral Activity of Magnesium-Based Biomaterials.Int J Mol Sci. 2020 Jul 19;21(14):5099. doi: 10.3390/ijms21145099. Int J Mol Sci. 2020. PMID: 32707715 Free PMC article.
-
Slow degrading Mg-based materials induce tumor cell dormancy on an osteosarcoma-fibroblast coculture model.Bioact Mater. 2021 Dec 30;16:320-333. doi: 10.1016/j.bioactmat.2021.12.031. eCollection 2022 Oct. Bioact Mater. 2021. PMID: 35386318 Free PMC article.
-
In vitro anti-angiogenic effects of Hemidesmus indicus in hypoxic and normoxic conditions.J Ethnopharmacol. 2015 Mar 13;162:261-9. doi: 10.1016/j.jep.2014.12.010. Epub 2015 Jan 2. J Ethnopharmacol. 2015. PMID: 25560668
-
Colon cancer angiogenesis and antiangiogenic therapy.Expert Opin Investig Drugs. 2004 Jun;13(6):631-41. doi: 10.1517/13543784.13.6.631. Expert Opin Investig Drugs. 2004. PMID: 15174949 Review.
-
Overview of resistance to systemic therapy in patients with breast cancer.Adv Exp Med Biol. 2007;608:1-22. doi: 10.1007/978-0-387-74039-3_1. Adv Exp Med Biol. 2007. PMID: 17993229 Review.
Cited by
-
L-type association between magnesium intake and human papillomavirus infection in US adult women: based on NHANES 2003-2016 data.Front Nutr. 2025 May 30;12:1594489. doi: 10.3389/fnut.2025.1594489. eCollection 2025. Front Nutr. 2025. PMID: 40521368 Free PMC article.
-
Mg alloys with antitumor and anticorrosion properties for orthopedic oncology: A review from mechanisms to application strategies.APL Bioeng. 2024 Apr 17;8(2):021504. doi: 10.1063/5.0191800. eCollection 2024 Jun. APL Bioeng. 2024. PMID: 38638143 Free PMC article. Review.
-
Research on the Current Application Status of Magnesium Metal Stents in Human Luminal Cavities.J Funct Biomater. 2023 Sep 8;14(9):462. doi: 10.3390/jfb14090462. J Funct Biomater. 2023. PMID: 37754876 Free PMC article. Review.
-
The Recent Developments of Thermomechanical Processing for Biomedical Mg Alloys and Their Clinical Applications.Materials (Basel). 2025 Apr 9;18(8):1718. doi: 10.3390/ma18081718. Materials (Basel). 2025. PMID: 40333396 Free PMC article. Review.
-
Update on Radiotherapy Changes of Nasopharyngeal Carcinoma Tumor Microenvironment.World J Oncol. 2023 Oct;14(5):350-357. doi: 10.14740/wjon1645. Epub 2023 Sep 20. World J Oncol. 2023. PMID: 37869238 Free PMC article. Review.
References
-
- Schroeder A., et al. Treating metastatic cancer with nanotechnology. Nat. Rev. Cancer. 2011;12(1):39–50. - PubMed
-
- Plaass C., et al. Bioabsorbable magnesium versus standard titanium compression screws for fixation of distal metatarsal osteotomies – 3 year results of a randomized clinical trial. J. Orthop. Sci. 2018;23(2):321–327. - PubMed
LinkOut - more resources
Full Text Sources
