. 2022 Apr 20;9(4):211594.
doi: 10.1098/rsos.211594. eCollection 2022 Apr.

Supervised learning for analysing movement patterns in a virtual reality experiment

Affiliations

Supervised learning for analysing movement patterns in a virtual reality experiment

Frederike Vogel et al. R Soc Open Sci. .

Abstract

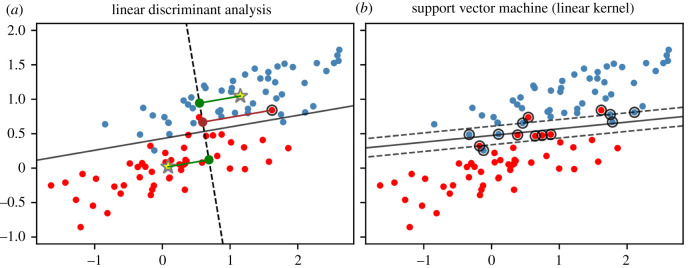
The projection into a virtual character and the concomitant illusionary body ownership can lead to transformations of one's entity. Both during and after the exposure, behavioural and attitudinal changes may occur, depending on the characteristics or stereotypes associated with the embodied avatar. In the present study, we investigated the effects on physical activity when young students experience being old. After assignment (at random) to a young or an older avatar, the participants' body movements were tracked while performing upper body exercises. We propose and discuss the use of supervised learning procedures to assign these movement patterns to the underlying avatar class in order to detect behavioural differences. This approach can be seen as an alternative to classical feature-wise testing. We found that the classification accuracy was remarkably good for support vector machines with linear kernel and deep learning by convolutional neural networks, when inserting time sub-sequences extracted at random and repeatedly from the original data. For hand movements, associated decision boundaries revealed a higher level of local, vertical positions for the young avatar group, indicating increased agility in their performances. This occurrence held for both guided movements as well as achievement-orientated exercises.

Keywords: ageing; data augmentation; deep learning; embodiment; resampling.


Conflict of interest statement

We declare we have no competing interests.

Figures

Figure 1.
Figure 1.
Example of right-hand movement patterns in three axes/dimensions (global positions).
Figure 2.
Figure 2.
Densities of first PC scores and boxplots for relative x-position of the right hand with regard to class affiliation.
Figure 3.
Figure 3.
Illustration of the classification concept of LDA and SVM. Data points were simulated having the same covariance matrix and each class is represented equally. (a) For LDA, data points and class means (yellow stars) are orthogonally projected (exemplarily displayed as dark red and green lines, respectively) onto the dashed (projection) line. The solid line refers to the corresponding separating line. With prior class probabilities being equal, an observation is assigned to the class whose projected mean is closest to the observation’s projection, e.g. the projection of the circled red point on the right (dark red point) is closer to the projection of the upper class mean. More generally speaking, classifications proceed according to which side of the separating line a data point is located. (b) For SVM with linear kernel, the margin (space between dashed lines) around the separating line is maximized while possibly allowing some outliers (circled points; these include all support vectors).
Figure 4.
Figure 4.
Concept of a decision tree.
Figure 5.
Figure 5.
Concept of a simple feedforward network. Elements are the four-dimensional input xR4 and two hidden layers F1, F2 with six neurons each, i.e. functions F1:R4R6, F2:R6R2, leading into two output neurons.
Figure 6.
Figure 6.
Concept of convolutional layers. A kernel KR3×6 (consisting of entries k11, …, k36) with filter length F = 3 is slid over the time dimension of a segment SR8×6 (consisting of entries s11, …, s86. With the segment’s height of 8, the kernel of size 3 will move along the data over 8 − 3 + 1 = 6 steps. In each step, corresponding components of the kernel and the segment are multiplied and summed up (this operation is denoted by Σ), leading to an output vector of length 6. These operations may be repeated for a number of filters (here: four filters C1,,C4).
Figure 7.
Figure 7.
Correct classifications on test data (size 12) in 100 runs based on different inputs. (a,b) Principal component and basic feature input calculated on whole sessions of the experiment was used. The five bars per body part refer to the classification results by LDA, FF, RF, SVM(RBF) and SVM(LIN), respectively. (c) Raw movement data (whole sessions) were inserted into a CNN.
Figure 8.
Figure 8.
Correct classifications on test data (size 12) in 100 runs based on segmental input. Thirty segments per participant, i.e. 60 × 30 = 1800 for training and 12 × 30 = 360 for testing, were considered. The final prediction for the test set was performed via majority voting per subject. (a) Chosen window sizes are displayed. The six bars per body part refer to the sizes chosen by LDA, FF, RF, SVM(RBF), SVM(LIN) and CNN, respectively. (b) Basic feature input calculated on segments was used. The five bars per body part refer to the classification results by LDA, FF, RF, SVM(RBF) and SVM(LIN), respectively. (c) Raw segmental movement data were inserted into a CNN.
Figure 9.
Figure 9.
Correct predictions on validation dataset with a total number of 43 participants.
Figure 10.
Figure 10.
Scatterplots of mean y-position (global) versus mean y-position (local) for the right hand. All 72 movement patterns (whole sessions) were considered. The solid grey line refers to the decision function of an SVM(LIN) classifier that has been fitted to the two features, the dashed grey lines to the corresponding margin.

References

    1. Botvinick M, Cohen J. 1998. Rubber hands ‘feel’ touch that eyes see. Nature 391, 756. (10.1038/35784) - DOI - PubMed
    1. Dummer T, Picot-Annand A, Neal T, Moore C. 2009. Movement and the rubber hand illusion. Perception 38, 271-280. (10.1068/p5921) - DOI - PubMed
    1. Metral M, Guerraz M. 2019. Fake hand in movement: visual motion cues from the rubber hand are processed for kinesthesia. Conscious. Cogn. 73, 102761. (10.1016/j.concog.2019.05.009) - DOI - PubMed
    1. Tsakiris M, Haggard P. 2005. The rubber hand illusion revisited: visuotactile integration and self-attribution. J. Exp. Psychol. Hum. Percept. Perform. 31, 80-91. (10.1037/0096-1523.31.1.80) - DOI - PubMed
    1. Costantini M, Haggard P. 2007. The rubber hand illusion: sensitivity and reference frame for body ownership. Conscious. Cogn. 16, 229-240. (10.1016/j.concog.2007.01.001) - DOI - PubMed

LinkOut - more resources