

Hidden Fluids in Plain Sight: Identifying Intravenous Medication Classes as Contributors to Intensive Care Unit Fluid Intake
- PMID: 35601708
- PMCID: PMC9117780
- DOI: 10.1177/00185787211016339
Hidden Fluids in Plain Sight: Identifying Intravenous Medication Classes as Contributors to Intensive Care Unit Fluid Intake
Abstract
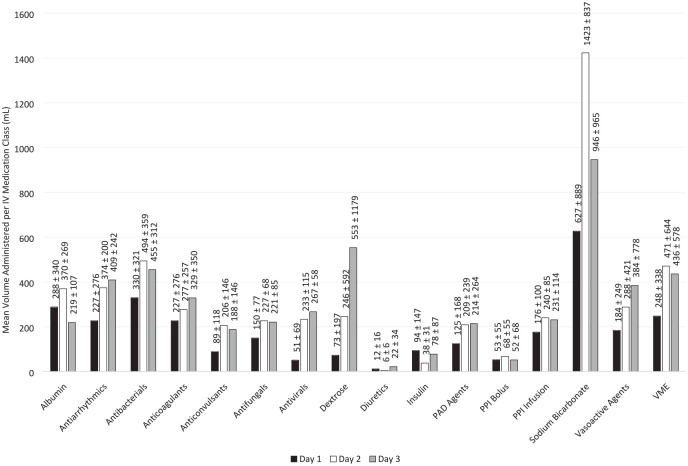
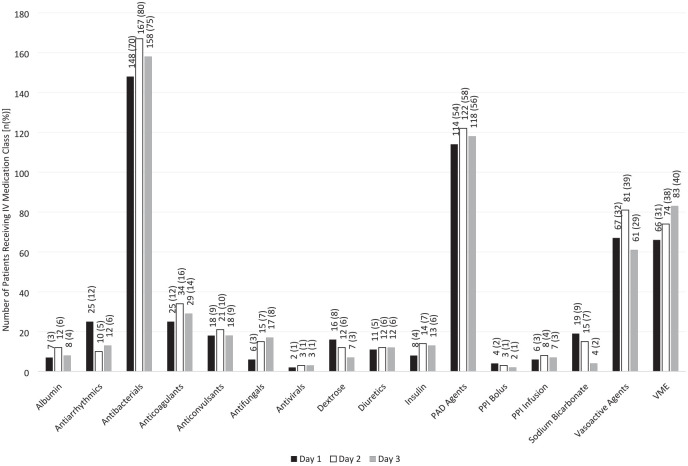
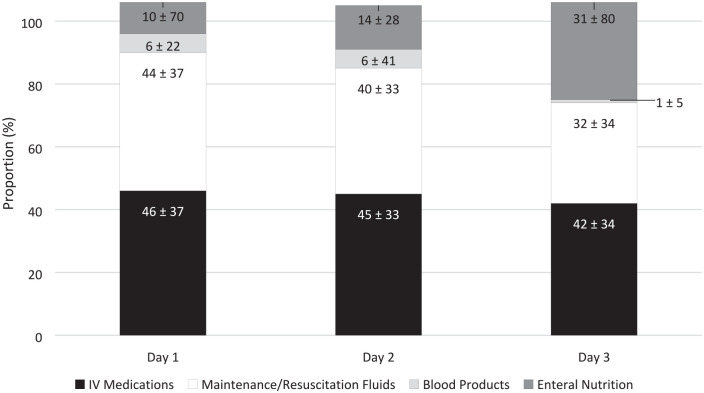
Introduction: Fluid stewardship targets optimal fluid management to improve patient outcomes. Intravenous (IV) medications, flushes, and blood products, collectively referred to as hidden fluids, contribute to fluid intake in the intensive care unit (ICU). The impact of specific IV medications on fluid intake is unknown. Objective: Characterize IV medication classes based on contribution to ICU fluid intake by frequency of administration and total volume infused to identify targets for fluid stewardship. Methods: This multi-center, retrospective nested cohort study included patients admitted to a medical or surgical ICU between January 2017 and December 2018. The primary outcome was to identify the volume contribution of specific IV medication classes administered over the first 3 ICU days. Secondary outcomes were the administration frequency of these medications and their proportion of total daily volume intake over the first 3 ICU days. Results: The study included 210 patients. The largest mean administration volumes over the course of the first 3 ICU days were attributed to antibacterials (968 ± 846 mL), vitamins/minerals/electrolytes (416 ± 935 mL), pain/agitation/delirium agents (310 ± 512 mL), and vasoactive agents (282 ± 744 mL). The highest frequencies over the course of the first 3 ICU days were attributed to antibacterials (n = 180; 86%), pain/agitation/delirium agents (n = 143; 68%), vitamins/minerals/electrolytes (n = 123; 59%), and vasoactive agents (n = 96; 46%). IV medications contributed 2601 ± 2573 mL of fluid volume per patient over the first 3 ICU days, accounting for 42% ± 29% of overall volume. Conclusion: IV medications contribute over 40% of total fluid intake within the first 3 days of ICU admission, with antibacterials as top contributors by administration volume and frequency. Future research implementing fluid stewardship to ICU fluid sources, such as concentrating IV medications, switching IV medications to oral formulations, de-escalation of antibacterials, and reduction of maintenance fluids, should be performed to minimize hidden fluids from IV medications.
Keywords: critical care; fluid and electrolyte disorders; intravenous therapy.
© The Author(s) 2021.
Conflict of interest statement
Declaration of Conflicting Interests: The author(s) declared the following potential conflicts of interest with respect to the research, authorship, and/or publication of this article: Christopher M. Bland is a consultant and has received grant funding from Merck Pharmaceuticals. Andrea Sikora Newsome is supported by the National Center for Advancing Translational Sciences (NCATS) of the National Institutes of Health (NIH) under Award Numbers UL1TR002378 and KL2TR002381. All other authors declare no relevant conflicts of interest.
Figures
Similar articles
-
Association of hidden fluid administration with development of fluid overload reveals opportunities for targeted fluid minimization.SAGE Open Med. 2020 Dec 9;8:2050312120979464. doi: 10.1177/2050312120979464. eCollection 2020. SAGE Open Med. 2020. PMID: 33343899 Free PMC article.
-
Hidden Obligatory Fluid Intake in Critical Care Patients.J Intensive Care Med. 2017 Mar;32(3):223-227. doi: 10.1177/0885066615625181. Epub 2016 Jul 7. J Intensive Care Med. 2017. PMID: 26768425
-
Hidden sources of fluids, sodium and potassium in stabilised Swedish ICU patients: A multicentre retrospective observational study.Eur J Anaesthesiol. 2021 Jun 1;38(6):625-633. doi: 10.1097/EJA.0000000000001354. Eur J Anaesthesiol. 2021. PMID: 33074941
-
Choice of creep or maintenance fluid type and their impact on total daily ICU sodium burden in critically ill patients: A systematic review and meta-analysis.J Crit Care. 2023 Dec;78:154403. doi: 10.1016/j.jcrc.2023.154403. Epub 2023 Aug 29. J Crit Care. 2023. PMID: 37651780
-
Flow rate accuracy of infusion devices within healthcare settings: a systematic review.Ther Adv Drug Saf. 2023 Jul 21;14:20420986231188602. doi: 10.1177/20420986231188602. eCollection 2023. Ther Adv Drug Saf. 2023. PMID: 37492690 Free PMC article. Review.
Cited by
-
Contribution of intravenous medication diluent fluid composition on the development of dyschloremia in intensive care unit patients: A retrospective chart review.SAGE Open Med. 2025 Jul 17;13:20503121251356069. doi: 10.1177/20503121251356069. eCollection 2025. SAGE Open Med. 2025. PMID: 40689261 Free PMC article.
-
Outcomes of Intravenous Push versus Intermittent Infusion Administration of Cefepime in Critically Ill Patients.Antibiotics (Basel). 2023 Jun 1;12(6):996. doi: 10.3390/antibiotics12060996. Antibiotics (Basel). 2023. PMID: 37370315 Free PMC article.
-
Unsupervised machine learning analysis to identify patterns of ICU medication use for fluid overload prediction.medRxiv [Preprint]. 2024 Mar 22:2024.03.21.24304663. doi: 10.1101/2024.03.21.24304663. medRxiv. 2024. Update in: Pharmacotherapy. 2025 Feb;45(2):76-86. doi: 10.1002/phar.4642. PMID: 38562806 Free PMC article. Updated. Preprint.
-
Early Diuretics for De-resuscitation in Septic Patients With Left Ventricular Dysfunction.Clin Med Insights Cardiol. 2022 May 13;16:11795468221095875. doi: 10.1177/11795468221095875. eCollection 2022. Clin Med Insights Cardiol. 2022. PMID: 35592767 Free PMC article.
-
Evaluation of the Efficacy of Intravenous Push and Intravenous Piggyback Ceftriaxone in Critically Ill Patients.Antibiotics (Basel). 2024 Sep 26;13(10):921. doi: 10.3390/antibiotics13100921. Antibiotics (Basel). 2024. PMID: 39452188 Free PMC article.
References
-
- Silversides JA, Fitzgerald E, Manickavasagam US, et al.. Deresuscitation of patients with iatrogenic fluid overload is associated with reduced mortality in critical illness. Crit Care Med. 2018;46(10):1600-1607. - PubMed
Grants and funding
LinkOut - more resources
Full Text Sources
