

Waiting to vote safely: How Covid-19 safety measures shaped in-person voter wait times during the 2020 election
- PMID: 35602178
- PMCID: PMC9115441
- DOI: 10.1111/ssqu.13124
Waiting to vote safely: How Covid-19 safety measures shaped in-person voter wait times during the 2020 election
Abstract
Objective: The aim of this article is to assess the impact of Covid-19 safety measures on voter wait times during the 2020 U.S. election.
Methods: Multinomial logistic regression models predicting voter wait times contingent on the presence of Covid safety measures: poll workers wearing face coverings, protective barriers separating voters and workers, voters and booths socially distanced, hand sanitizer, single-use ballot marking pens, and cleaning voting booths between voters, as well as an additive index of these measures.
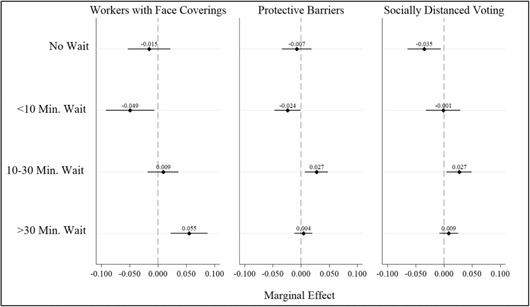
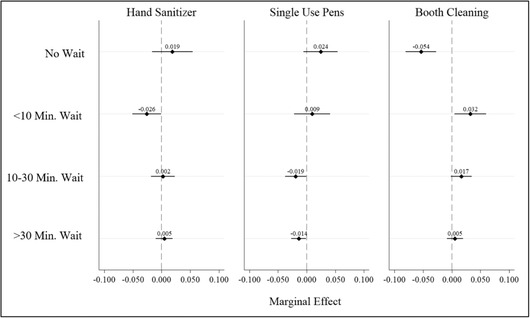
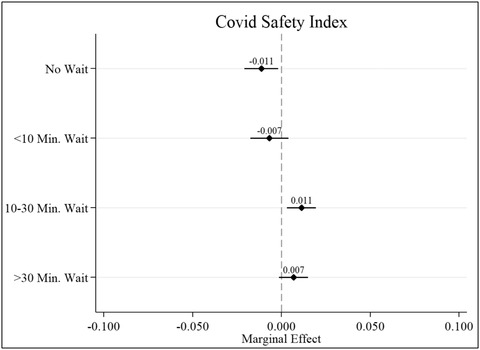
Results: Findings suggest Covid-safety measures significantly affected voter wait times. Effects vary by Covid safety feature, with face coverings, barriers, social distancing, and cleaning booths increasing voter wait times (typically around 10-30 min), single-use pens decreasing voter wait times, and hand sanitizer having no effect. Results are further confirmed using an additive index.
Conclusion: Covid safety features likely increased voter wait times during the 2020 U.S. election, potentially accounting for a portion of the increased voter wait time, compared to previous elections.
© 2022 The Authors. Social Science Quarterly published by Wiley Periodicals LLC on behalf of Southwestern Social Science Association.
Conflict of interest statement
The author declares no conflicts of interest.
Figures
Similar articles
-
Systematic literature review of postponed elections during COVID-19: Campaigns, regulations, and budgets.Heliyon. 2024 Feb 1;10(4):e25699. doi: 10.1016/j.heliyon.2024.e25699. eCollection 2024 Feb 29. Heliyon. 2024. PMID: 38370264 Free PMC article. Review.
-
Designing pandemic-resilient voting systems.Socioecon Plann Sci. 2022 Mar;80:101174. doi: 10.1016/j.seps.2021.101174. Epub 2021 Oct 23. Socioecon Plann Sci. 2022. PMID: 34720211 Free PMC article.
-
Adoption of Strategies to Mitigate Transmission of COVID-19 During a Statewide Primary Election - Delaware, September 2020.MMWR Morb Mortal Wkly Rep. 2020 Oct 30;69(43):1571-1575. doi: 10.15585/mmwr.mm6943e2. MMWR Morb Mortal Wkly Rep. 2020. PMID: 33119560 Free PMC article.
-
Emergency Absentee Voting for Hospitalized Patients and Voting During COVID-19: A 50-State Study.West J Emerg Med. 2021 Jul 15;22(4):1000-1009. doi: 10.5811/westjem.2021.4.50884. West J Emerg Med. 2021. PMID: 35354012 Free PMC article.
-
COVID-19 Public Health Measures During National Assembly Elections of the Republic of Korea.Osong Public Health Res Perspect. 2020 Aug;11(4):158-163. doi: 10.24171/j.phrp.2020.11.4.03. Osong Public Health Res Perspect. 2020. PMID: 32864305 Free PMC article. Review.
Cited by
-
Systematic literature review of postponed elections during COVID-19: Campaigns, regulations, and budgets.Heliyon. 2024 Feb 1;10(4):e25699. doi: 10.1016/j.heliyon.2024.e25699. eCollection 2024 Feb 29. Heliyon. 2024. PMID: 38370264 Free PMC article. Review.
References
-
- Atkeson, L. R. , Bryant L. A., Hall T. E., Saunders K., and Alvarez M.. 2010. “A New Barrier to Participation: Heterogeneous Application of Voter Identification Policies.” Electoral Studies 29(1):66–73.
-
- Ballard, J. 2020. “COVID‐19: Half of Voters Believe the Worst Is Yet to Come.” YouGov. November 5, 2020. https://today.yougov.com/topics/politics/articles‐reports/2020/11/05/cov....
-
- Center Bipartisan Policy . 2013. “Long Voting Times and the 2012 General Election.” Bipartisan Policy Center, July 23, 2013. https://bipartisanpolicy.org/blog/long‐voting‐times‐and‐2012‐general‐ele...
-
- Burden, B. C. , and Milyo J.. 2015. “The Quantities and Qualities of Poll Workers.” Election Law Journal 14(1):38–46.
-
- Cottrell, D. , Herron M. C., and Smith D. A.. 2021. “Voting lines, equal treatment, and early voting check‐in times in Florida.” State Politics & Policy Quarterly 21(2):109–38.
LinkOut - more resources
Full Text Sources