. 2021 Jul 30:1:20.
doi: 10.1038/s43856-021-00019-x. eCollection 2021.

Patient-derived organoids reflect the genetic profile of endometrial tumors and predict patient prognosis

Affiliations

Patient-derived organoids reflect the genetic profile of endometrial tumors and predict patient prognosis

Hege F Berg et al. Commun Med (Lond). .

Erratum in

Abstract

Background: A major hurdle in translational endometrial cancer (EC) research is the lack of robust preclinical models that capture both inter- and intra-tumor heterogeneity. This has hampered the development of new treatment strategies for people with EC.

Methods: EC organoids were derived from resected patient tumor tissue and expanded in a chemically defined medium. Established EC organoids were orthotopically implanted into female NSG mice. Patient tissue and corresponding models were characterized by morphological evaluation, biomarker and gene expression and by whole exome sequencing. A gene signature was defined and its prognostic value was assessed in multiple EC cohorts using Mantel-Cox (log-rank) test. Response to carboplatin and/or paclitaxel was measured in vitro and evaluated in vivo. Statistical difference between groups was calculated using paired t-test.

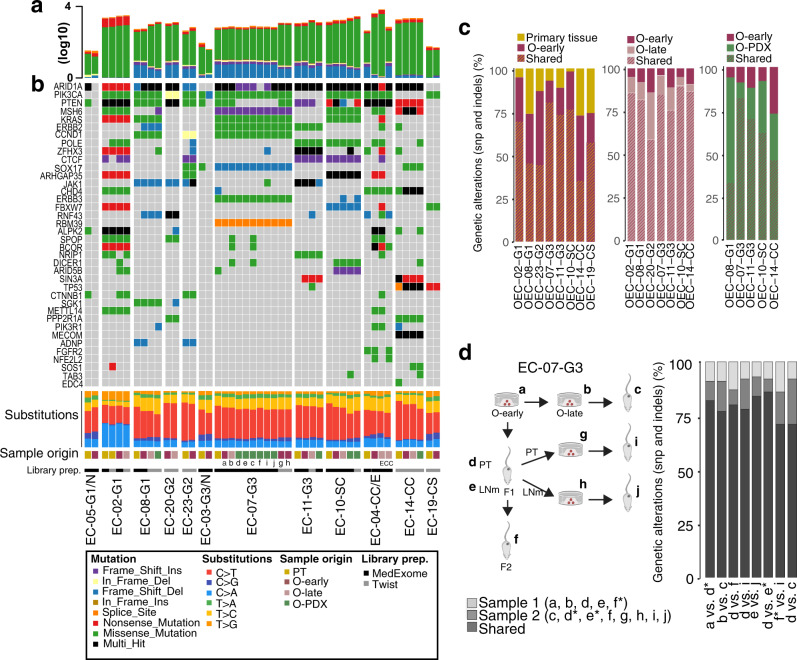
Results: We report EC organoids established from EC patient tissue, and orthotopic organoid-based patient-derived xenograft models (O-PDXs). The EC organoids and O-PDX models mimic the tissue architecture, protein biomarker expression and genetic profile of the original tissue. Organoids show heterogenous sensitivity to conventional chemotherapy, and drug response is reproduced in vivo. The relevance of these models is further supported by the identification of an organoid-derived prognostic gene signature. This signature is validated as prognostic both in our local patient cohorts and in the TCGA endometrial cancer cohort.

Conclusions: We establish robust model systems that capture both the diversity of endometrial tumors and intra-tumor heterogeneity. These models are highly relevant preclinical tools for the elucidation of the molecular pathogenesis of EC and identification of potential treatment strategies.

Keywords: Cancer genomics; Cancer models; Chemotherapy; Endometrial cancer.


Conflict of interest statement

Competing interestsThe authors declare no competing interests.

Figures

Fig. 1
Fig. 1. Tumor organoid cultures share histopathological features with corresponding patient tissue.
a Comparative H&E images of selected patient tissues with brightfield and H&E image of corresponding organoid cultures. b EC-04-CC/E patient tumor with both clear cell and endometrioid components was used to generate mixed histology organoids, shown in brightfield and H&E in the upper panel. The OEC-04-CC/E culture was subcloned into endometrioid organoids (middle panel) and clear cell organoids (lower panel) to preserve both tumor components in culture. c Multiplexed immunohistochemistry images of organoids stained with markers for epithelial cells (E-cadherin: red, pan-cytokeratin: green and EpCAM: white), leukocytes (CD45: red), fibroblasts (αSMA: green), and cell proliferation (Ki67: white). The heterogeneous expression of epithelial markers is seen within and between all cultures, while the cultures were negative for non-epithelial markers, indicating pure cancer cultures. Scale bars = 20 µm.
Fig. 2
Fig. 2. Organoid models mirror biomarker status and molecular subgroup of donor tissue.
a Expression levels in paired patient tissue (PT) and early (and late-) passaged organoids (O-early and O-late). Samples were classified according to the ProMiSE classifier: DNA mismatch repair deficiency (MMR-D) (loss of one or more MMR proteins), hotspot mutations in the exonuclease domain of DNA polymerase epsilon (POLE) (detected by Sanger sequencing) and p53 wt or mutated based on aberrant immunohistochemical staining patterns. Samples were not classified if they had low tumor purity. AT-rich interactive domain-containing protein 1 A (ARID1A) and phosphatase and tensin homolog (PTEN) were scored as homogenous positive (dark gray) or loss of (light gray) expression. All other markers were scored according to percentage positive expression as indicated in the figure. Estrogen receptor (ER), progesterone receptor (ER), epithelial cell adhesion molecule (EpCAM), L1 cell adhesion molecule (L1CAM). b Map using t-distributed stochastic neighbor embedding (tSNE) of single cells from CyTOF Hyperion images (26-markers) of EC organoid samples colored by cluster identifier. c tSNE plots showing Vimentin, EpCAM, E-cadherin, ER, PR, and β-catenin expression from all samples using a 0 to 1 normalization. d Stacked bar plot of single-cell phenotype densities in each organoid culture. Cell phenotypes are defined by combined PhenoGraph clusters.
Fig. 3
Fig. 3. Organoids are successfully engrafted orthotopically in NSG mice.
a NIRF imaging of orthotopically implanted organoids in NSG mice illustrating the presence of tumor in lower abdomen 4–52 weeks after implantation. b Ex vivo images depicting tumor burden in the uterus. c H&E section of xenografts showing histological subtype characteristics. The number of weeks from implantation to sacrifice are indicated. d Panel of immunohistochemical marker expression in the organoid implant (O-early) and corresponding organoid-based patient-derived xenograft (O-PDX). Protein abbreviations are as follows, estrogen receptor (ER); progesterone receptor (PR); L1 cell adhesion molecule (L1CAM); phosphatase and tensin homolog (PTEN); AT-rich interactive domain-containing protein 1A (ARID1A); epithelial cell adhesion molecule (EpCAM); mutS homolog 6 (MSH6); mutS homolog 2 (MSH2); PMS1 homolog 2 (PMS2); MLH1 mutL homolog 1 (MLH1). Markers were scored as described in Fig. 2. Scale bars = 20 µm.
Fig. 4
Fig. 4. Drug response in organoids can be reproduced in the corresponding O-PDX model.
a–c Seven organoid lineages were treated with different concentrations of Carboplatin (Carbo) and/or Paclitaxel (PTX). Viability was measured with CellTiter-Glo 3D Assay after 48 hours. Standard deviation was calculated from n ≥ 3 independent experiments. d Representative brightfield images depicting morphology of OEC-07-G3 untreated or after 48 h treatment with Carboplatin and/or Paclitaxel. e Growth of OPDX-07-G3 xenografts treated with 15 mg/kg Carboplatin and 12 mg/kg Paclitaxel (n = 11 mice) or saline (n = 13 mice) twice a week for five weeks (mean ±SEM). Treatment started when tumors reached >145 mm3 on T2-weighted MR images. Paired sample t test, *p < 0.05, **p < 0.001. Representative longitudinal T2-weighted MR images of xenografts showing uterine tumor size in treated vs. untreated mice. Scale bars = 20 µm.
Fig. 5
Fig. 5. Organoids and O-PDX models have a shared genomic landscape with corresponding patient tumors.
a Histogram denotes the total mutation burden in each sample (log10). b Oncoplot of somatic EC driver alterations and nucleotide substitution frequency in paired patient tissue (PT), organoid models (O-early and O-late), and organoid-based patient-derived xenograft (O-PDX) models. Sample annotation is indicated in the lower panel. Samples were prepared using MedExome or Twist capture systems as indicated in Figure. See method section for details and Supplementary Figure 6c for comparisons of the two methodologies. c Stacked bar charts showing overlap of nonsynonymous mutations in PT vs corresponding O-early, O-early vs O-late, and O-early vs O-PDX. d EC-07-G3 sample overview showing patient-derived (a, b) and xenograft-derived organoids (g, h), O-PDX models generated from early and late-passaged organoids (c, d, e), F2 generation O-PDX model generated by direct reimplantation of xenograft tissue (f) or by implanting xenograft-derived organoids (i, j). The stacked bar chart shows the overlap of nonsynonymous mutations between selected sample pairs from EC-07-G3.
Fig. 6
Fig. 6. Organoid gene-expression signature predicts survival in endometrial cancer patients.
a Dendrogram constructed by unsupervised hierarchical clustering of 13 organoid samples. OEC-04-E clustered together with OEC-02-G1 rather than its clear cell and mixed culture counterparts. RNA expression profile is similar between patient-derived and xenograft-derived organoids from EC-10-SC. b Disease-specific survival (DSS) according to gene signature score in a local EC microarray cohort (n = 256), c L1000 cohort (n = 380) and d the transcriptomic TCGA cohort (n = 524). Gene signature was dichotomized using mean signature score. Kaplan–Meier curves are presented by comparing two categories (number of patients investigated/number of patient deaths).

Similar articles

Cited by

References

    1. Siegel RL, Miller KD, Jemal A. Cancer statistics, 2019. CA. Cancer J. Clin. 2019;69:7–34. doi: 10.3322/caac.21551. - DOI - PubMed
    1. Carcangiu, M. L. WHO classification of tumours of female reproductive organs, fourth edition. Lyon: International Agency for Research on Cancer (I A R C)(UN) (2014).
    1. Cancer Genome Atlas Research N, et al. Integrated genomic characterization of endometrial carcinoma. Nature. 2013;497:67–73. doi: 10.1038/nature12113. - DOI - PMC - PubMed
    1. Marnitz, S. et al. A modern approach to endometrial carcinoma: will molecular classification improve precision medicine in the future? Cancers (Basel)12, 2577 (2020). - PMC - PubMed
    1. Concin, N. et al. ESGO/ESTRO/ESP Guidelines for the management of patients with endometrial carcinoma. Int J Gynecol Cancer31, 12–39 (2020). - PubMed