. 2021 Aug 23:1:24.
doi: 10.1038/s43856-021-00025-z. eCollection 2021.

Characterization of SARS-CoV-2 and host entry factors distribution in a COVID-19 autopsy series

Affiliations

Characterization of SARS-CoV-2 and host entry factors distribution in a COVID-19 autopsy series

Xiao-Ming Wang et al. Commun Med (Lond). .

Abstract

Background: SARS-CoV-2 is a highly contagious virus that causes the disease COVID-19. We have recently reported that androgens regulate the expression of SARS-CoV-2 host entry factors ACE2 and TMPRSS2, and androgen receptor (AR) in lung epithelial cells. We also demonstrated that the transcriptional repression of the AR enhanceosome inhibited SARS-CoV-2 infection in vitro.

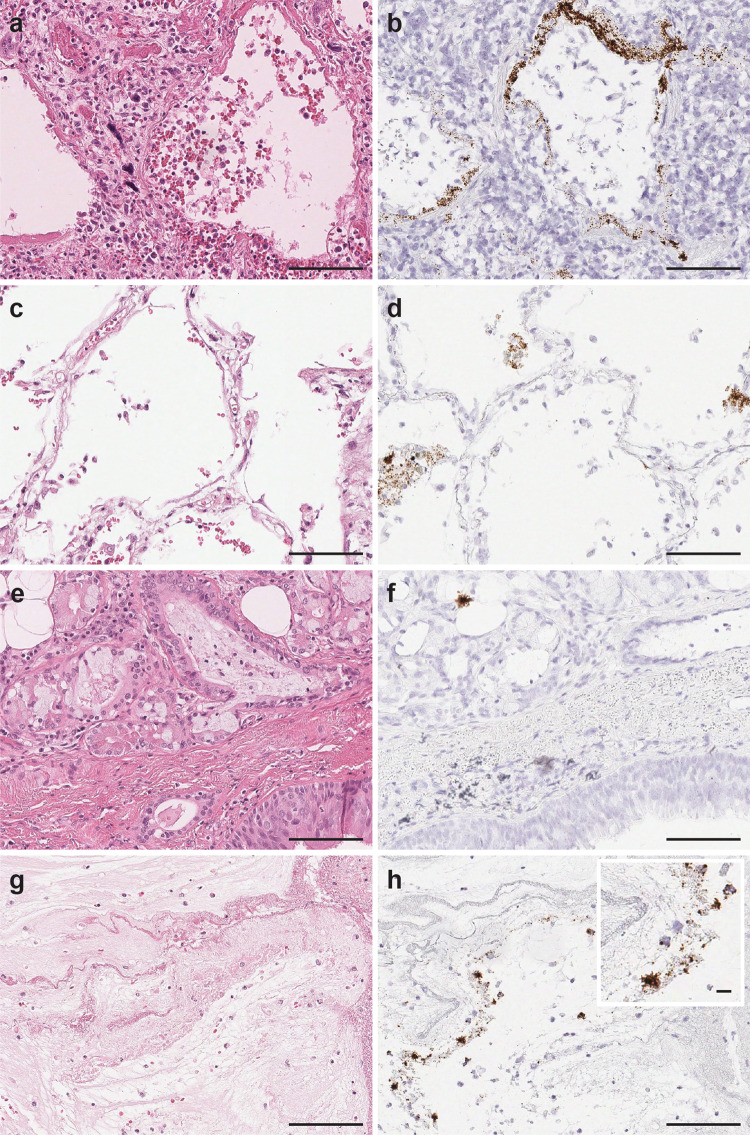
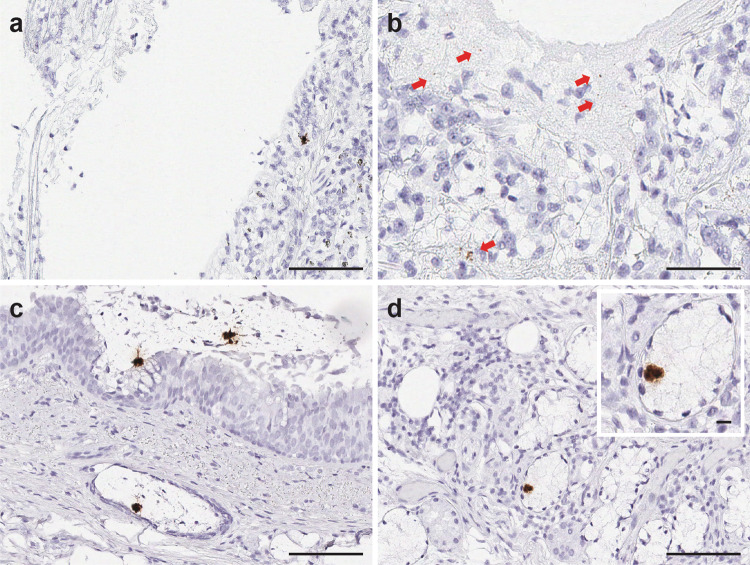
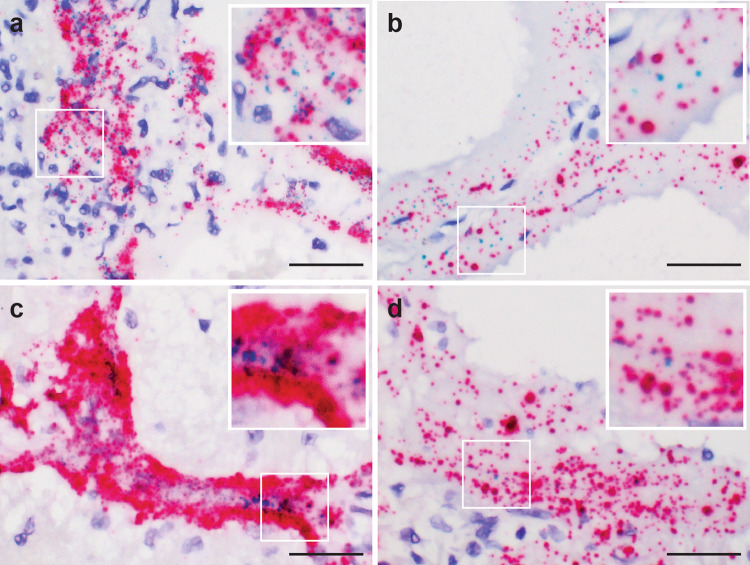
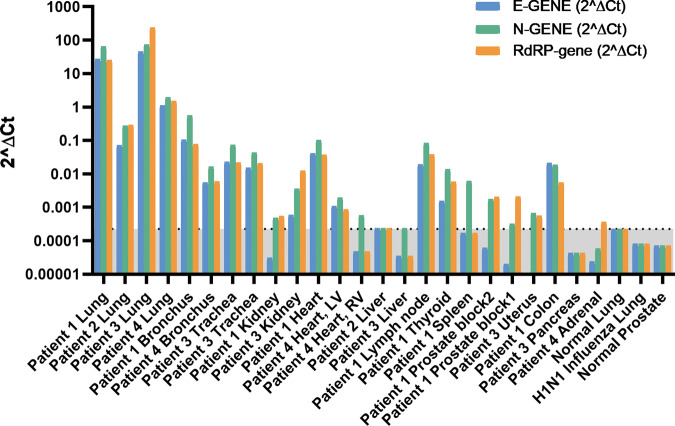
Methods: To better understand the various sites of SARS-CoV-2 infection, and presence of host entry factors, we extensively characterized the tissue distribution and localization of SARS-CoV-2 virus, viral replication, and host entry factors in various anatomical sites sampled via autopsy. We applied RNA in-situ-hybridization (RNA-ISH), immunohistochemistry (IHC) and quantitative reverse transcription polymerase chain reaction (qRT-PCR) approaches. We also assessed histopathological changes in SARS-CoV-2 infected tissues.

Results: We detect SARS-CoV-2 virus and viral replication in pulmonary tissues by RNA-ISH and IHC and a variety of non-pulmonary tissues including kidney, heart, liver, spleen, thyroid, lymph node, prostate, uterus, and colon by qRT-PCR. We observe heterogeneity in viral load and viral cytopathic effects among various organ systems, between individuals and within the same patient. In a patient with a history of kidney transplant and under immunosuppressant therapy, we observe an unusually high viral load in lung tissue by RNA-ISH, IHC and qRT-PCR. SARS-CoV-2 virus is also detected in this patent's kidney, liver and uterus. We find ACE2, TMPRSS2 and AR expression to overlap with the infection sites.

Conclusions: This study portrays the impact of dispersed SARS-CoV-2 infection in diverse organ systems, thereby facilitating avenues for systematic therapeutic approaches.

Keywords: Diagnostic markers; Gene expression analysis; Respiratory distress syndrome; Viral infection.


Conflict of interest statement

Competing interestsThe authors declare no competing interests.

Figures

Fig. 1
Fig. 1. SARS-CoV-2 virus detection in pulmonary parenchyma by SARS-CoV-2 spike RNA-ISH.
The viral signals were observed within the intra-alveolar hyaline membranes (a H&E and b SARS-CoV-2 spike RNA-ISH) and within the intact lining alveolar epithelial cells as well as in the desquamated alveolar epithelial cells (c H&E and d SARS-CoV-2 spike RNA-ISH). Viral particles were also noted in the nonalveolar region like bronchus as a cluster of viral signals within peri-bronchial sero-mucinous glands, as well as within the lining pseudostratified respiratory bronchial epithelium. (e H&E and f SARS-SoV-2 spike RNA-ISH). Viral signals were also detected in the necrotic and fibrinous material within damaged pulmonary tissue (g H&E and h SARS-CoV-2 spike RNA-ISH). Inset: Viral signals shown as individual punctate brown dots and clusters. Scale bars = 100 µm. Inset scale bar = 10 µm.
Fig. 2
Fig. 2. Detection of SARS-CoV-2 viral replication in pulmonary parenchyma by SARS-CoV-2-S-sense RNA-ISH.
SARS-CoV-2 viral replication events were observed in the intra-alveolar septal region (a), hyaline membranes lining the alveolar space (b), ciliated columnar respiratory epithelium of the bronchus (c), and the subepithelial sero-mucinous tracheal glands (d). Inset: a signal cluster representing viral replication. Scale bars = 200 µm in a, 100 microns in bd. Inset scale bar = 10 µm. Arrows point to RNA-ISH signals.
Fig. 3
Fig. 3. Co-detection of SARS-CoV-2 virus spike (S), nucleocapsid (N) genes, and viral replication in pulmonary parenchyma.
Co-expression of the SARS-CoV-2-S (green) and N (red) genes in the intra-alveolar (a) and hyaline membranes in lung parenchyma (b) utilizing the duplex RNA-ISH with probes against the SARS-CoV-2-N gene and -S gene. Co-detection of the SARS-CoV-2 virus (red) and viral replication (green) in the intra-alveolar and hyaline membranes in lung parenchyma (c, d) with probes against the SARS-CoV-2-N gene and minus strand of S gene. (a, c from patient 1, b, d from patient 3) Scale bars = 50 µm.
Fig. 4
Fig. 4. qRT-PCR of SARS-CoV-2 infection in COVID-19 autopsy tissues.
2(∆Ct) for SARS-CoV-2 E gene, N gene, and RdRP gene using RNaseP housekeeping gene as reference. The undetermined Ct was set to 40. Normal lung, H1N1 influenza lung, and normal prostate tissues were used as negative controls. The 2(∆Ct) of normal lung was set as a cutoff point (0.000224) and the gray area below the cutoff line is considered as SARS-CoV-2 negative. Minimum 1 out of the 3 genes should have Ct value < 40 (or 2(∆Ct) > 0.000224) to be considered as SARS-CoV-2 positive.
Fig. 5
Fig. 5. SARS-CoV-2 virus detection within lymph node.
Viral signal clusters were observed within lymph node germinal center as individual brown dots (a H&E and b SARS-CoV-2 RNA-ISH, in arrow pointed area). Scale bars = 50 µm.
Fig. 6
Fig. 6. SARS-CoV-2 infection in kidney transplant patient (patient 3) on immunosuppressant therapy.
Highly abundant viral signals were observed within the lung parenchyma exhibiting diffuse alveolar damage, reflecting the high SARS-CoV-2 virus infection load in Patient 3. The viral signals were detected in intra-alveolar hyaline membrane and interstitial fibroblastic proliferation region (a, b. SARS-CoV-2 RNA-ISH). Scattered viral signals were identified in the renal tubules (c H&E and d SARS-CoV-2 RNA-ISH). Scale bar =  500 µm in a, 100 µm in b, 50 µm in c, d.

References

    1. Polak, S. B., Van Gool, I. C., Cohen, D., von der Thusen, J. H. & van Paassen, J. A systematic review of pathological findings in COVID-19: a pathophysiological timeline and possible mechanisms of disease progression. Mod. Pathol. 33, 2128–2138 (2020). - PMC - PubMed
    1. de Wit E, van Doremalen N, Falzarano D, Munster VJ. SARS and MERS: recent insights into emerging coronaviruses. Nat. Rev. Microbiol. 2016;14:523–534. doi: 10.1038/nrmicro.2016.81. - DOI - PMC - PubMed
    1. WHO. WHO Transmission of SARS-CoV-2: implications for infection prevention precautions. Scientific brief https://www.who.int/news-room/commentaries/detail/transmission-of-sars-c.... (July 9 2020).
    1. Zhang YZ, Holmes EC. A genomic perspective on the origin and emergence of SARS-CoV-2. Cell. 2020;181:223–227. doi: 10.1016/j.cell.2020.03.035. - DOI - PMC - PubMed
    1. Gussow AB, et al. Genomic determinants of pathogenicity in SARS-CoV-2 and other human coronaviruses. Proc. Natl Acad. Sci. USA. 2020;117:15193–15199. doi: 10.1073/pnas.2008176117. - DOI - PMC - PubMed