. 2021 Oct 28:1:43.
doi: 10.1038/s43856-021-00043-x. eCollection 2021.

Development and multicenter validation of chest X-ray radiography interpretations based on natural language processing

Affiliations

Development and multicenter validation of chest X-ray radiography interpretations based on natural language processing

Yaping Zhang et al. Commun Med (Lond). .

Abstract

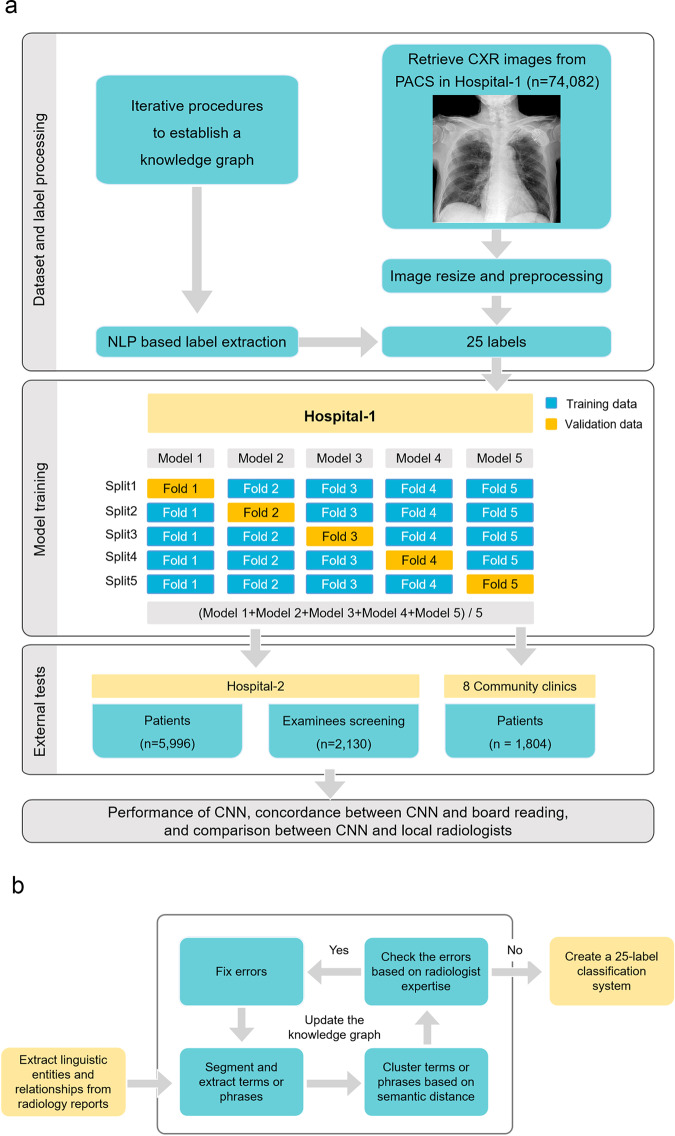
Background: Artificial intelligence can assist in interpreting chest X-ray radiography (CXR) data, but large datasets require efficient image annotation. The purpose of this study is to extract CXR labels from diagnostic reports based on natural language processing, train convolutional neural networks (CNNs), and evaluate the classification performance of CNN using CXR data from multiple centers.

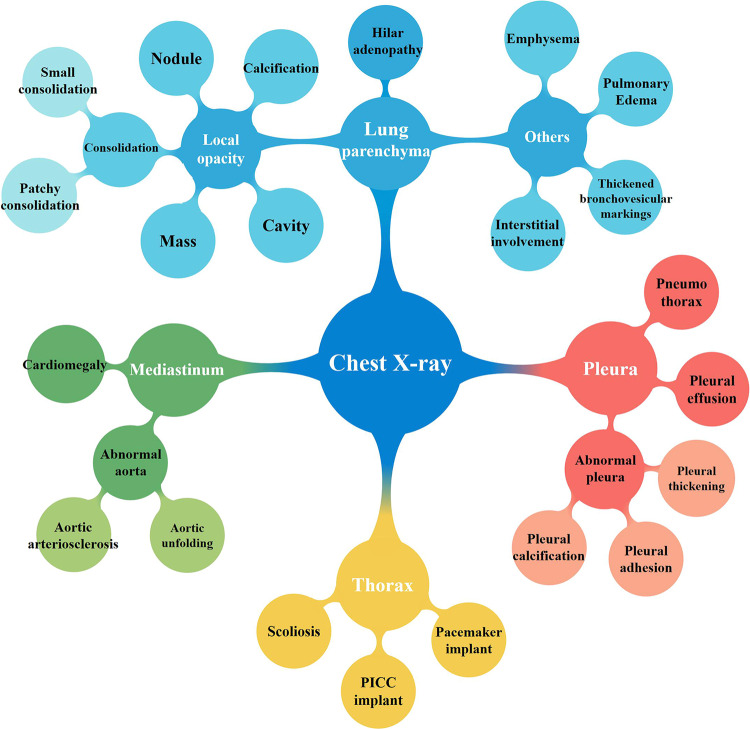
Methods: We collected the CXR images and corresponding radiology reports of 74,082 subjects as the training dataset. The linguistic entities and relationships from unstructured radiology reports were extracted by the bidirectional encoder representations from transformers (BERT) model, and a knowledge graph was constructed to represent the association between image labels of abnormal signs and the report text of CXR. Then, a 25-label classification system were built to train and test the CNN models with weakly supervised labeling.

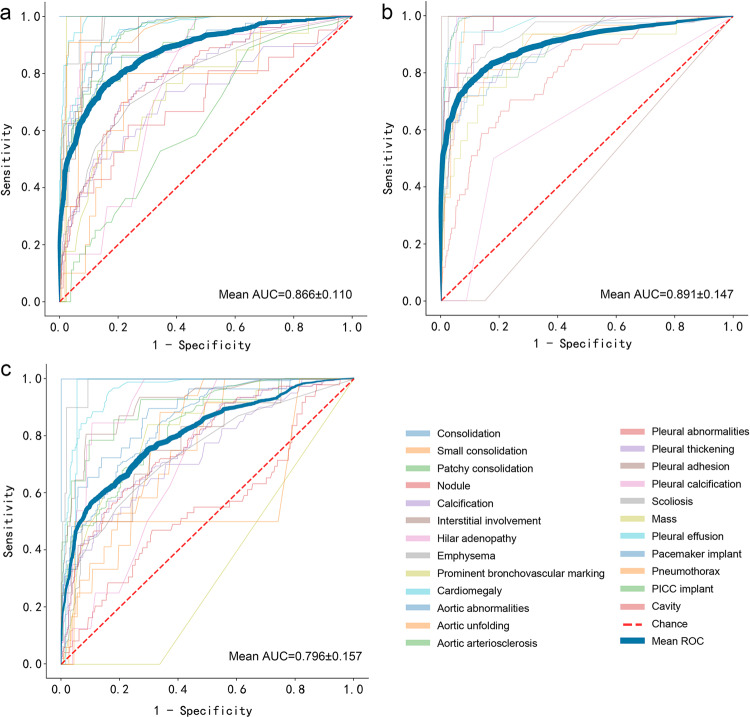
Results: In three external test cohorts of 5,996 symptomatic patients, 2,130 screening examinees, and 1,804 community clinic patients, the mean AUC of identifying 25 abnormal signs by CNN reaches 0.866 ± 0.110, 0.891 ± 0.147, and 0.796 ± 0.157, respectively. In symptomatic patients, CNN shows no significant difference with local radiologists in identifying 21 signs (p > 0.05), but is poorer for 4 signs (p < 0.05). In screening examinees, CNN shows no significant difference for 17 signs (p > 0.05), but is poorer at classifying nodules (p = 0.013). In community clinic patients, CNN shows no significant difference for 12 signs (p > 0.05), but performs better for 6 signs (p < 0.001).

Conclusion: We construct and validate an effective CXR interpretation system based on natural language processing.

Keywords: Computational biology and bioinformatics; Imaging.


Conflict of interest statement

Competing interestsThe authors declare the following competing interests: M.L., J.L. and X.C. are employees of Winning Health Technology Ltd., who have developed artificial intelligence methods and participated in drafting the technical part of this manuscript, but played no role in designing this study and analyzing the test data.

Figures

Fig. 1
Fig. 1. Diagram of research steps.
a Workflow of dataset preparation, model training, and external testing. The training dataset consists of chest X-ray radiographs (CXR) and corresponding diagnostic reports. By using the bidirectional encoder representations from transformers (BERT) model to identify language entities from the reports, we conducted an iterative process to build a knowledge graph with the semantic relationship between language entities and finally established 25 labels representing 25 abnormal signs in CXR. After training the convolutional neural networks (CNNs) based on fivefold stratified cross-validation and weakly supervised labeling, we conducted external tests in another hospital and eight community clinics. The tests included the performance of CNN, the concordance between CNN and board reading, and the comparison between CNN and local radiologists. b Workflow of image labeling based on the bidirectional encoder representations from transformers (BERT) natural language processing model with an expert amendment. We used the BERT model to recognize linguistic entities, entity span, semantic type of entities, and semantic relationships between entities. In an iterative process to establishing the knowledge graph with the semantic relationship between language entities, two radiologists examined the established knowledge graph, amended the extracted linguistic entities, and clarified linguistic relationships based on their clinical experience. Finally, 25 labels representing 25 abnormal signs were established. CXR chest X-ray radiography, BERT the bidirectional encoder representations from transformers, CNN convolutional neural network, PACS picture archiving and communication system, NLP natural language processing.
Fig. 2
Fig. 2. Diagram of 25 labels of abnormal signs extracted from the radiology reports by the bidirectional encoder representations from transformers (BERT) model.
According to the anatomical region, the linguistic entities describing abnormal signs on chest X-ray radiographs were divided into four categories: pleura, lung parenchyma, mediastinum, and thoracic wall. The words in white color refer to anatomical regions or general categories. The words in black color represent labels of abnormal signs.
Fig. 3
Fig. 3. Receiver operating characteristic (ROC) curves of 25 abnormal signs on CXR in the three external test cohorts.
a In the cohort of symptomatic patients in the academic hospital, the mean AUC was 0.866 ± 0.110. The AUCs of major abnormal signs, i.e., consolidation, nodule, mass, pneumothorax, and pleural effusion, were 0.900 (95% CI: 0.849–0.943), 0.698 (0.581–0.806), 0.977 (0.965–0.988), 0.963 (0.925–0.991), and 0.988 (0.980–0.994), respectively. b In the cohort of asymptomatic screening examinees in the academic hospital, the mean AUC was 0.891 ± 0.147. The AUCs of common signs, i.e., consolidation and nodule, were 0.876 (0.817–0.920) and 0.796 (0.725–0.838), respectively. c In the cohort of symptomatic patients in eight community clinics, the mean AUC was 0.796 ± 0.157. The AUCs of major signs, i.e., consolidation, nodule, and mass, were 0.873 (95% CI: 0.815–0.926), 0.698 (0.619–0.771), and 1.000 (0.991–1.000), respectively.
Fig. 4
Fig. 4. Number and percentage of concordant labels between the convolutional neural network (CNN) and expert consensus reading in the three test cohorts.
a In the cohort of symptomatic patients in the academic hospital, 2092 patients (34.8%) showed consistency on 25 signs between CNN and the consensus reading, and 1121 (18.7%), 1049 (17.5%), and 881 (14.7%) patients showed consistency on 24, 23, and 22 signs, respectively. Overall, CNN correctly classified ≥22 (88%) abnormal signs in 5142 patients (85.8%). b In the cohort of asymptomatic screening examinees in the academic hospital, 1010 (47.4%), 456 (21.4%), 366 (17.2%), and 198 (9.3%) patients showed consistency on 25, 24, 23, and 22 signs between CNN and the consensus reading, respectively. Overall, CNN correctly classified ≥22 signs in 2030 (95.3%) patients. c In the cohort of symptomatic patients in eight community clinics, 566 (31.4%), 474 (26.3%), 350 (19.4%), and 245 (13.6%) patients showed consistency between CNN and the consensus reading on 25, 24, 23, and 22 labels, respectively. Overall, CNN correctly classified ≥22 (88%) abnormal signs in 1636 (90.7%) patients.
Fig. 5
Fig. 5. Representative chest radiographs overlaid with class activation maps (CAM) showing the active area of convolutional neural network (CNN).
a The inferior lung field of the left lung is overlaid by CAM, which reveals a patchy density (white arrow). The CNN noted that this case had a “patchy consolidation” sign, while the other 24 abnormal signs were absent. b The middle and lower fields of the left lung are overlaid by CAM, which reveals a pulmonary nodule (white arrow). The CNN indicated that this case had a “nodule” sign, while the other 24 abnormal signs were absent. c The upper right lung is overlaid by CAM. The CNN indicated that this case has a “pneumothorax” label. The radiologists confirmed this finding and found visible visceral pleural margins (white arrow), but there was no lung texture outside this line. The other 24 abnormal signs were absent. d The lower right lung is overlaid by CAM. The CNN indicated that this case has a “hydrothorax” sign. The radiologists confirmed this finding and identified an air-fluid level (white arrow). e The upper field and lower field of the left lung are overlaid by CAMs. The CNN indicated that this case had “patchy consolidation” and “pleural effusion” signs. The other 23 abnormal signs were absent. The radiologists confirmed CNN’s findings (white arrows).

References

    1. Raoof S, Feigin D, Sung A, Irugulpati L, Rosenow EC., 3rd Interpretation of plain chest roentgenogram. Chest. 2012;141:545–558. doi: 10.1378/chest.10-1302. - DOI - PubMed
    1. Rimmer A. Radiologist shortage leaves patient care at risk, warns royal college. BMJ. 2017;359:j4683. doi: 10.1136/bmj.j4683. - DOI - PubMed
    1. Jiang, B. et al. Development and application of artificial intelligence in cardiac imaging. Br. J. Radiol. 93, 20190812 (2020). - PMC - PubMed
    1. Ardila D, et al. End-to-end lung cancer screening with three-dimensional deep learning on low-dose chest computed tomography. Nat. Med. 2019;25:954–961. doi: 10.1038/s41591-019-0447-x. - DOI - PubMed
    1. Zhang Y, et al. Motion-corrected coronary calcium scores by a convolutional neural network: a robotic simulating study. Eur. Radiol. 2020;30:1285–1294. doi: 10.1007/s00330-019-06447-7. - DOI - PubMed