. 2022 May 5:10:886721.
doi: 10.3389/fcell.2022.886721. eCollection 2022.

Age Dependent Changes in Corneal Epithelial Cell Signaling

Affiliations

Age Dependent Changes in Corneal Epithelial Cell Signaling

Kristen L Segars et al. Front Cell Dev Biol. .

Abstract

The cornea is exposed daily to a number of mechanical stresses including shear stress from tear film and blinking. Over time, these stressors can lead to changes in the extracellular matrix that alter corneal stiffness, cell-substrate structures, and the integrity of cell-cell junctions. We hypothesized that changes in tissue stiffness of the cornea with age may alter calcium signaling between cells after injury, and the downstream effects of this signaling on cellular motility and wound healing. Nanoindentation studies revealed that there were significant differences in the stiffness of the corneal epithelium and stroma between corneas of 9- and 27-week mice. These changes corresponded to differences in the timeline of wound healing and in cell signaling. Corneas from 9-week mice were fully healed within 24 h. However, the wounds on corneas from 27-week mice remained incompletely healed. Furthermore, in the 27-week cohort there was no detectable calcium signaling at the wound in either apical or basal corneal epithelial cells. This is in contrast to the young cohort, where there was elevated basal cell activity relative to background levels. Cell culture experiments were performed to assess the roles of P2Y2, P2X7, and pannexin-1 in cellular motility during wound healing. Inhibition of P2Y2, P2X7, or pannexin-1 all significantly reduce wound closure. However, the inhibitors all have different effects on the trajectories of individual migrating cells. Together, these findings suggest that there are several significant differences in the stiffness and signaling that underlie the decreased wound healing efficacy of the cornea in older mice.

Keywords: calcium mobilization; cell-cell communication; cornea; live cell imaging; stiffness.


Conflict of interest statement

The authors declare that the research was conducted in the absence of any commercial or financial relationships that could be construed as a potential conflict of interest.

Figures
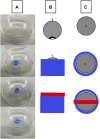
FIGURE 1
FIGURE 1
Schematic of eye stabilization using a 3D printed holder. (A) A 3D printed holder (blue) is adhered to a MatTek p35 cover slip, the intact globe is placed within the holder with the cornea facing down, and the cover is placed over the center of the eye and adhered to the holder. (B) A lateral view of eye orientation (grey circular object) and the relative sizes of the holder (blue) and weighted cover (red). (C) The top-down view of the holder setup.
FIGURE 2
FIGURE 2
Comparison of corneal stiffness between 9- and 27-week mice. Nanoindentation was performed to compare the stiffness of the corneal epithelium, stroma, and basement membrane between enucleated globes from 9- and 27-week mice. Significance was determined by a two-tailed Student’s t-test comparing epithelium [(A) ****p < 0.0001], stroma [(B) ****p < 0.0001] and basement membrane [(C) not significant, (p = 0.506)] between 9- and 27- week mice. The data represent four eyes per condition, with each eye from one mouse.
FIGURE 3
FIGURE 3
Cells enter the wound bed within 2 h of injury in 27-week but not 9-week old mouse corneas. Enucleated globes were stained with CellMask DeepRed (greyscale) and imaged on the Zeiss LSM 880 confocal microscope to observe wound healing progress for 1 hour and 45 min. T = 0 is 15 min after injury. There is a 15-min interval between each image. The border of the wound was traced at each time point using ImageJ and superimposed on the image. Previous wound borders were also superimposed to track changes in the wound border over time. The right-most image depicts the superimposed changes in the wound edge tracked through time. The wound border in the cornea from 9-week mice (A) remained approximately the same throughout the duration of the experiment. In the corneas from 27-week mice (B) the perimeter of the wound became smaller due to an influx of cells into the wound bed. The data represent three eyes per condition, with each eye from one mouse. Scale bar represents 50 microns.
FIGURE 4
FIGURE 4
Wound healing occurs more rapidly in 9-week than 27-week mice. Enucleated globes were stained with CellMask DeepRed (red) and imaged using the Zeiss LSM 880 confocal microscope both before and after healing for 24 h in growth media. Images were taken of corneal wounds 15 min or 24 h after injury in both 9-week (A,C) and 27-week (B,D) mice. In all images, the wound is marked with a white asterisk. Twelve optical sections of one micron each were taken for every condition and Zen software was used to make a 2.5D topographical map of the wounds in the corneas. After 24 h, wounds in 9-week mice had fully closed. Wounds in 27-week mice remained open. Wound depth (Two-tailed Student’s t-test, p = 0.999) and diameter (Two-tailed Student’s t-test, p = 0.999) were consistent between samples. The data represent three eyes per condition, with each eye from one mouse. Scale bar represents 20 microns.
FIGURE 5
FIGURE 5
Calcium signaling events occur in basal cells adjacent to the wound in corneas from 9-week mice. Calcium signaling events were monitored in apical and basal layers of the corneal epithelium after injury. (A) Schematic of cell-based approach for calcium analysis shows a representative image of cells, and detection of these cells by MATLAB using coordinates from the video. The changes in intensity of each cell over time are shown using a kymograph. MATLAB detected events were identified from the kymograph as changes in intensity greater than a threshold of 40% of maximum intensity. (B) Representative MATLAB detected events from basal and apical z-planes of corneal epithelium. (C) Mean percent change of the signaling events for apical and basal layers of the age cohorts. The data represent four eyes per condition, with each eye from one mouse. Data are means ± SEM. There were significantly more detected signaling events in the basal cells in 9-week corneas. (Two-tailed paired Student’s t-test comparing signaling events at the wound to background signaling at the same Z-plane; *p < 0.05). No significant differences over background were detected between apical cells from either age cohort or between basal cells from older mice.
FIGURE 6
FIGURE 6
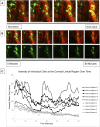
Calcium mobilizations are detected in epithelial cells adjacent to nerves in the corneal limbal region. Enucleated globes from 9 to 13 week mice were stained with CellMask DeepRed (red) membrane stain and Fluo-4, AM (green) calcium indicator, wounded, and imaged in the limbal region of the cornea for 1 h using the Zeiss LSM 880 confocal microscope. Imaging started 15 min after injury (T = 0). (A) Confocal imaging through the thickness of the corneal limbal region revealed high basal cell activity adjacent to nerves (white asterisk). (B) Basal cells were imaged over time at a rate of one frame per 3 s to identify calcium signaling events. The top row depicts tissue stained with CellMask DeepRed and Fluo-4 for cell visualization, and the bottom row depicts the same tissue with Fluo-4 only. (C) Quantification of the intensity of the cells labelled in (B) over time demonstrates that cells adjacent to the nerve display distinct signaling events at 0, 25, and 42 min after imaging began. At the 25 and 42 min signaling events a previously inactive neighboring cell (Nerve-Adjacent 5) was activated. All cells denoted “Nerve-Adjacent” are within 100 microns of the nerve. The data represent five eyes per condition, with each eye from one mouse. Scale bar is 50 microns.
FIGURE 7
FIGURE 7
Localization of pannexin-1 is elevated in corneas from younger mice at the wound edge. Enucleated globes were scratch wounded and allowed to heal for two or 5 h. Globes were fixed in 4% paraformaldehyde, corneas were dissected, and immunohistochemistry was performed to visualize localization of pannexin-1 near the wound edge (green). Imaging was performed using the Zeiss LSM 880 confocal microscope. Topographical maps denoting the intensity of staining throughout the region were generated from the imaging data. (A) In younger mice, pannexin-1 localization is diffuse at 2 h, with similar expression adjacent to and further away from the wound. This is seen in the topographical map as a relatively flat, green diagram. (B) In younger mice at 5 h, the increase in pannexin-1 near the wound edge is detected as red peaks in the topographical map. (C,D) Older mice have a similar localization of pannexin-1 throughout the epithelium at both two and 5 h. The data represent three eyes per condition, with each eye from one mouse. Scale bar is 50 microns.
FIGURE 8
FIGURE 8
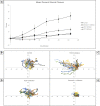
Inhibition of pannexin-1, P2X7, or P2Y2 have different effects on cellular trajectory at the wound edge but all decrease percent wound closure. Confluent Human Corneal Limbal Epithelial cell cultures were pre-incubated in the presence or absence of inhibitors, stained with the SiR Actin, scratch-wounded, and imaged at a rate of one frame per 5 min for 2 h using the Zeiss LSM 880 confocal microscope. (A) Inhibition of pannexin-1, P2X7, or P2Y2 led to significantly diminished wound closure at the 2 h time point. Two-tailed Student’s t-tests were performed to compare the percent wound closure of each inhibitor to an uninhibited control (*p < 0.05 for all inhibitors). The path of individual cells at the wound edge was plotted using ImageJ and normalized so that motility towards the wound is represented as movement along the y-axis in the positive direction, and movement in the parallel direction is plotted along the x-axis. Controls (B) were scratch-wounded but not pre-incubated with an inhibitor. (C) Pre-incubation with ArC 118925XX, a competitive inhibitor to P2Y2, results in uncoordinated and undirected migration. (D) Pre-incubation with A438079, a competitive inhibitor to P2X7, causes cells to remain closer to their location of origin than they do in controls. (E) Pre-incubation with 10PanX, an inhibitor to pannexin-1, causes cells to remain closer to their position of origin than in both the control and in the P2X7-inhibited conditions. Data represents a minimum of three independent experiments for each condition.

References

    1. Bao L., Locovei S., Dahl G. (2004). Pannexin Membrane Channels Are Mechanosensitive Conduits for ATP. FEBS Lett. 572 (1-3), 65–68. 10.1016/j.febslet.2004.07.009 - DOI - PubMed
    1. Bhalla-Gehi R., Penuela S., Churko J. M., Shao Q., Laird D. W. (2010). Pannexin1 and Pannexin3 Delivery, Cell Surface Dynamics, and Cytoskeletal Interactions. J. Biol. Chem. 285 (12), 9147–9160. 10.1074/jbc.m109.082008 - DOI - PMC - PubMed
    1. Blanco-Mezquita J. T., Hutcheon A. E. K., Stepp M. A., Zieske J. D. (2011). αVβ6 Integrin Promotes Corneal Wound Healing. Invest. Ophthalmol. Vis. Sci. 52 (11), 8505–8513. 10.1167/iovs.11-8194 - DOI - PMC - PubMed
    1. Boucher I., Rich C., Lee A., Marcincin M., Trinkaus-Randall V. (2010). The P2Y2receptor Mediates the Epithelial Injury Response and Cell Migration. Am. J. Physiology-Cell Physiol. 299 (2), C411–C421. 10.1152/ajpcell.00100.2009 - DOI - PMC - PubMed
    1. Brown C. T., Vural M., Johnson M., Trinkaus-Randall V. (1994). Age-related Changes of Scleral Hydration and Sulfated Glycosaminoglycans. Mech. Ageing Dev. 77 (2), 97–107. 10.1016/0047-6374(94)90018-3 - DOI - PubMed

LinkOut - more resources