. 2022 Apr 29;25(5):104334.
doi: 10.1016/j.isci.2022.104334. eCollection 2022 May 20.

Increased glycine contributes to synaptic dysfunction and early mortality in Nprl2 seizure model

Affiliations

Increased glycine contributes to synaptic dysfunction and early mortality in Nprl2 seizure model

Brianne Dentel et al. iScience. .

Abstract

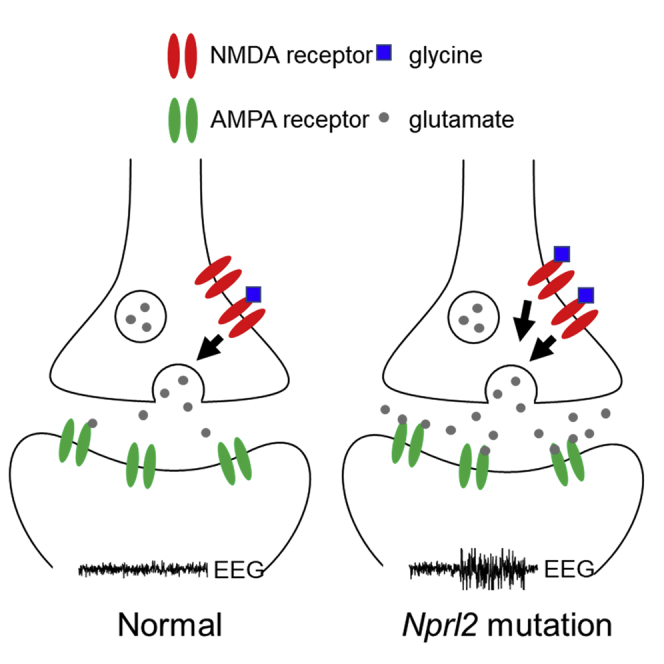
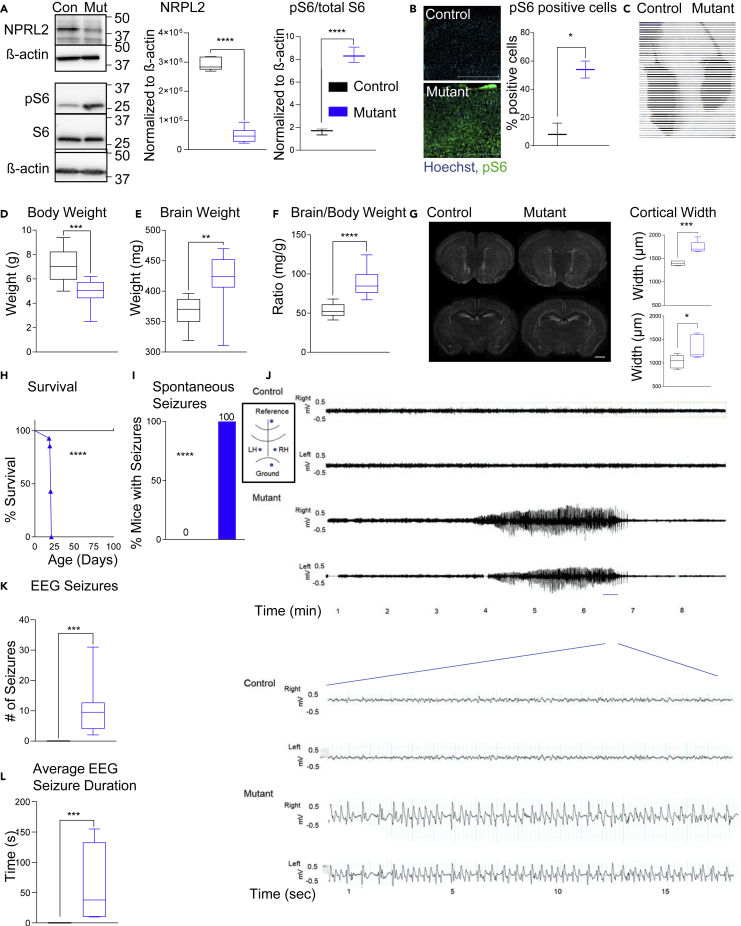
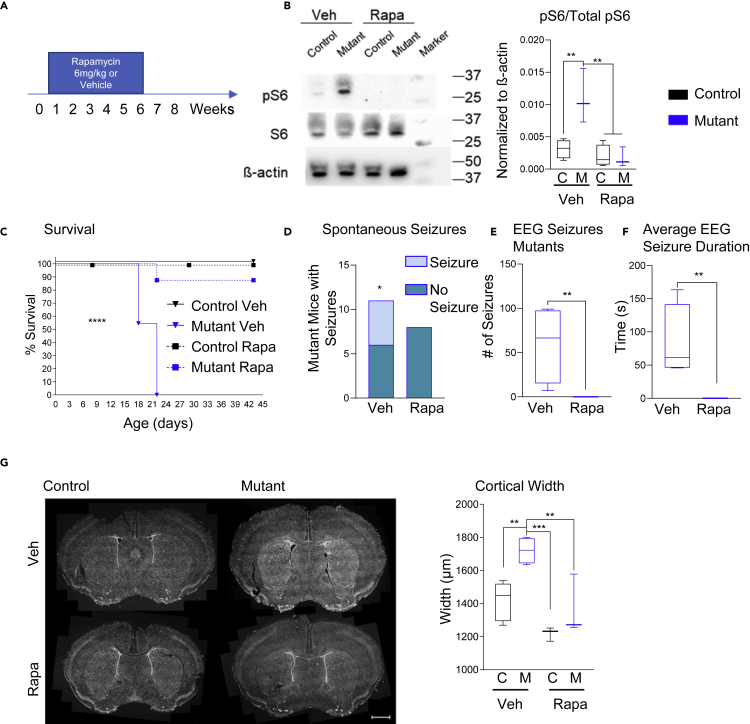
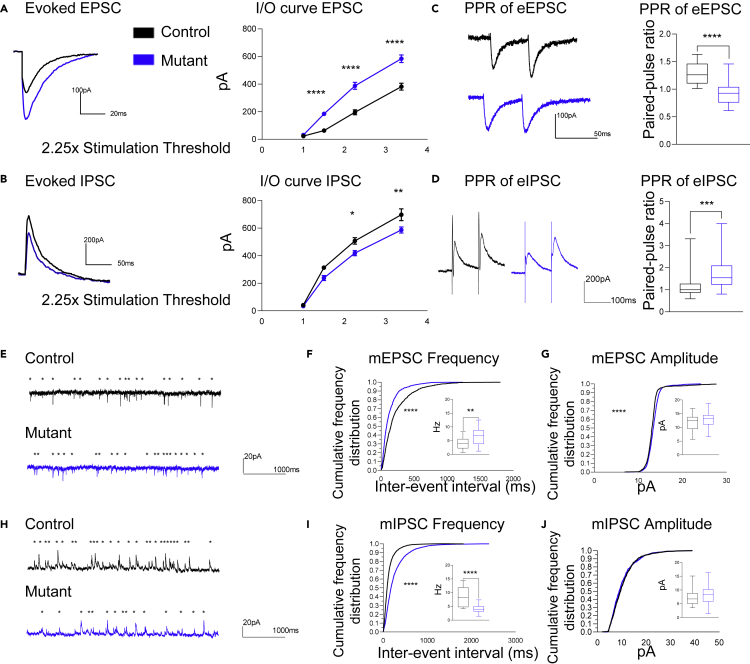
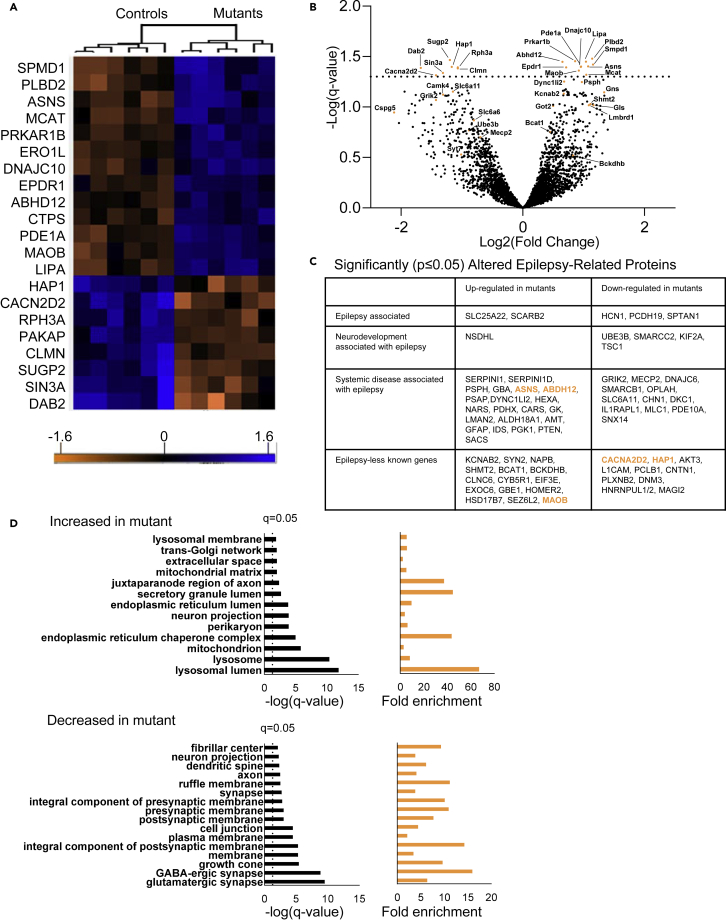
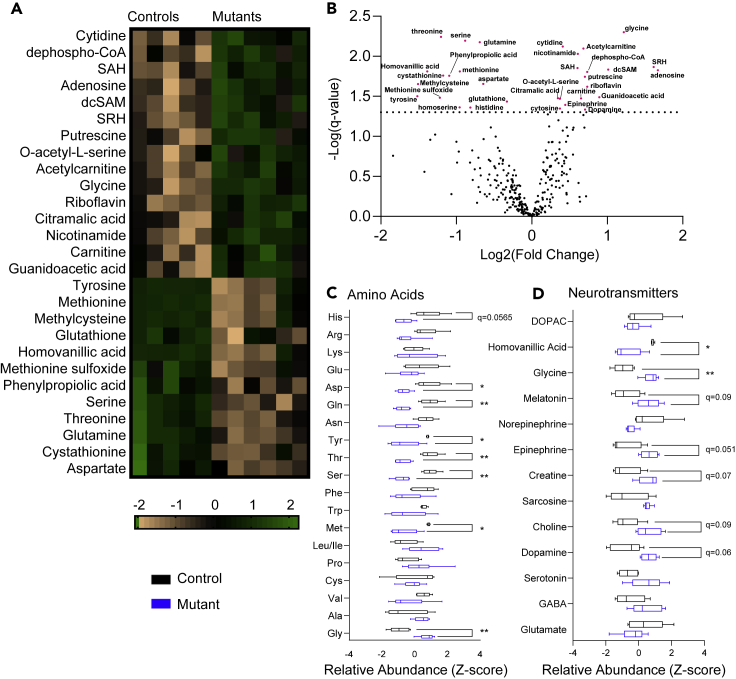
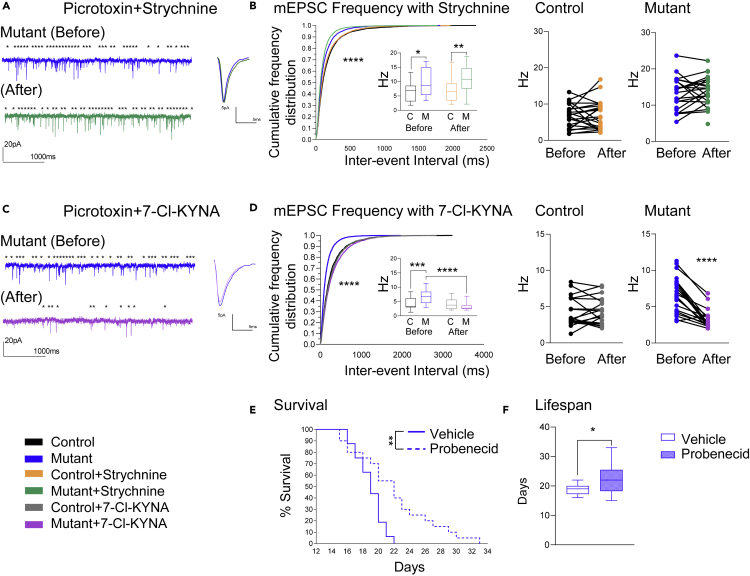
Targeted therapies for epilepsies associated with the mTORC1 signaling negative regulator GATOR1 are lacking. NPRL2 is a subunit of the GATOR1 complex and mutations in GATOR1 subunits, including NPRL2, are associated with epilepsy. To delineate the mechanisms underlying NPRL2-related epilepsies, we created a mouse (Mus musculus) model with neocortical loss of Nprl2. Mutant mice have increased mTORC1 signaling and exhibit spontaneous seizures. They also display abnormal synaptic function characterized by increased evoked and spontaneous EPSC and decreased evoked and spontaneous IPSC frequencies, respectively. Proteomic and metabolomics studies of Nprl2 mutants revealed alterations in known epilepsy-implicated proteins and metabolic pathways, including increases in the neurotransmitter, glycine. Furthermore, glycine actions on the NMDA receptor contribute to the electrophysiological and survival phenotypes of these mice. Taken together, in this neuronal Nprl2 model, we delineate underlying molecular, metabolic, and electrophysiological mechanisms contributing to mTORC1-related epilepsy, providing potential therapeutic targets for epilepsy.

Keywords: metabolomics; molecular neuroscience; neuroscience; omics.


Conflict of interest statement

The authors declare no competing interests.

Figures

None
Graphical abstract
Figure 1
Figure 1
Emx1cre; Nprl2 cKO mice have increased mTORC1 activity and spontaneous seizures (A) Western blot analysis of NPRL2, pS6, and S6 in whole-cell lysates of P16 neocortex. Unpaired two-tailed Student’s t test, n = 5 controls, six mutants. (B) Representative immunohistochemistry for pS6 staining in the neocortex. 10× magnification. Unpaired two-tailed Student’s t test, n = 2 controls, two mutants. Scale bar, 500μm. (C) Representative picture of body size difference, control (left) and mutant (right). (D–F) Body weight (g), brain weight (mg), and brain/body weight ratio (mg/g) for control and conditional knockout (cKO) mutants. Unpaired two-tailed Student’s t test, n = 16 control, nine mutants. (G) Representative images of Hoechst-stained coronal slices through the neocortex. Control slices (left) and mutant slices (right). Anterior slices (top) and posterior slices (bottom). Scale bar, 1000μm. Unpaired two-tailed Student’s t test, n = 5 controls, five mutants (top) six mutants (bottom). (H) Kaplan-Meier survival curve of control and mutant mice. Mutant mice die by P21. Log rank Mantel Cox test, n = 19 controls, 14 mutants. (I) Percent of mice that had at least one seizure after handling. Fisher exact test two-sided, n = 20 each genotype. (J) Representative placement of subdural electrodes. Representative video-EEG paired traces of a seizure in a mutant mouse (trace from control is from corresponding period [no seizures were identified in control mice]). Each trace is from either the right hemisphere (RH) or left hemisphere (LH) of each mouse. Bottom traces are zoomed-in views of period indicated by blue line. n = 7 controls, 8 mutants. (K) Number of seizures per mouse recorded over 12 h of EEG. Unpaired two-tailed Student’s t test, n = 7 controls, 8 mutants. (L) Average seizure duration per mouse on EEG. Mann-Whitney two-tailed U-test, n = 7 controls, 8 mutants. Whiskers represent minimum to maximum; box represents 25–75 percentile; line represents median. ∗p < 0.05; ∗∗p < 0.01; ∗∗∗p < 0.001; ∗∗∗∗p < 0.0001.
Figure 2
Figure 2
Emx1cre; Nprl2 cKO mice survival and seizures are rescued by mTOR inhibition (A) Depiction of rapamycin (rapa) and vehicle (veh) treatments. Mice were treated 3 times a week with either veh or 6 mg/kg rapamycin administered IP. (B) Western blot analysis of pS6, S6, and β-actin. One-way ANOVA, n = 3 mice per group. (C) Kaplan-Meier survival curve of control and mutant mice with vehicle treatment or rapamycin treatment. Log rank Mantel-Cox test, n = 7 veh-treated controls, 11 veh-treated mutants, 17 rapa-treated controls, and 8 rapa-treated mutants. (D) Number of mice observed with seizures during 10- to 20-min period following treatment. Fischer’s exact test, two-sided, n = 11 veh-treated mutants, 8 rapa-treated mutants. (E) Number of seizures per mutant mouse recorded over 12 h of EEG. Mann-Whitney two-tailed U-test, n = 4 veh-treated mutants, 5 rapa-treated mutants. (F) Average seizure duration per mutant mouse on EEG. Mann-Whitney two-tailed U-test, n = 4 veh-treated mutants, 5 rapa-treated mutants. (G) Representative images of Hoechst-stained coronal brain slices. One-way ANOVA, n = 5 veh-treated controls, 4 veh-treated mutants, 3 rapa-treated controls, and 3-rapa treated mutants. C = control, M = mutant. Whiskers represent minimum to maximum; box represents 25–75 percentile; line represents median. ∗p < 0.05; ∗∗p < 0.01; ∗∗∗p < 0.001; ∗∗∗∗p < 0.0001.
Figure 3
Figure 3
Emx1cre; Nprl2 cKO mice layer 2/3 neurons have increased synaptic excitation and decreased inhibition (A) Evoked EPSCs n = 19 cells/6 mice controls, 18 cells/five mice mutants. Representative traces on left; input/output curve on right. two-way ANOVA with Šidák’s multiple comparisons. (B) Evoked IPSCs: n = 26 cells/7 mice controls, 26 cells/6 mice mutants. Representative traces on left; input/output curve on right. two-way ANOVA with Šidák’s multiple comparisons. (C) Representative traces and quantification of paired-pulse ratio (PPR) of eEPSC, 50ms, Unpaired two-tailed Student’s t test. n = 21 cells/6 mice each group. (D) Representative traces and quantification of PPR of eIPSC, 100ms, Unpaired, two-tailed Mann-Whitney U-test. n = 21 cells/6 mice controls, 24 cells/6 mice mutants. (E) Representative mini (m)EPSC traces. (F) mEPSC frequency n = 35 cells/11 mice controls, 33 cells/9 mice mutants, and (G) amplitude in control and mutant mice n = 31 cells/11 mice controls, 33 cells/9 mice mutants (H) Representative mini (m)IPSC traces. (I) mIPSC frequency and (J) amplitude in controls and mutants. n = 21 cells/8 controls, 24 cells/9 mutants. For bar graphs (D, F, G, and J) in this figure, the data did not pass normality test, so we used the Mann-Whitney two-tailed U-test. Cumulative frequency distribution statistical test was Kolmogorov-Smirnov. Asterisks over traces indicate events above threshold. Whiskers represent minimum to maximum; box represents 25–75 percentile; line represents median. ∗p < 0.05; ∗∗p < 0.01; ∗∗∗p < 0.001; ∗∗∗∗p < 0.0001.
Figure 4
Figure 4
Proteomic analysis reveals downregulated synapse components and altered epilepsy-related proteins (A) Liquid chromatography-mass spectrometry (LC-MS/MS) heatmap of proteins derived from neocortex. Data were normalized to number of reads in each sample and cluster normalized. Benjamini-Hochberg correction 0.05 cutoff. n = 6 controls and six mutants. (B) Volcano plot of the data, permutation-based FDR 0.05 cutoff. Highlighted in orange are some of the many epilepsy-related proteins significantly changed by loss of Nprl2. (C) Table of significantly affected epilepsy-related proteins p value ≤0.01 cutoff. Orange and bolded indicates q-value ≤ 0.05 cutoff. (D) Up- and downregulated gene ontology cellular component categories. q-values determined by Storey-Tibshirani method.
Figure 5
Figure 5
Loss of Nprl2 leads to altered amino acid abundance including increased glycine (A) Liquid chromatography-massspectrometry (LC-MS/MS) heatmap of metabolites derived from neocortex. n = 5 controls and 6 mutants. SAH- S-Adenosyl homocysteine, dcSAM- S-Adenosyl methioninamine or decarboxylated S-Adenosyl methionine, SRH- S-Ribosyl homocysteine, 2DG-6-P- 2-dexyglucose-6-phosphate, DOPAC- 3,4 Dihydroxyphenylacetic acid. Z score normalized, Student’s t test permutation-based FDR q-value<0.05. (B) Volcano plot of metabolism data, majority of significantly affected metabolites highlighted. Dotted line represents - log(q-value 0.05), Student’s t test permutation-based FDR 0.05, q-value <0.05. (C) Amino acids: Z score normalized. Student’s t test permutation-based FDR q-value. (D) Neurotransmitters: Z score normalized. Student’s t test, permutation-based FDR q-value. Whiskers represent minimum to maximum; box represents 25–75 percentile; line represents median. ∗q < 0.05; ∗∗q < 0.01.
Figure 6
Figure 6
Glycine actions at the NMDA receptor both increases mEPSC frequency and reduces survival in Emx1cre; Nprl2 cKO mice (A) Representative mEPSC traces of mutant cells before (top) and after (bottom) strychnine, a blocker of the canonical glycine receptor. Average mEPSC records are shown on right. (B) mEPSC frequency before and after treatment with strychnine. Cumulative distribution Kruskal-Wallis test, two-way ANOVA with Šidák’s multiple comparisons inset graph, before and after application of strychnine frequency for controls (left) and mutants (right), Wilcoxon matched-pairs signed rank two-tailed test. n = 23 cells/7 controls, 23 cells/6 mutants; 23 control cells and 21 mutant cells in before and after graph. (C) Representative mEPSC traces of mutant cells before (top) and after (bottom) application with 7- Cl-KYNA, a glycineB blocker. Average mEPSC records are shown on right. (D) Frequency of mEPSCs with 7-Cl-KYNA treatment. Cumulative distribution Kruskal-Wallis test, two-way ANOVA with Šidák’s multiple comparisons inset graph, before and after application of strychnine frequency for controls (left) and mutants (right), Wilcoxon matched-pairs signed rank two-tailed test. n = 23 cells/7 controls, 22 cells/7 mutants; 21 control cells and 18 mutant cells in before and after graph. (E) Kaplan-Meier survival curve of mutant mice with vehicle (veh) or probenecid treatment. Log rank Mantel Cox test, p < 0.05. (F) Survival of veh-treated and probenecid-treated mutants. Unpaired two-tailed Student’s t test; p < 0.05, n = 16 veh-treated mutants, 20 probenecid-treated mutants. Asterisks over traces indicate events above threshold. Whiskers represent minimum to maximum; box represents 25–75 percentile; line represents median. ∗p < 0.05; ∗∗p < 0.01; ∗∗∗p < 0.001; ∗∗∗∗p < 0.0001.

Similar articles

Cited by

References

    1. Allen A.S., Berkovic S.F., Cossette P., Delanty N., Dlugos D., Eichler E.E., Epstein M.P., Glauser T., Goldstein D.B., Han Y., et al. De novo mutations in epileptic encephalopathies. Nature. 2013;501:217–221. doi: 10.1038/nature12439. - DOI - PMC - PubMed
    1. Almannai M., El-Hattab A.W. Inborn errors of metabolism with seizures. Pediatr. Clin. North Am. 2018;65:279–299. doi: 10.1016/j.pcl.2017.11.007. - DOI - PubMed
    1. Ambrozkiewicz M.C., Ripamonti S., Borisova E., Schwark M., Schaub T., Altas B., Yilmaz R., Piepkorn L., Horan S., Jahn O., et al. The Kaufman oculocerebrofacial syndrome protein Ube3b regulates synapse number by ubiquitinating Ppp3cc. bioRxiv. 2019 doi: 10.1101/672923. Preprint at. - DOI - PubMed
    1. Baldassari S., Licchetta L., Tinuper P., Bisulli F., Pippucci T. GATOR1 complex: the common genetic actor in focal epilepsies. J. Med. Genet. 2016;53:503–510. doi: 10.1136/jmedgenet-2016-103883. - DOI - PubMed
    1. Baldassari S., Picard F., Verbeek N.E., van Kempen M., Brilstra E.H., Lesca G., Conti V., Guerrini R., Bisulli F., Licchetta L., et al. The landscape of epilepsy-related GATOR1 variants. Genet. Med. 2019;21:398–408. doi: 10.1038/s41436-018-0060-2. - DOI - PMC - PubMed

LinkOut - more resources