. 2022 Apr 28;25(5):104318.
doi: 10.1016/j.isci.2022.104318. eCollection 2022 May 20.

hECA: The cell-centric assembly of a cell atlas

Affiliations

hECA: The cell-centric assembly of a cell atlas

Sijie Chen et al. iScience. .

Abstract

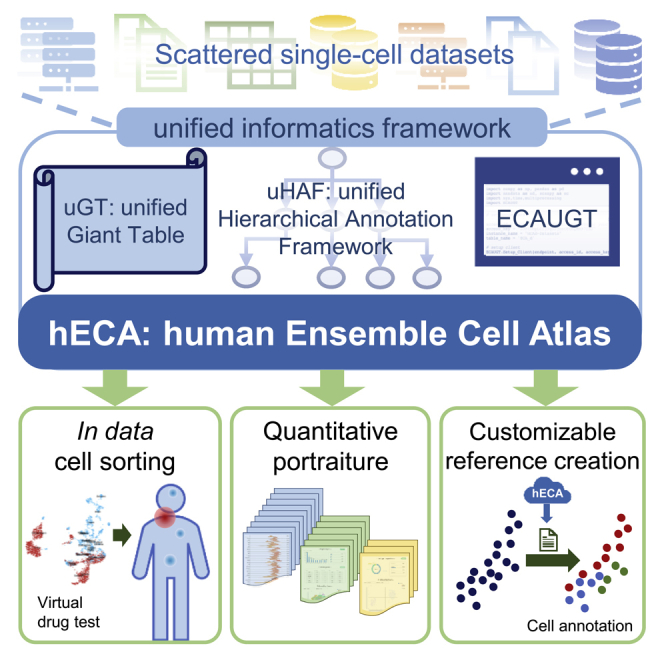
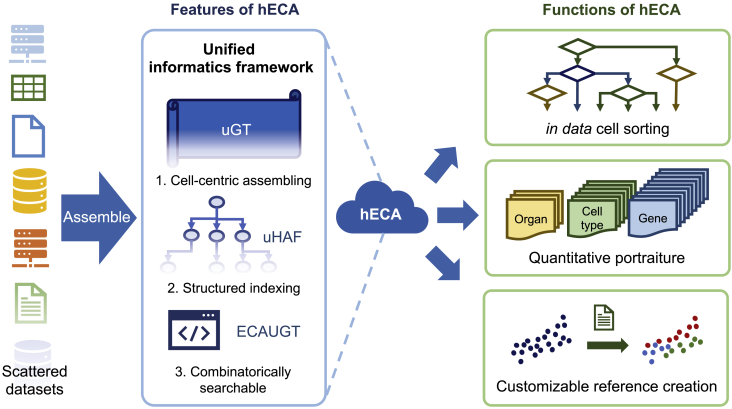
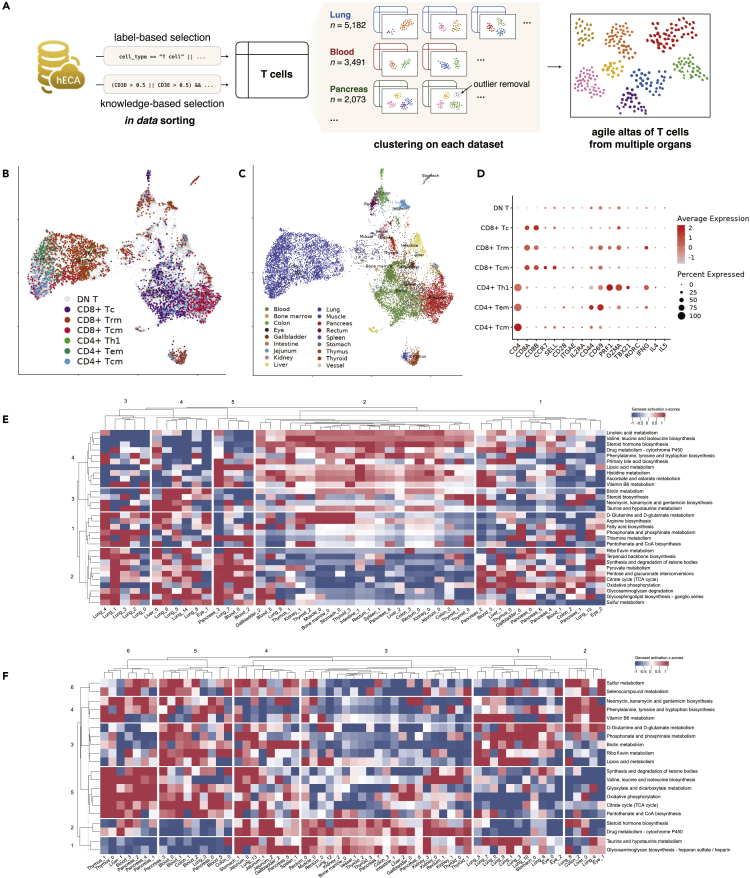
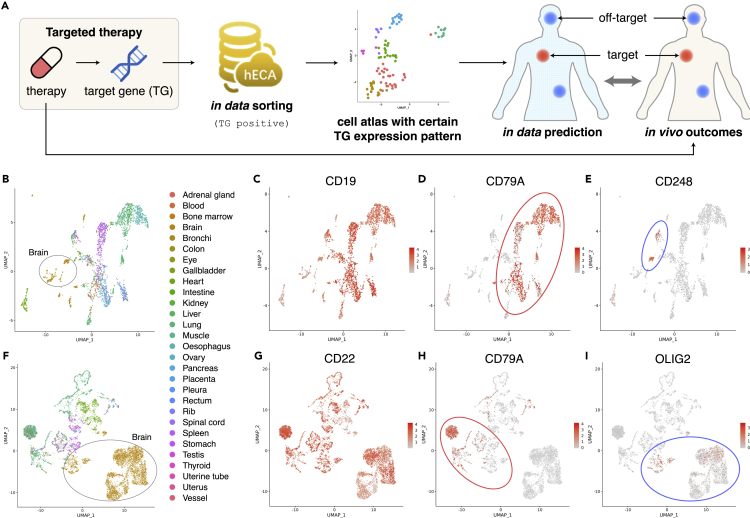
The accumulation of massive single-cell omics data provides growing resources for building biomolecular atlases of all cells of human organs or the whole body. The true assembly of a cell atlas should be cell-centric rather than file-centric. We developed a unified informatics framework for seamless cell-centric data assembly and built the human Ensemble Cell Atlas (hECA) from scattered data. hECA v1.0 assembled 1,093,299 labeled human cells from 116 published datasets, covering 38 organs and 11 systems. We invented three new methods of atlas applications based on the cell-centric assembly: "in data" cell sorting for targeted data retrieval with customizable logic expressions, "quantitative portraiture" for multi-view representations of biological entities, and customizable reference creation for generating references for automatic annotations. Case studies on agile construction of user-defined sub-atlases and "in data" investigation of CAR-T off-targets in multiple organs showed the great potential enabled by the cell-centric ensemble atlas.

Keywords: Bioinformatics; Cell biology; Stem cells research.


Conflict of interest statement

The authors declare no competing interests. The database technology behind the uGT data storage used in hECA is being applied for a patent.

Figures

None
Graphical abstract
Figure 1
Figure 1
Overview of hECA. Scattered data are assembled into the ensemble cell atlas using a unified informatics framework The framework includes three key components uGT, uHAF, and ECAUGT. They made hECA the first cell-centric assembled cell atlases with structured indexing and support for combinatorial searching. Based on these components, three novel functions were built on hECA: “in data” cell sorting, quantitative portraiture, and customizable reference creation. See also Figures S5, S6, and S7.
Figure 2
Figure 2
The agile construction of a draft T-cell metabolic landscape across multiple organs from hECA (A) Workflow of the in data cell sorting from hECA to build the agile T cell atlas. (B) Subtypes of selected T cells are displayed on UMAP. DN T: Double negative T cell, CD8+ Tc: CD8+ Cytotoxic T cell, CD8+ Trm: CD8+ resident memory T cell, CD4+ Th1: CD4+ T helper cell type 1, CD4+ Tem: CD4+ effector memory T cell, CD4+ Tcm: CD4+ central memory T cell. (C) Organ origins of selected T cells organ origin displayed on UMAP. (D) Gene expression signatures of the identified T cell subtypes. The color bar represents average expression level of cell type related markers with colors gray to red indicating expression low to high. The dot size represents percentage of cells expressing the marker within subtypes. (E–F) Heatmaps showing z-scores of activity scores of major metabolic pathways of the T cell subtypes in multiple organs. (E) for CD4+ T cells and (F) for CD8+ T cells. Each row in the heatmap corresponds to one selected term in the KEGG metabolism pathway database, and each column corresponds to one T cell subcluster. See also Figures S1 and S2.
Figure 3
Figure 3
In data experiments with hECA facilitating discoveries of side effects of targeted drugs (A) The diagram of using in data cell sorting to predict targets and off-targets of targeted therapy. Red dots and blue dots in the human body represent the intended target sites and side-effect sites, respectively. The red and blue dots in the UMAP represent the intended treatment cells and side-effect cells, respectively. (B) Visualization of CD19+ cells (expression>0.1) in UMAP, colored by organ origins of cells. CD19 is the target gene of the targeted therapy. (C) Visualization of CD19 expression levels of those CD19+ cells. (D) Visualization of CD79A expression levels of those CD19+ cells. CD79A is a marker for B cells. (E) Visualization of CD248 expression levels of those CD19+ cells. CD248 is a marker for pericytes. (F) Visualization of CD22+ (expression>0.1) cells in UMAP, colored by organ origin of cells. CD22 is the target gene of the targeted therapy. (G) Visualization of CD22 expression levels of those CD19+ cells. (H) Visualization of CD79A expression levels of those CD22+ cells. CD79A is a marker for B cells. (I) Visualization of OLIG2 expression levels of those CD22+ cells. OLIG2 is a marker for oligodendrocytes. The color bars in (C–E) represent expression levels of CD19, CD79A, and CD248, and the color bars in (G–I) represent expression levels of CD22, CD79A, and OLIG2, respectively, with colors gray to red indicating expression low to high. The red and blue ellipses in (D–E) and (H–I) line out the target cells and off-target cells, respectively. See also Figures S3 and S4.

References

    1. Aizarani N., Saviano A., Sagar Mailly L., Durand S., Herman J.S., Pessaux P., Baumert T.F., Grün D. A human liver cell atlas reveals heterogeneity and epithelial progenitors. Nature. 2019;572:199–204. doi: 10.1038/s41586-019-1373-2. - DOI - PMC - PubMed
    1. Aran D., Looney A.P., Liu L., Wu E., Fong V., Hsu A., Chak S., Naikawadi R.P., Wolters P.J., Abate A.R., et al. Reference-based analysis of lung single-cell sequencing reveals a transitional profibrotic macrophage. Nat. Immunol. 2019;20:163–172. doi: 10.1038/s41590-018-0276-y. - DOI - PMC - PubMed
    1. Arazi A., Rao D.A., Berthier C.C., Davidson A., Liu Y., Hoover P.J., Chicoine A., Eisenhaure T.M., Jonsson A.H., Li S., et al. The immune cell landscape in kidneys of patients with lupus nephritis. Nat. Immunol. 2019;20:902–914. doi: 10.1038/s41590-019-0398-x. - DOI - PMC - PubMed
    1. Asp M., Giacomello S., Larsson L., Wu C., Fürth D., Qian X., Wärdell E., Custodio J., Reimegård J., Salmén F., et al. A spatiotemporal organ-wide gene expression and cell atlas of the developing human heart. Cell. 2019;179:1647–1660.e19. doi: 10.1016/j.cell.2019.11.025. - DOI - PubMed
    1. Azizi E., Carr A.J., Plitas G., Cornish A.E., Konopacki C., Prabhakaran S., Nainys J., Wu K., Kiseliovas V., Setty M., et al. Single-cell map of diverse immune phenotypes in the breast tumor microenvironment. Cell. 2018;174:1293–1308.e36. doi: 10.1016/j.cell.2018.05.060. - DOI - PMC - PubMed

LinkOut - more resources