. 2022 May 2;25(5):104345.
doi: 10.1016/j.isci.2022.104345. eCollection 2022 May 20.

NR5A2/LRH-1 regulates the PTGS2-PGE2-PTGER1 pathway contributing to pancreatic islet survival and function

Affiliations

NR5A2/LRH-1 regulates the PTGS2-PGE2-PTGER1 pathway contributing to pancreatic islet survival and function

Eugenia Martin Vázquez et al. iScience. .

Abstract

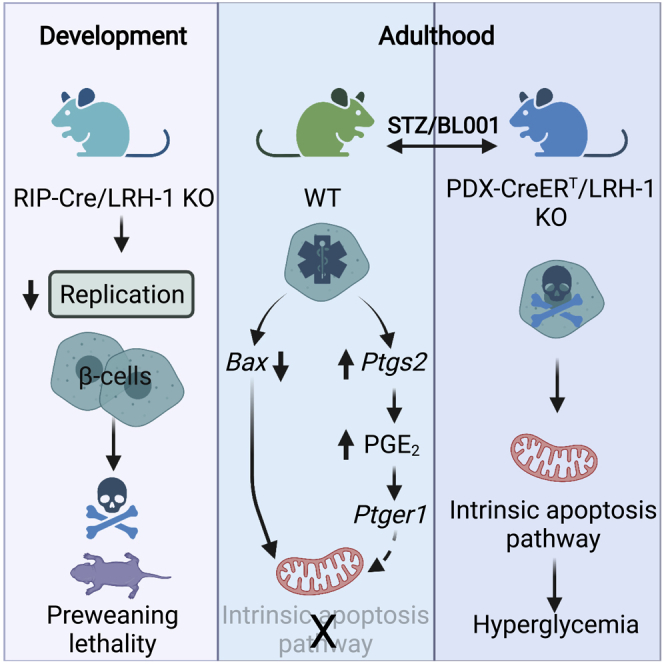
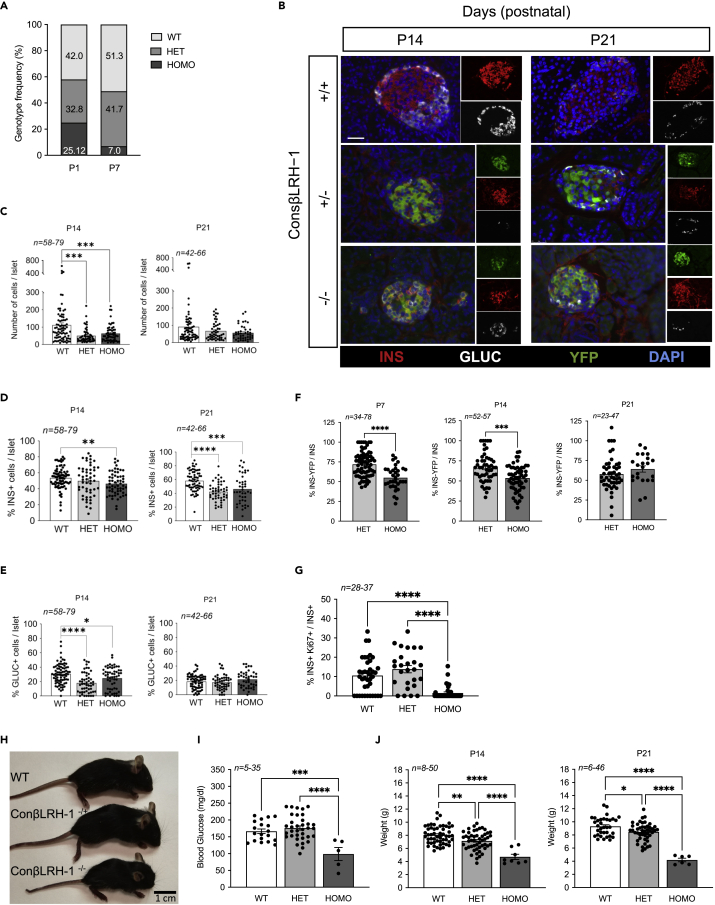
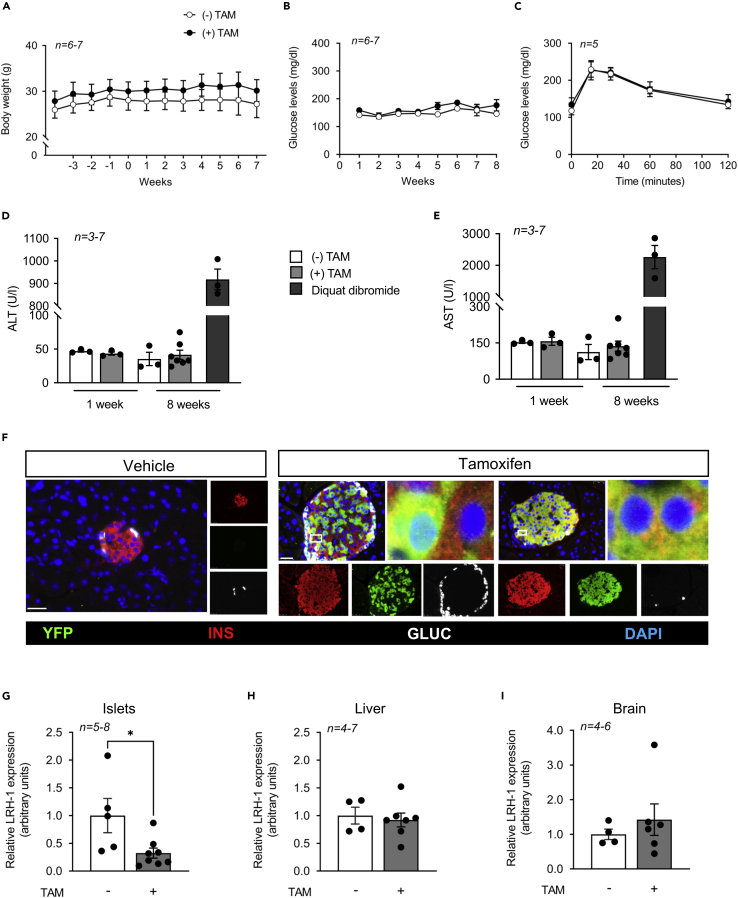
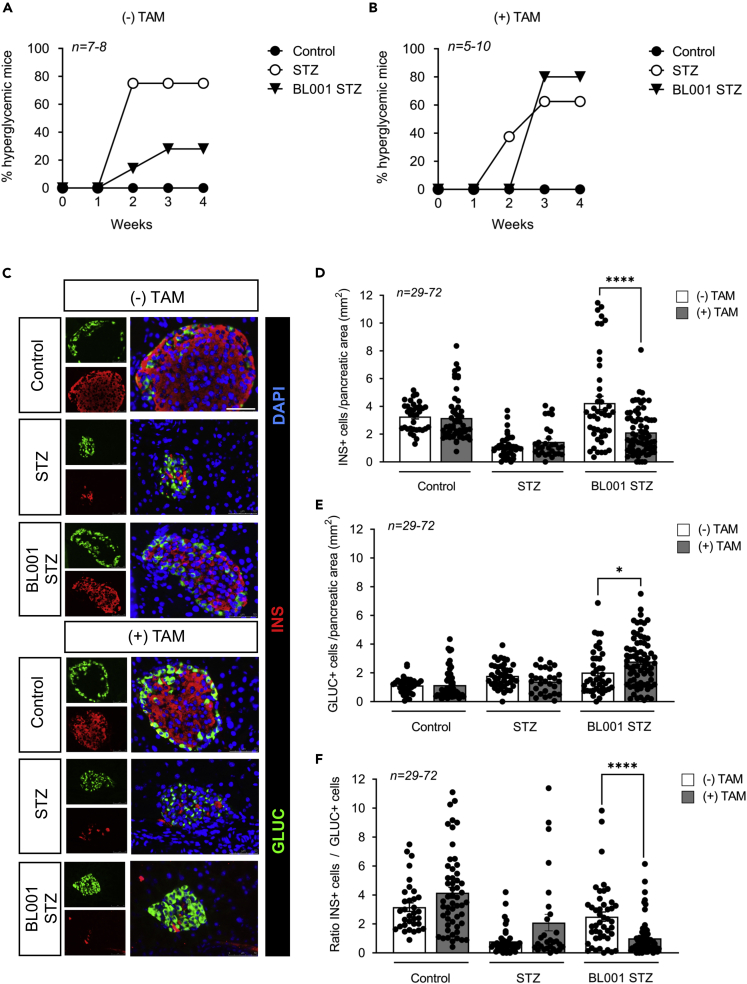
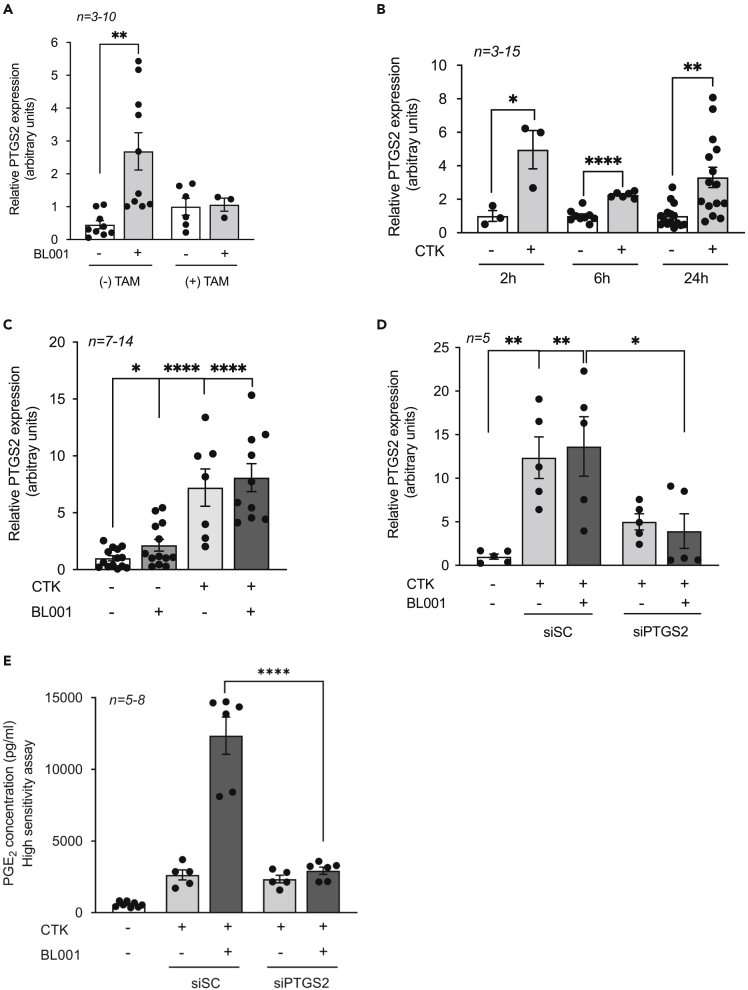
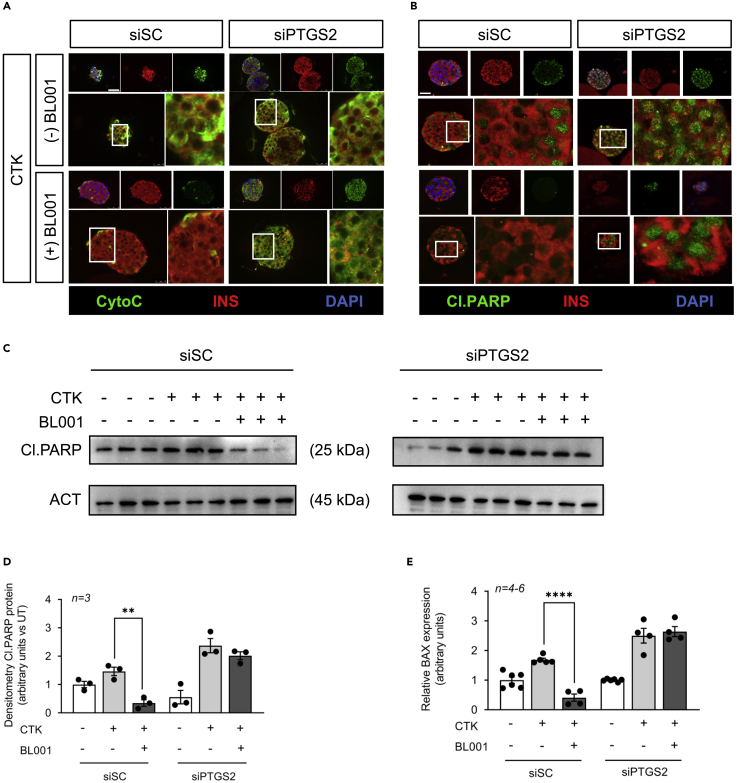
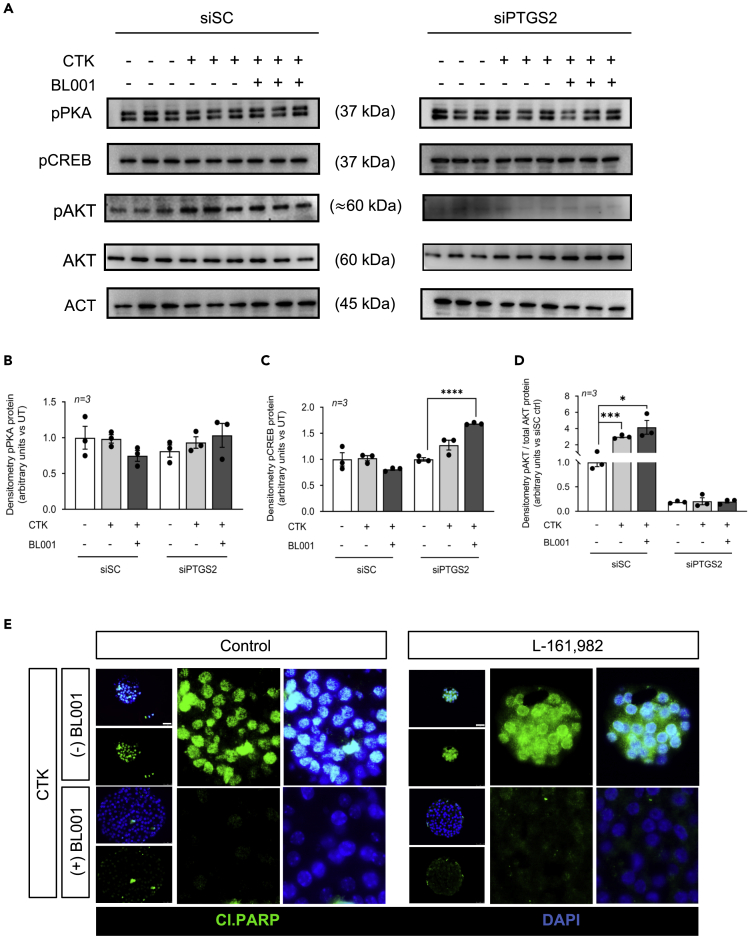
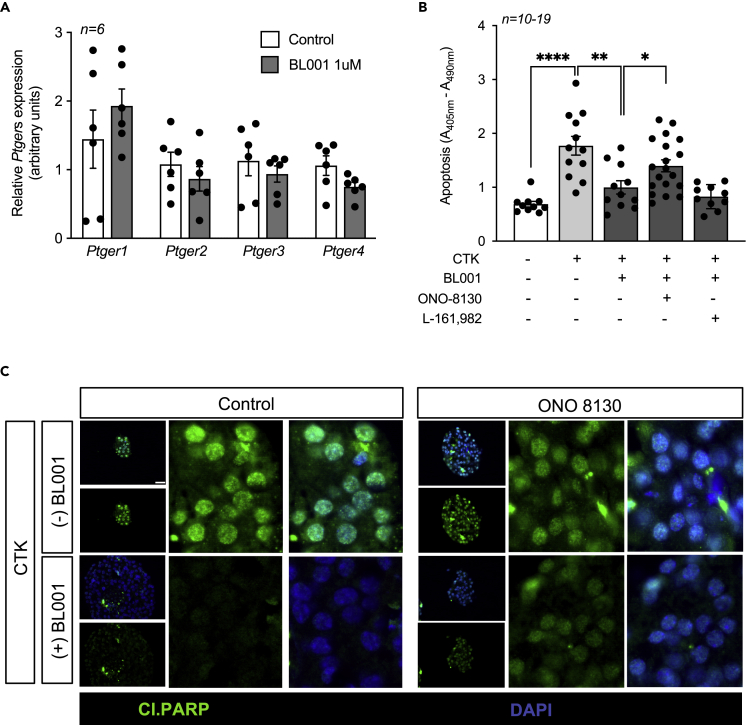
LRH-1/NR5A2 is implicated in islet morphogenesis postnatally, and its activation using the agonist BL001 protects islets against apoptosis, reverting hyperglycemia in mouse models of Type 1 Diabetes Mellitus. Islet transcriptome profiling revealed that the expression of PTGS2/COX2 is increased by BL001. Herein, we sought to define the role of LRH-1 in postnatal islet morphogenesis and chart the BL001 mode of action conferring beta cell protection. LRH-1 ablation within developing beta cells impeded beta cell proliferation, correlating with mouse growth retardation, weight loss, and hypoglycemia leading to lethality. LRH-1 deletion in adult beta cells abolished the BL001 antidiabetic action, correlating with beta cell destruction and blunted Ptgs2 induction. Islet PTGS2 inactivation led to reduced PGE2 levels and loss of BL001 protection against cytokines as evidenced by increased cytochrome c release and cleaved-PARP. The PTGER1 antagonist-ONO-8130-negated BL001-mediated islet survival. Our results define the LRH-1/PTGS2/PGE2/PTGER1 signaling axis as a key pathway mediating BL001 survival properties.

Keywords: Molecular biology; Physiology.


Conflict of interest statement

Two patents (WO, 2011 144725 A2 and WO, 2016 156531 A1) related to BL001 have been published of which B.R.G. and N.C.V. are inventors. These patents have been licensed to ARIDDAD Therapeutics, a Biotech spinoff cofounded by B.R.G. and N.C.V. along with European business partners. The other authors declare no competing interests.

Figures

None
Graphical abstract
Figure 1
Figure 1
LRH-1 contributes to islet formation (A) Representation of the genotypes frequency distribution: WT, LRH1w/w; HET, LRH1wt/ko; HOMO, and LRH1ko/ko). n = 23 mice for P1 and n = 347 mice for P7. (B) Pancreases were extracted at P14 and P21 and immunostaining for insulin (INS, red), glucagon (GLUC, white) and YFP (green) was performed on fixed sections. Scale bar: 25 μmM. (C-F) Morphometric analysis was performed to assess (C) islet cell composition, (D) b-cell mass, (E) α-cell mass, and (F) percentage of INS+/YFP+ cells. (G) Co-staining of Ki67 and Insulin was performed on P7 pancreas and percentage of double-positives was assessed over total insulin positive cells. (H) Representative images of wild type mice (WT) and ConbLRH-1 transgenic pups with either 1 (−/+) or 2 (−/−) Nr5a2 allele disruption 21 days postnatal (P21). (I) Blood glucose levels (P21). (J) weight of P14 and P21 WT, heterozygous and homozygous pups. Statistics: Data are represented as the mean ± SEM ∗p < 0.05, ∗∗p < 0.01, ∗∗∗p < 0.001 ∗∗∗∗p < 0.0001, one-way ANOVA, Tukey multiple comparisons test (C,D,E, H, and I) and unpaired Student’s t test, HET versus HOMO (F). See also Figure S1.
Figure 2
Figure 2
TAM treatment does not compromise the metabolic health status of 8 weeks old IndβLRH-1 mice (A) The body weight of IndβLRH-1 treated or not with TAM was monitored for several weeks before (negative weeks) and after (positive weeks) treatment. TAM started at week 0 for five consecutive days. (B) Blood glucose levels were also monitored starting at week one post TAM treatment. (C) An OGTT was conducted 4 weeks post TAM treatment. (D and E) Circulating levels of (D) ALT and (E) AST were assessed 1 week and 8 weeks post TAM treatment. As positive control, liver damage was induced using diquat dibromide (125 mg/kg body weight). Results are expressed as means ± SEM (F) Representative images of pancreas sections from IndβLRH-1 treated or not with TAM co-stained for YFP (green), insulin (INS, red), and glucagon (GLUC, white). Nuclei were stained with DAPI. Scale bar: 25 μM. (G-I) LRH-1 transcript levels were assessed in (G) islets, (H) liver, and (I whole brain extracted from IndβLRH-1 mice treated or not with TAM. Expression levels were normalized to the housekeeping gene Cyclophilin (CYCLO) or β-Actin. Statistics: Results are expressed as means ± SEM ∗p < 0.05, unpaired Student’s t test, vehicle versus TAM.
Figure 3
Figure 3
β-cell-specific LRH-1 ablation in adult mice negates the antidiabetic properties of BL001 (A and B) Diabetes incidence of IndβLRH-1 mice either (A) not treated or (B) treated with TAM and then subjected to an STZ and/or BL001 regimen for 5 weeks. BL001 (10 mg/kg body weight) treatment started 4 weeks after finishing TAM treatment. Diabetes was induced at week one post-BL001 treatment with a single high dose of STZ (175 mg/kg body weight). (C) Representative immunofluorescence images of pancreas sections from the various experimental groups co-stained for insulin (INS, red) and glucagon (GLUC, green). Nuclei were stained with DAPI (blue). Scale bar: 50 μM. (D–F) Quantification of (D) β-cells, (E) α-cells and (F) ratio thereof in the different groups. n = individual islets counted from three to six independent mice. Statistics: Data are represented as the mean ± SEM ∗p < 0.05 and ∗∗∗∗p < 0.0001, unpaired Student’s t test between (−) and (+) TAM provided in the various treatments. See also Figure S2.
Figure 4
Figure 4
PTGS2 is a downstream target of the BL001/LRH1 signaling pathway (A–C) Ptgs2 expression levels were assessed in (A) islets isolated from IndbLRH-1 mice treated or not with TAM, (B) mouse islets treated with a cytokine cocktail (CTK) for 2, 6, and 24 h, and (C) islets treated with or without cytokines and BL001 for 24 h. (D) siSC or siPTGS2 transfected mouse islets treated or not with cytokines and BL001. Ptgs2 expression levels were normalized to either the housekeeping gene Gapdh or Cyclophilin. (E) Secreted PGE2 levels were assessed by ELISA in the culture media of siSC and siPTGS2 transfected islets treated or not with cytokines and BL001. n = number of mouse islet preparation. Statistics: Results are expressed as means ± SEM ∗p < 0.05, ∗∗p < 0.01, and ∗∗∗∗p < 0.0001 Student’s t test. See also Figure S3.
Figure 5
Figure 5
PTGS2 silenced islets are refractory to the protective effect of BL001 under cytokine attack (A and B) Representative immunofluorescence images of embedded islets transfected with either a control siRNA (siSC) or siPTGS2 and treated or not with cytokines (CTK) or/and with BL001. Islet slices were stained for either (A) Cytochrome c (CytoC, green) or (B) cleaved PARP (Cl.PARP, green) along with insulin (INS, red). Nuclei were stained with DAPI (blue). Scale bar: 25 μM. (C and D) Protein levels of cleaved PARP (Cl.PARP) (C) and (D) quantification thereof were assessed in whole islet cell extracts that were transfected with either a control siRNA (siSC) or siPTGS2 and treated or not with CTK or/and with BL001. Relative protein levels were normalized to ACT. Each line represents an independent experiment. Results are expressed as means ± SEM ∗∗p < 0.01 unpaired two-tailed t-test siSC/CTK versus siSC/CTK/BL001. (E) Transcript levels of Bax were also determined in the same experimental groups. Expression levels were normalized to the housekeeping gene Cyclophilin. Results are expressed as means ± SEM ∗∗∗∗p < 0.0001, unpaired two-tailed t-test siCT/CTK versus siSC/CTK/BL001.
Figure 6
Figure 6
The BL001/LRH-1/NR5A2/PTGS2 anti-apoptotic benefits are not conveyed via PTGER4 signaling (A–D) Phosphorylated protein levels of PKA (pPKA), CREB (pCREB), and AKT (pAKT) as well as total AKT and quantification thereof (B) pPKA, (C) pCREB, and (D) pAKT/AKT were assessed in whole islet cell extracts that were transfected with either a control siRNA (siSC) or siPTGS2 and treated or not with CTK or/and with BL001. Relative protein levels were normalized to ACTIN (ACT) for both siCT and siPTGS2. Only one representative ACT blot is shown, whereas quantification was performed with matched ACT for each blot. Each lane represents an independent sample. Results are expressed as means ± SEM ∗p < 0.05, ∗∗∗p < 0.001, ∗∗∗∗p < 0.0001 unpaired two-tailed t-test siPTGS2 versus siPTGS2/CTK/BL001. (E) Representative immunofluorescence images of embedded islets treated or not with a cytokine cocktail (CTK), BL001 and/or the PTGER4 antagonist L-161,982. Islet slices were stained for cleaved PARP (Cl.PARP, green) along with DAPI (blue) for nuclei staining. Scale bar: 25 μM.
Figure 7
Figure 7
The PGE2/PTGER1 signaling pathway mediates the cell protective effect of BL001 (A) Expression levels of PTGERs were assessed in islets treated or not with 1uM BL001. Expression levels were normalized to the housekeeping gene Gapdh. Results are expressed as means ± SEM. (B) Isolated mouse islets were treated or not with a cocktail of cytokines (CTK), BL001 and antagonists for either PTGER1 (ONO-8130) or PTGER4 (L-161,982). Cell death was assessed by ELISA quantification of mono-nucleosomes and oligo-nucleosomes released by apoptotic cells. Results are expressed as means ± SEM ∗∗p < 0.01, unpaired two-tailed t-test CTK versus BL001 and L-161,982 groups. (C) Representative immunofluorescence images of embedded islets treated or not with a cytokine cocktail, BL001 and/or the PTGER1 antagonist ONO-8130. Islet slices were stained for cleaved PARP (Cl.PARP, green) along with DAPI (blue) for nuclei staining. Scale bar: 25 μM. See also Figure S4.

References

    1. Alexanian A., Miller B., Chesnik M., Mirza S., Sorokin A. Post-translational regulation of COX2 activity by FYN in prostate cancer cells. Oncotarget. 2014;5:4232–4243. doi: 10.18632/oncotarget.1983. - DOI - PMC - PubMed
    1. Baquie M., St-Onge L., Kerr-Conte J., Cobo-Vuilleumier N., Lorenzo P.I., Jimenez Moreno C.M., Cederroth C.R., Nef S., Borot S., Bosco D., et al. The liver receptor homolog-1 (LRH-1) is expressed in human islets and protects β-cells against stress-induced apoptosis. Hum. Mol. Genet. 2011;20:2823–2833. doi: 10.1093/hmg/ddr193. ddr193 [pii]10.1093/hmg/ddr193. - DOI - PubMed
    1. Blondeau B., Sahly I., Massourides E., Singh-Estivalet A., Valtat B., Dorchene D., Jaisser F., Breant B., Tronche F. Novel transgenic mice for inducible gene overexpression in pancreatic cells define glucocorticoid receptor-mediated regulations of beta cells. PLoS One. 2012;7:e30210. doi: 10.1371/journal.pone.0030210. - DOI - PMC - PubMed
    1. Bosma K.J., Andrei S.R., Katz L.S., Smith A.A., Dunn J.C., Ricciardi V.F., Ramirez M.A., Baumel-Alterzon S., Pace W.A., Carroll D.T., Overway E.M., Wolf E.M., Kimple M.E., Sheng Q., Scott D.K., Breyer R.M., Gannon M. Pharmacological blockade of the EP3 prostaglandin E2 receptor in the setting of Type 2 diabetes enhances beta-cell proliferation and identity, and relieves oxidative damage. Mol. Metab. 2021;54:101347. doi: 10.1016/j.molmet.2021.101347. - DOI - PMC - PubMed
    1. Botrugno O.A., Fayard E., Annicotte J.S., Haby C., Brennan T., Wendling O., Tanaka T., Kodama T., Thomas W., Auwerx J., Schoonjans K. Synergy between LRH-1 and beta-catenin induces G1 cyclin-mediated cell proliferation. Mol. Cell. 2004;15:499–509. doi: 10.1016/j.molcel.2004.07.009. [pii] - DOI - PubMed