. 2022 Apr 27;25(5):104316.
doi: 10.1016/j.isci.2022.104316. eCollection 2022 May 20.

JAM-A signals through the Hippo pathway to regulate intestinal epithelial proliferation

Affiliations

JAM-A signals through the Hippo pathway to regulate intestinal epithelial proliferation

Shuling Fan et al. iScience. .

Abstract

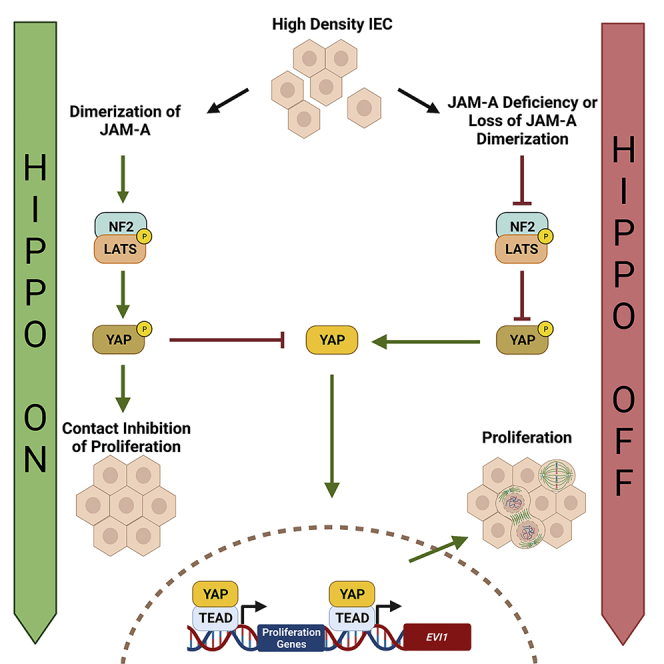
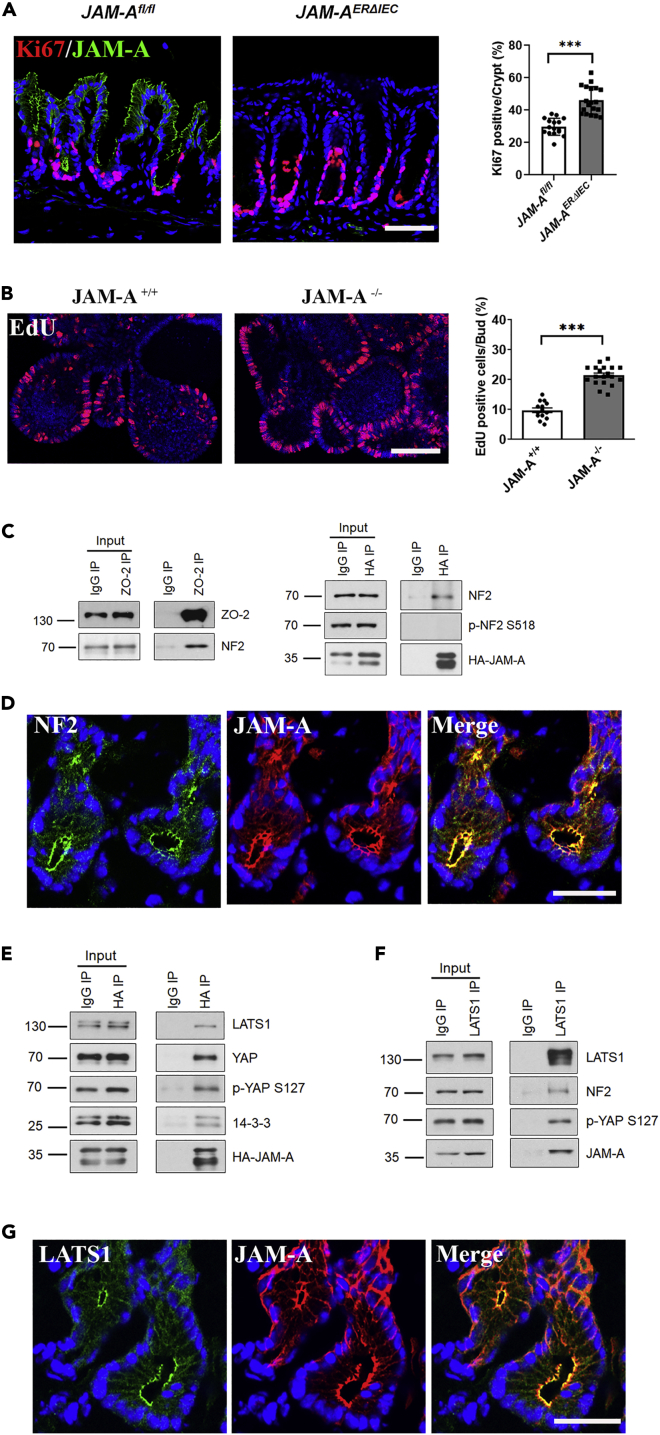
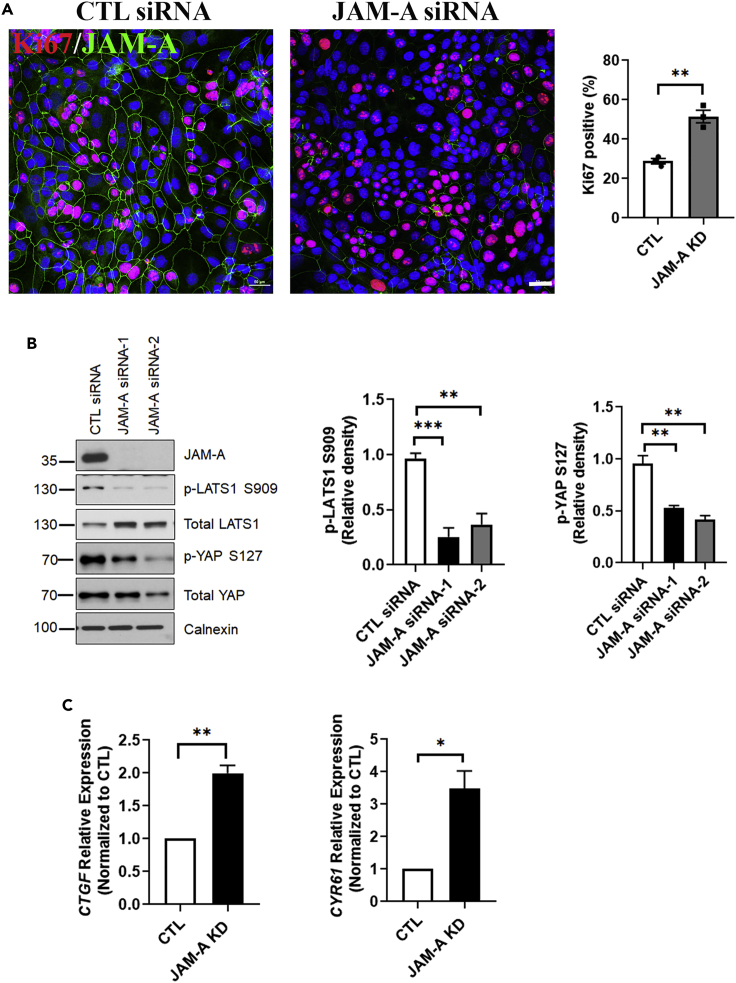
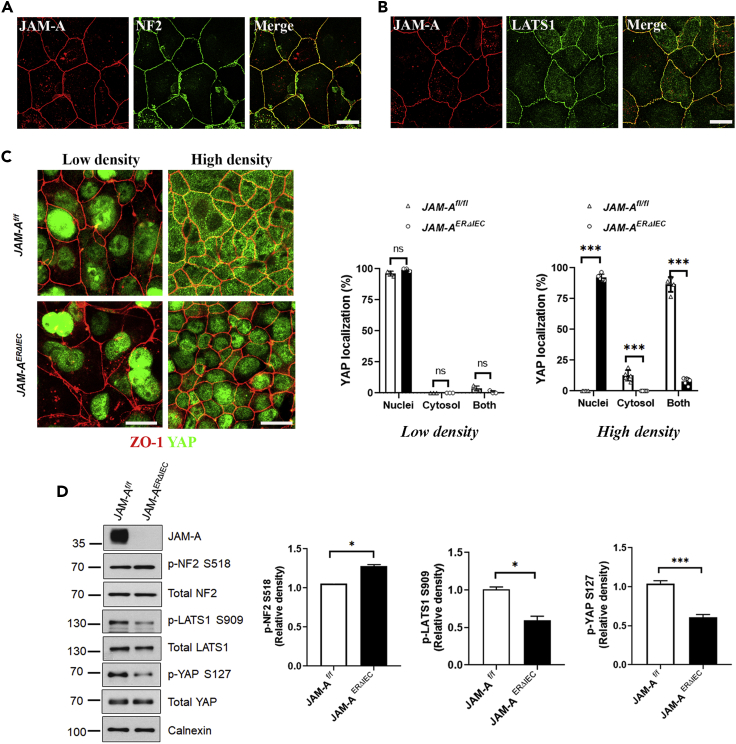
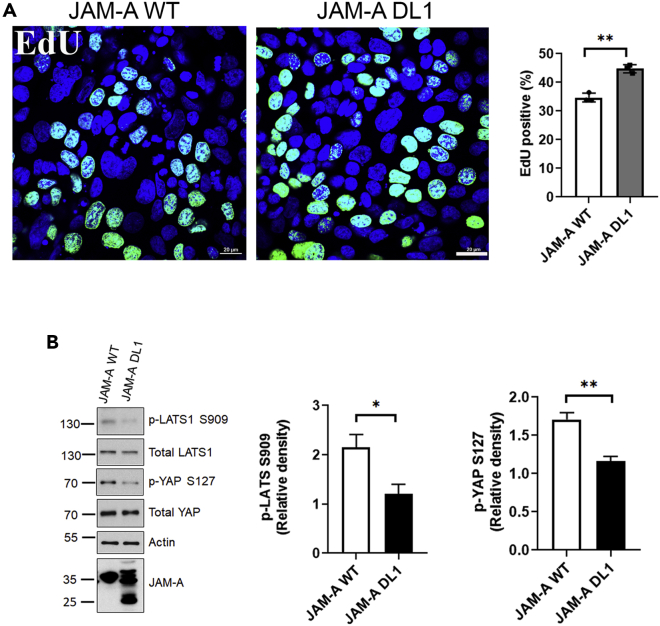
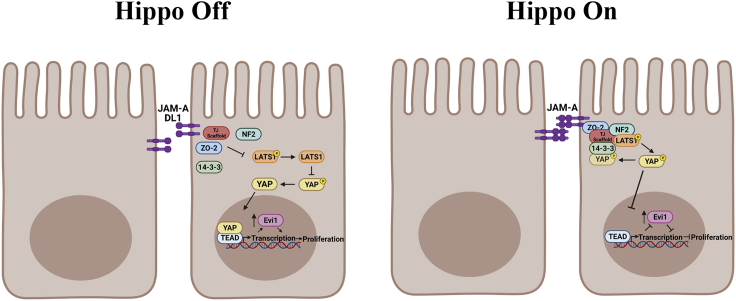
JAM-A is a tight-junction-associated protein that contributes to regulation of intestinal homeostasis. We report that JAM-A interacts with NF2 and LATS1, functioning as an initiator of the Hippo signaling pathway, well-known for regulation of proliferation. Consistent with these findings, we observed increased YAP activity in JAM-A-deficient intestinal epithelial cells (IEC). Furthermore, overexpression of a dimerization-deficient mutant, JAM-A-DL1, failed to initiate Hippo signaling, phenocopying JAM-A-deficient IEC, whereas overexpression of JAM-A-WT activated Hippo signaling and suppressed proliferation. Lastly, we identify EVI1, a transcription factor reported to promote cellular proliferation, as a contributor to the pro-proliferative phenotype in JAM-A-DL1 overexpressing IEC downstream of YAP. Collectively, our findings establish a new role for JAM-A as a cell-cell contact sensor, raising implications for understanding the contribution(s) of JAM-A to IEC proliferation in the mammalian epithelium.

Keywords: Biochemistry; Biological sciences; Cell biology.


Conflict of interest statement

The authors declare no competing interests.

Figures

None
Graphical abstract
Figure 1
Figure 1
JAM-A regulates proliferation and associates with Hippo regulatory molecules LATS1 and NF2 (A) JAM-A-deficient mice exhibit increased colonic IEC proliferation. Representative confocal images of colon tissue from JAM-AERΔIEC and control (JAM-Afl/fl) mice stained for JAM-A (green), Ki67 (red), and DAPI/nuclei (blue). Increased levels of proliferating cells in the JAM-AERΔIEC mice compared with controls is shown in the graph plotting percentage of Ki67 positive cells/crypt with dots denoting individual crypts. Data are means ± SEM of crypts from JAM-Afl/fl and JAM-AERΔIEC mice, respectively. ∗∗∗p ≤ 0.001; two-tailed Student’s t test. Scale bar, 50 μm. (B) EdU incorporation in 3D enteroids derived from JAM-A−/− and WT (JAM-A+/+) mice indicate that loss of JAM-A results in increased proliferation. Data are means ± SEM where buds counted from WT and JAM-A−/− enteroids and are denoted as dots on the graph. ∗p ≤ 0.05, ∗∗p ≤ 0.01, ∗∗∗p ≤ 0.001: two-tailed Student’s t test. Scale bar, 50 μm. (C) Co-immunoprecipitation of ZO-2 and JAM-A with NF2. Whole-cell lysate of SKCO-15 IEC stably expressing a full-length HA-tagged JAM-A (HA-JAM-A) was immunoprecipitated with a ZO-2 (ZO-2 IP) or HA (HA IP) antibody followed by immunoblotting for NF2, ZO-2 and NF2, p-NF2 S518, and HA-JAM-A. p-NF2 S518 did not co-immunoprecipitate with HA-JAM-A. (D) Representative immunostaining of NF2 (green) and JAM-A (red) detected by confocal microscopy in WT murine colon tissue demonstrate co-localization at the TJ. Scale bar, 50 μm. (E) JAM-A co-immunoprecipitates with multiple Hippo pathway molecules. Immunoprecipitation of HA-tagged JAM-A from IEC lysates with an HA-specific antibody (HA IP) followed by western blot LATS1, YAP, p-YAP S127, 14-3-3, and JAM-A. Co-immunoprecipitation of these molecules with JAM-A is demonstrated. (F) Endogenous JAM-A co-immunoprecipitation with LATS1, NF2, and YAP. Immunoprecipitation of LATS1 with LATS1 antibody (LATS1 IP) from IEC cell lysates followed by western blot for NF2, YAP, JAM-A, and LATS1. Co-immunoprecipitation is observed between these molecules. (G) Representative immunofluorescence confocal images of LATS1 (green), JAM-A (red), and DAPI/nuclei (blue) in WT murine colon tissue. Scale bar, 50 μm. Lysate blots serve as input loading controls in (C), (E), and (F). Immunoprecipitation with a nonspecific IgG antibody served as a negative control (IgG IP) for (C), (E), and (F). All data are representative of three independent experiments. See also Figure S1.
Figure 2
Figure 2
Increased proliferation after loss of JAM-A is associated with suppressed Hippo pathway signaling (A) Human JAM-A-deficient IEC exhibit a pro-proliferative phenotype. Ki67 staining was conducted in JAM-A knockdown (KD) human SKCO-15 IEC transfected with two siRNA targets (JAM-A siRNA-1, JAM-A siRNA-2). An average percentage of Ki67 positive cells from five fields of view were generated for three independent experiments (denoted by dots on the graph). JAM-A KD IEC also display enhanced proliferation like JAM-A−/− and JAM-AERΔIEC IEC. (B) JAM-A KD IEC exhibited decreased Hippo pathway activity. Representative western blots for p-LATS S909, LATS1, p-YAP S127, YAP, and JAM-A in JAM-A KD IEC transfected with two JAM-A siRNA targets and one control (CTL siRNA). Calnexin served as a loading control. Graphs represent digital densitometry for p-LATS S909 and p-YAP S127. Activity of LATS1 is decreased, resulting in increased YAP activity JAM-A KD IEC. (C) JAM-A loss results in increased YAP target gene transcription. qPCR was conducted on SKCO-15 JAM-A KD and CTL IEC to assess transcript expression of known YAP gene targets, CTGF and CYR61. Data represent gene transcript levels expressed as relative expression normalized to the control cells. β-actin served as the reference gene. Data represent means ± SEM of three independent experiments ∗p ≤ 0.05, ∗∗p ≤ 0.01, ∗∗∗p ≤ 0.001: two-tailed Student’s t test.
Figure 3
Figure 3
JAM-A is a regulator of Hippo signaling in primary cultured IEC (A) Representative confocal immunostaining of NF2 (green) and JAM-A (red) in WT murine 2D colonoids shows co-localization at the TJ. Scale bar, 20 μm. (B) Representative confocal immunostaining of LATS1 (green) and JAM-A (red) associating at the TJ in WT 2D murine colonoids. Scale bar, 20 μm. (C) JAM-AERΔIEC primary IEC exhibit prolonged nuclear YAP localization. Representative immunofluorescent images of YAP (green) and ZO-1 (red) in 2D colonoids cultured at low and high cell confluency derived from and JAM-AERΔIEC and JAM-Afl/fl mice. At low cell confluency YAP staining is visible in the nuclei of JAM-AERΔIEC and JAM-Afl/fl IEC. At high cell confluency, YAP localizes to the cytoplasm in control IEC but remains in the nuclei of JAM-AERΔIEC IEC, revealing a failure of Hippo signaling initiation. Graph depicts scoring of YAP localization (nuclear, cytoplasm, and nuclear + cytoplasm). Five fields of view for each condition were scored to generate an average percentage, and three independent experiments were performed (denoted by the dots). Scale bar, 20 μm. (D) JAM-A-deficient primary IEC exhibit decreased Hippo signaling activity. Representative western blots for p-LATS1 S909, LATS1, p-NF2 S518, NF2, p-YAP S127, YAP, and JAM-A in subconfluent 2D colonoids derived from JAM-AERΔIEC and JAM-Afl/fl mice. Graphs represent digital densitometry for relative density of p-NF2 S518, p-LATS1 S909, and p-YAP S127. JAM-AERΔIEC colonoids exhibit decreased NF2 and LATS1 activity, resulting in increased YAP activity relative to JAM-Afl/fl controls. Calnexin serves as a loading control. Data are means ± SEM of three independent experiments. ∗p ≤ 0.05, ∗∗p ≤ 0.01, ∗∗∗p ≤ 0.001: two-tailed Student’s t test.
Figure 4
Figure 4
JAM-A dimerization serves as a cell-cell contact sensing mechanism to initiate Hippo signaling (A) Overexpression of a dimerization-deficient JAM-A mutant (JAM-A-DL1) results in enhanced proliferation. Representative immunofluorescent images of EdU incorporation (green) and nuclei (blue) in SW480 IEC overexpressing JAM-A full-length (JAM-A- WT) or JAM-A-DL1. Graph represents average percentage of EdU positive cells from 10 fields of view for each experiment (JAM-A-WT or JAM-A-DL1) and three independent experiments performed, which are denoted by dots on the graph. Overexpression of JAM-A-WT resulted in a significant decrease in proliferating cells, whereas the JAM-A-DL1 mutant was unable to suppress proliferation. Scale bar, 20 μm. (B) Evaluation of Hippo signaling activity in JAM-A-DL1 overexpressing IEC. Representative western blots of p-LATS1 S909, LATS1, p-YAP S127, YAP, and JAM-A on cell lysate from SW480 IEC overexpressing JAM-A-WT and JAM-A-DL-1. Beta-actin serves as a loading control. Graph represents digital densitometry of p-LATS1 S909 and p-YAP S127. JAM-A-WT overexpressing IEC exhibit increased LATS1 activity and decreased YAP activity characteristic of Hippo pathway activation. Relative to the JAM-A-WT overexpressing cells, JAM-A-DL1 cells exhibit decreased activation of Hippo signaling. All data are means ± SEM of three independent experiments. ∗p ≤ 0.05, ∗∗p ≤ 0.01, ∗∗∗p ≤ 0.001: two-tailed Student’s t test. See also Figure S2.
Figure 5
Figure 5
JAM-A regulates EVI1 through Hippo pathway molecules (A) EVI1 transcript levels in IEC isolated from the ileum of JAM-A−/− and WT mice were measured by qPCR. Evi1 transcript is upregulated in JAM-A−/− relative to WT mice. Relative expression of Evi1 is normalized to Tbp. Dots denote individual animals with data pooled from three independent experiments. (B) Evi1 transcript levels in IEC isolated from the ileum of JAM-AERΔIEC and JAM-Afl/fl mice were measured as in (A). Evi1 transcript is significantly upregulated in JAM-AERΔIEC mice relative to controls. (C) EVI1 is a downstream effector that significantly contributes to the JAM-A dimerization-deficient pro-proliferative IEC phenotype. The cellular proliferation of HEK293T cells overexpressing JAM-A-DL1 and JAM-A-WT was assessed by MTT assay. JAM-A-DL1 cells exhibit increased proliferation relative to the JAM-A-WT cells. EVI1 knockdown (EVI1 siRNA) in JAM-A-DL1 overexpressing cells restored the proliferation to levels comparable to the JAM-A-WT cells. This result indicates that the increased proliferation observed in JAM-A-DL1 mutants is dependent on EVI1 activity. (D) EVI1 knockdown (EVI1 siRNA) SKCO-15 IEC were subjected to an EdU incorporation assay to assess cell proliferation. Graph represents average percentage of EdU positive cells from 10 fields of view each for experiment. Three individual experiments were conducted, denoted by dots on the graph, which shows that EVI1 KD IEC exhibit decreased proliferation relative to control cells. Thus, EVI1 promotes proliferation in IEC. Representative western blot of SKCO-15 IEC transfected with EVI1 (EVI1) (2 targets: EVI1 siRNA-1, EVI1 siRNA-2) or non-targeting control (CTL) siRNA. EVI1 is appreciably depleted in the EVI1 silenced cells. Calnexin serves as a loading control. (E) Evaluation of whether EVI1 is regulated by Hippo signaling. Representative western blots for EVI1 and NF2 in NF2 knockdown SKCO-15 cells (NF2 siRNA-1 and NF2 siRNA-2). Digital densitometry shows relative levels of EVI1 are increased by knockdown of NF2 relative to control IEC, confirming that the Hippo pathway suppresses EVI1. Actin served as a loading control. (F) Assessment of EVI1 protein levels in response to YAP inhibition. Representative EVI1 and JAM-A western blots from SKCO-15 cells treated with 10 μM of the YAP inhibitor verteporfin. Graph represents digital densitometry for EVI1 relative levels. Treatment with verteporfin resulted in significant reduction in EVI1 protein, suggesting that EVI1 is a YAP gene target. Actin served as a loading control. (G) Representative western blot for EVI1 in JAM-A KD and control SKCO-15 IEC treated with and without 10 μM of verteporfin. Graphs represent digital densitometry for EVI1. The upregulation of EVI1 under JAM-A silencing was ablated in response to YAP inhibition revealing that regulation of EVI1 is modulated by YAP activity. Actin served as a loading control. (H) YAP pairs with TEAD transcription factors to target Evi1 transcription. Representative western blots for EVI1 and TEAD in TEAD1-4 KD (all four TEADs expressed in IEC were knocked down, two targets for each factor used: TEAD Target 1 and TEAD Target 2) SKCO-15 IEC. Actin serves as a loading control for western blot. Graph represents digital densitometry for EVI1, which is decreased by knockdown of TEAD transcription factors. Data for all experiments represent means ± SEM of three independent experiments. ∗p ≤ 0.05 ∗∗p ≤ 0.01 ∗∗∗p ≤ 0.001: two-tailed Student’s t test and two-way ANOVA. See also Figure S3.
Figure 6
Figure 6
Model of JAM-A regulation of Hippo pathway signaling through extracellular adhesive interactions JAM-A senses cell-cell contacts through dimerization at the TJ, resulting in outside-in signaling that triggers changes in the intracellular JAM-A scaffold complex. These changes likely affect JAM-A cytoplasmic contacts mediated through its PDZ-binding motif with ZO-2. This interaction recruits TJ scaffold proteins that can facilitate interaction between NF2 and LATS1. The formation of this complex will activate Hippo core kinases, including LATS1, to mediate downstream Hippo signaling in which YAP is phosphorylated and subsequently sequestered by 14-3-3 in the cytoplasm. This results in decreased YAP target gene transcription and suppression of proliferation (Left panel). When JAM-A is unable to dimerize, as in the case of the JAM-A-DL1 mutant, this signaling is lost. Subsequently, NF2 and LATS1 fail to be recruited to the TJ to activate Hippo signaling. Thus, YAP remains active, translocating to the nucleus, and interacts with TEAD to promote transcription of its pro-proliferative target genes, including EVI1 (Right panel).

Similar articles

Cited by

References

    1. Barjesteh van Waalwijk van Doorn-Khosrovani S., Erpelinck C Fau - van Putten W.L.J., van Putten Wl Fau - Valk P.J.M., Valk Pj Fau - van der Poel-van de Luytgaarde S., van der Poel- van de Luytgaarde S Fau - Hack R., Hack R Fau - Slater R., Slater R., Fau - Smit E.M.E., Smit Em Fau - Beverloo H.B., Beverloo Hb Fau - Verhoef G., et al. High EVI1 expression predicts poor survival in acute myeloid leukemia: a study of 319 de novo AML patients. Blood. 2003;101:837–845. - PubMed
    1. Bei J.X., Li Y., Jia W.H., Feng B.J., Zhou G., Chen L.Z., Feng Q.S., Low H.Q., Zhang H., He F., et al. A genome-wide association study of nasopharyngeal carcinoma identifies three new susceptibility loci. Nat. Genet. 2010;42:599–603. doi: 10.1038/ng.601. - DOI - PubMed
    1. Brodowska K., Al-Moujahed A., Marmalidou A., Meyer Zu Horste M., Cichy J., Miller J.W., Gragoudas E., Vavvas D.G. The clinically used photosensitizer Verteporfin (VP) inhibits YAP-TEAD and human retinoblastoma cell growth in vitro without light activation. Exp. Eye Res. 2014;124:67–73. doi: 10.1016/j.exer.2014.04.011. - DOI - PMC - PubMed
    1. Cera M.R., Del Prete A., Vecchi A., Corada M., Martin-Padura I., Motoike T., Tonetti P., Bazzoni G., Vermi W., Gentili F., et al. Increased DC trafficking to lymph nodes and contact hypersensitivity in junctional adhesion molecule-A-deficient mice. J. Clin. Invest. 2004;114:729–738. doi: 10.1172/JCI21231. - DOI - PMC - PubMed
    1. Chen C.L., Gajewski K.M., Hamaratoglu F., Bossuyt W., Sansores-Garcia L., Tao C., Halder G. The apical-basal cell polarity determinant Crumbs regulates Hippo signaling in Drosophila. Proc. Natl. Acad. Sci. U S A. 2010;107:15810–15815. doi: 10.1073/pnas.1004060107. - DOI - PMC - PubMed

LinkOut - more resources