. 2022 May 4:13:880668.
doi: 10.3389/fimmu.2022.880668. eCollection 2022.

FOXO Dictates Initiation of B Cell Development and Myeloid Restriction in Common Lymphoid Progenitors

Affiliations

FOXO Dictates Initiation of B Cell Development and Myeloid Restriction in Common Lymphoid Progenitors

Lucía Peña-Pérez et al. Front Immunol. .

Abstract

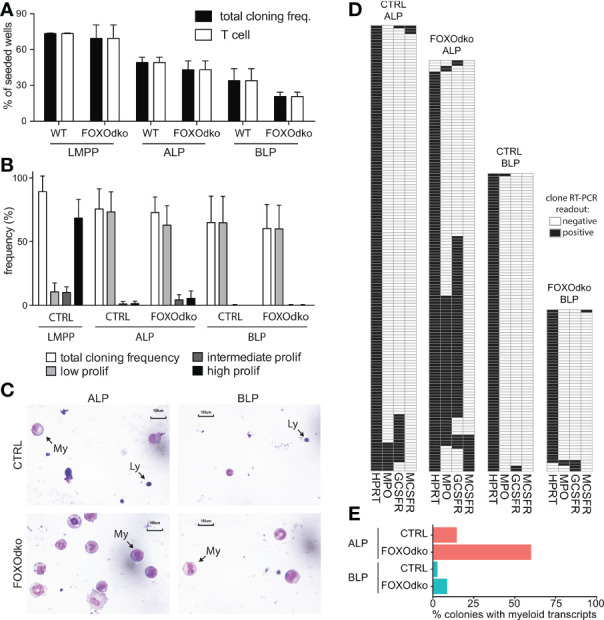
The development of B cells relies on an intricate network of transcription factors critical for developmental progression and lineage commitment. In the B cell developmental trajectory, a temporal switch from predominant Foxo3 to Foxo1 expression occurs at the CLP stage. Utilizing VAV-iCre mediated conditional deletion, we found that the loss of FOXO3 impaired B cell development from LMPP down to B cell precursors, while the loss of FOXO1 impaired B cell commitment and resulted in a complete developmental block at the CD25 negative proB cell stage. Strikingly, the combined loss of FOXO1 and FOXO3 resulted in the failure to restrict the myeloid potential of CLPs and the complete loss of the B cell lineage. This is underpinned by the failure to enforce the early B-lineage gene regulatory circuitry upon a predominantly pre-established open chromatin landscape. Altogether, this demonstrates that FOXO3 and FOXO1 cooperatively govern early lineage restriction and initiation of B-lineage commitment in CLPs.

Keywords: B cell; FOXO (forkhead box protein O); gene regulation; lineage commitment/specification; myeloid restriction.


Conflict of interest statement

The authors declare that the research was conducted in the absence of any commercial or financial relationships that could be construed as a potential conflict of interest.

Figures

Figure 1
Figure 1
Loss of FOXO1 or FOXO3 impairs B cell development. (A) Gene expression (FPKM) of Foxo1, Foxo3, and Foxo4. HSC, hematopoietic stem cell; LMPP, lymphoid primed multipotent progenitor; ALP, LY6D- common lymphoid progenitor; BLP, LY6D+ common lymphoid progenitors; BLP, LY6D+ common lymphoid progenitors; immB, immature B; matB, mature B in BM; trB, transitional B; FoB, follicular B; MZB, marginal zone B. (B) Gating strategy for identification of BM B lineage cells. (C) Total number of B lineage cells in BM. In panels C and E: each dot represents data from an individual mouse; p-values were calculated using the Kruskal Wallis test with Dunn’s test of multiple comparisons; *, ** and *** indicating p-values <0.05, <0.01, and <0.001 respectively. (D) Gating strategy for identification of spleen B lineage cells. (E) Total number of B lineage cells in spleen. (F) Expression of indicated genes. (G) Principal component analysis of RNAseq data.
Figure 2
Figure 2
Development of lymphoid progenitors is perturbed by the loss of FOXO1 and FOXO3. (A, B) Gating strategy for identification of stem and lymphoid progenitor cells. For complete gating see Fig. S3A. (C) Total number of progenitor cells in BM. In panel (C) each dot represents data from an individual mouse; p-values were calculated using the Kruskal Wallis test with Dunn’s test of multiple comparisons; *, ** and *** indicating p-values <0.05, <0.01, and <0.001 respectively.
Figure 3
Figure 3
The B lineage developmental is critically dependent on FOXO1 and FOXO3. (A) Total number of cells and B cells in BM. In panel (A, C): each dot represents data from an individual mouse; p-values were calculated using the Kruskal Wallis test with Dunn’s test of multiple comparisons; *, ** and *** indicating p-values <0.05, <0.01, and <0.001 respectively. (B) Gating strategy for identification of B cells in BM. (C) Total number of cells and B cells in spleen. (D) Gating strategy for identification of B cells in spleen.
Figure 4
Figure 4
FOXOdko CLPs maintain cellular identity but fails to up-regulate B lineage related genes. (A, B) Principal component analysis of RNAseq data. (C) Venn diagram displaying the overlap between genes differentially expressed (Bonferroni corrected p-value <0.05 and 2-fold difference comparing FOXOdko to CTRL and ≥30 reads in at least two samples) in the FOXOdko at the indicated CLP stage or in the ALP to BLP developmental transition. (D) Hierarchical clustering of expression for genes displaying differential expression in FOXOdko CLPs. The stage where a significant change occurs is indicated to the right. (E) Median normalized expression of genes within clusters I and cluster II-IV from panel (D). (F) Expression of indicated genes.
Figure 5
Figure 5
Chromatin accessibility is altered by the lack of FOXO. (A) Principal component analysis of ATACseq data. (B) Venn diagram displaying the overlap between differentially accessible regions (DARs) (adjusted p-value <0.01 and 2-fold change comparing FOXOdko to WT/CTRL and ≥30 reads in at least two samples) in the FOXOdko at the indicated CLP stage. (C) Bar graph illustrating distribution of DARs amongst indicated genomic locations. (D) Hierarchical clustering of ATACseq signal in DARs. The stage where a significant change occurs is indicated to the right. DAR proximal genes are indicated to the left. (E) Median normalized ATACseq signal in DARs with decreased (left) and increased (right). (F, G) De novo motif enrichment in DARs with decreased (F) and increased (G) ATACseq signal in FOXOdko BLP. Percentage of sequences containing the motif, percentage of background sequences containing the motif (in parenthesis) and p-value of the enrichment are displayed to the left of the enriched motifs. (H, I) Transposase integration-based cut-profiles of DARs with: (H) decreased ATACseq signal containing EBF and ETS binding sites; or (I) increased ATACseq signals containing IRF and ETS binding sites.
Figure 6
Figure 6
Loss of FOXO is not associated with a failure to establish open chromatin. (A, B) Tracks showing chromatin accessibility (ATACseq) and H3K27Ac (ChIPseq) for indicated cell- and genotypes at the (A) Ebf1 and (B) Foxo1 loci. (C) Fraction of DARs with reduced accessibility displaying either lost or decreased chromatin accessibility in the FOXOdko CLPs. (D) Venn diagram showing the overlap between FOXO1 and EBF1 binding in RAG1ko proB cells and open chromatin in WT/CTRL BLP. (E, F) Percentage of the open chromatin regions (consensus peaks) found in WT/CTRL BLP that overlap with (E) FOXO1 or (F) EBF1 binding and that constitute open chromatin (consensus peaks) at the indicated stages of development.
Figure 7
Figure 7
Loss of FOXO alleviates myeloid restriction in CLPs. (A) Frequency of single progenitors generating clones and T-cells (CD90.2/Thy1.2+CD25+) on OP9-DL1. (B) Frequency of single CLPs capable of generating colonies of the indicated size under myeloid growth conditions. Data is from seven independent experiments. (C) Morphology of cells derived from CLPs under myeloid conditions. Arrows indicate lymphoid (Ly) and myeloid (My) cells. (D) Heatmaps of gene expression in single-CLP derived colonies detected by multiplex RT-PCR. Data is from two independent experiments. (E) Percentage of colonies in panel D expressing myeloid transcripts (Mpo, Gcsfr and/or Mcsfr).

References

    1. Adolfsson J, Mansson R, Buza-Vidas N, Hultquist A, Liuba K, Jensen CT, et al. . Identification of Flt3+ Lympho-Myeloid Stem Cells Lacking Erythro-Megakaryocytic Potential. Cell (2005) 121:295–306. doi: 10.1016/j.cell.2005.02.013 - DOI - PubMed
    1. Mansson R, Hultquist A, Luc S, Yang L, Anderson K, Kharazi S, et al. . Molecular Evidence for Hierarchical Transcriptional Lineage Priming in Fetal and Adult Stem Cells and Multipotent Progenitors. Immunity (2007) 26:407–19. doi: 10.1016/j.immuni.2007.02.013 - DOI - PubMed
    1. Kondo M, Weissman IL, Akashi K. Identification of Clonogenic Common Lymphoid Progenitors in Mouse Bone Marrow. Cell (1997) 91:661–72. doi: 10.1016/s0092-8674(00)80453-5 - DOI - PubMed
    1. Inlay MA, Bhattacharya D, Sahoo D, Serwold T, Seita J, Karsunky H, et al. . Ly6d Marks the Earliest Stage of B-Cell Specification and Identifies the Branchpoint Between B-Cell and T-Cell Development. Genes Dev (2009) 23:2376–81. doi: 10.1101/gad.1836009 - DOI - PMC - PubMed
    1. Mansson R, Zandi S, Welinder E, Tsapogas P, Sakaguchi N, Bryder D, et al. . Single-Cell Analysis of the Common Lymphoid Progenitor Compartment Reveals Functional and Molecular Heterogeneity. Blood (2010) 115:2601–9. doi: 10.1182/blood-2009-08-236398 - DOI - PubMed

Publication types

MeSH terms

Substances