

doi: 10.1002/adfm.202108378.
Epub 2021 Nov 6.
Ultra-Sharp Nanowire Arrays Natively Permeate, Record, and Stimulate Intracellular Activity in Neuronal and Cardiac Networks
Affiliations
- PMID: 35603230
- PMCID: PMC9122115
- DOI: 10.1002/adfm.202108378
Item in Clipboard
Ultra-Sharp Nanowire Arrays Natively Permeate, Record, and Stimulate Intracellular Activity in Neuronal and Cardiac Networks
Adv Funct Mater.
.
Abstract
We report innovative scalable, vertical, ultra-sharp nanowire arrays that are individually addressable to enable long-term, native recordings of intracellular potentials. Stable amplitudes of intracellular potentials from 3D tissue-like networks of neurons and cardiomyocytes are obtained. Individual electrical addressability is necessary for high-fidelity intracellular electrophysiological recordings. This study paves the way toward predictive, high-throughput, and low-cost electrophysiological drug screening platforms.
Keywords: cardiomyocyte; culture; intracellular; nanowire; neuron; tissue.
Figures
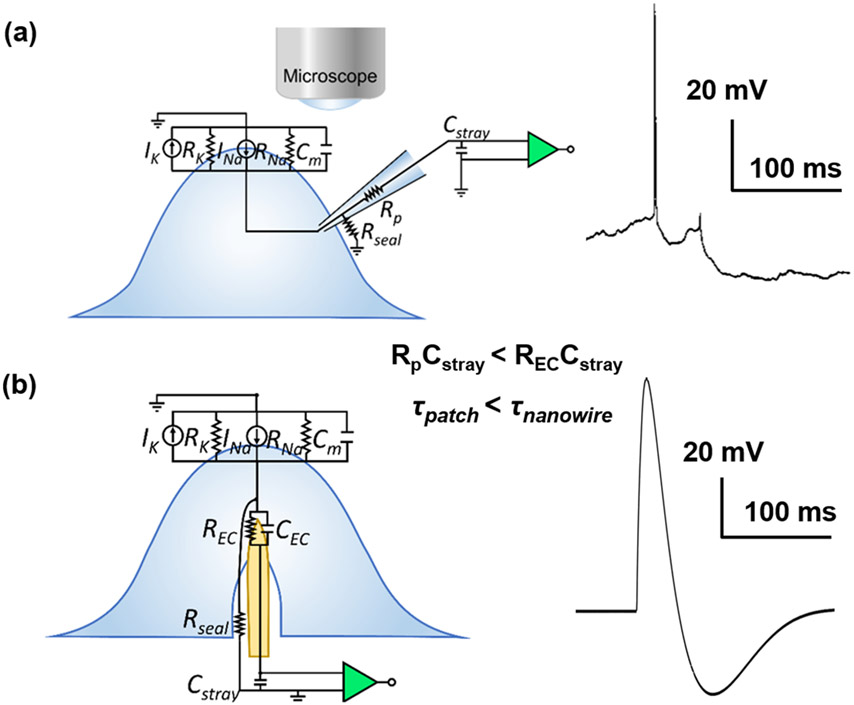
a) Simplified circuit model and typical recording segment from patch clamp electrode-neuron interface from in vivo cat neocortical neurons. Reprinted with permission from Steriade et al. J. Neurophys., 2001, 85, 1969. b) Simplified circuit model and an example recording segment observed from mouse hippocampal neurons at 13 DIV for NW electrode-neuron interface with TDT system.
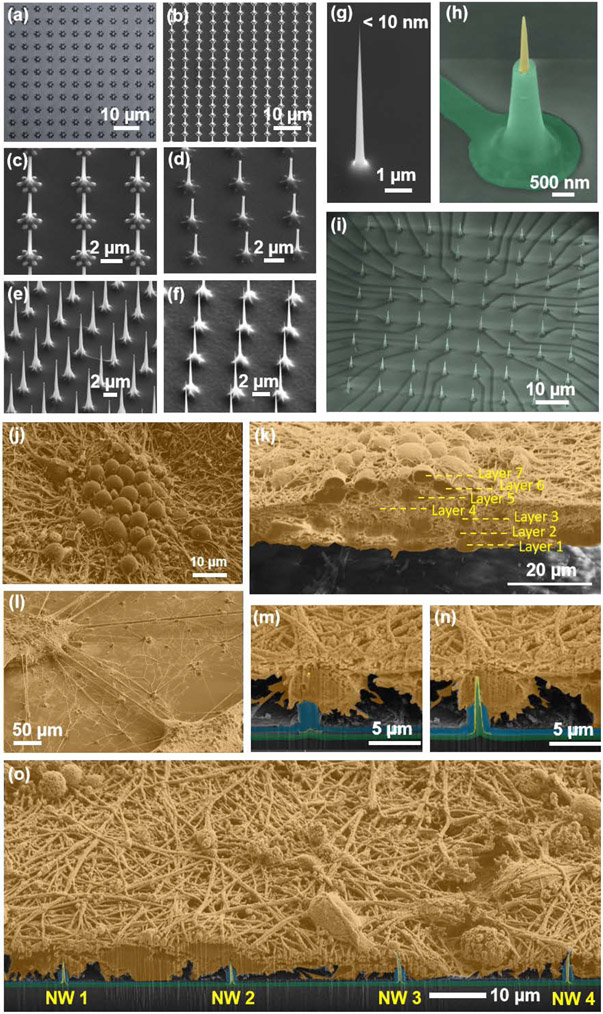
Si USNW array fabrication and characterization of structure and the electrode-neural interface. Overview of the fabrication process. a) Top-view optical microscope image of patterned Ni dot arrays for Si nanowire etching. The center dot diameter was 800 nm. The peripheral dot diameter was 300 nm. b-d) Example SEM images that shows sequential oxidation and oxide stripping leading to reduced diameter of the NWs in the array, smoothening of the NW surface and the tapered structure. e,f) Example SEM images that shows dry etching, sequential oxidation and oxide stripping leading to smoothening of the surface of the USNWs in the array and the reduction of their diameter to sub-10 nm. g) SEM image of a sub-10 nm Si USNW tip prior to Pt coating. h) SEM image of a single Si USNW showing the tapered structure and exposed Pt tip, and i, overall view of Si USNW array. j-o) Colorized SEM images after rat cortical neuron cell fixation showing j) morphology of the cultured rat cortical neurons exhibiting high-density and neurite growth evidencing healthy cell culture and successful network formation, k) cross-section of the cultured neurons exhibiting a multi-layer structure, l) ‘satellite’-like interconnected multi-layer structures on the substrate surface, m) sequential FIB sectioning revealing first the tip of the USNW inside the soma and n) the whole USNW/neuron cross-section, o) wide-view SEM image showing the relative position of multiple USNW electrode with respect to the neuron’s somas.
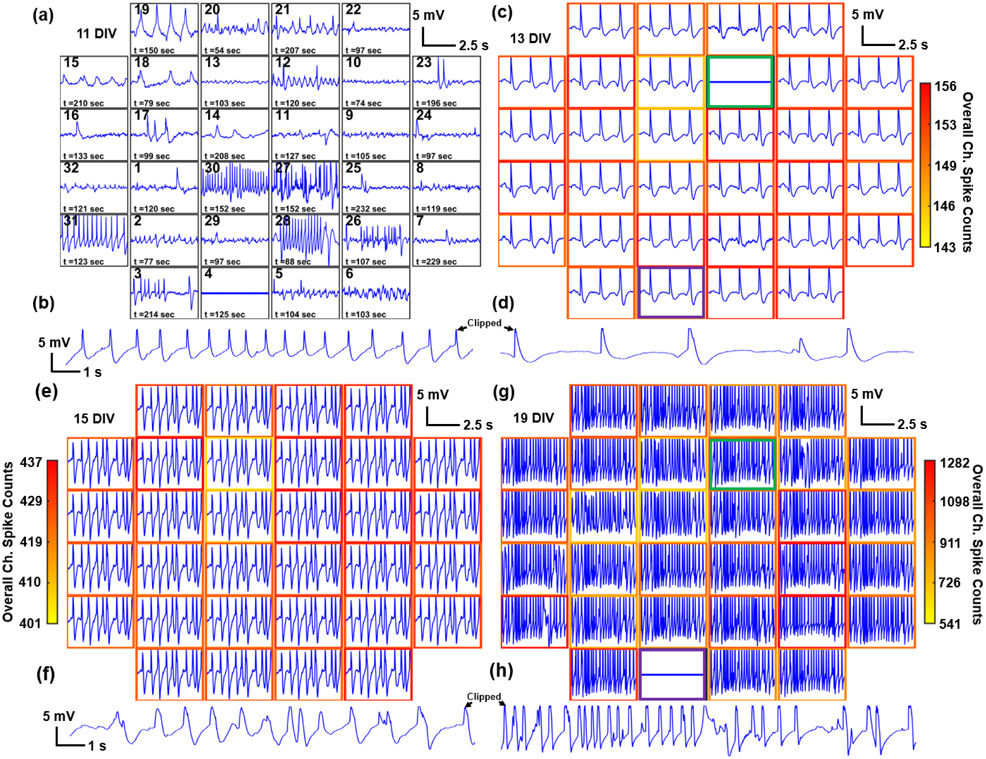
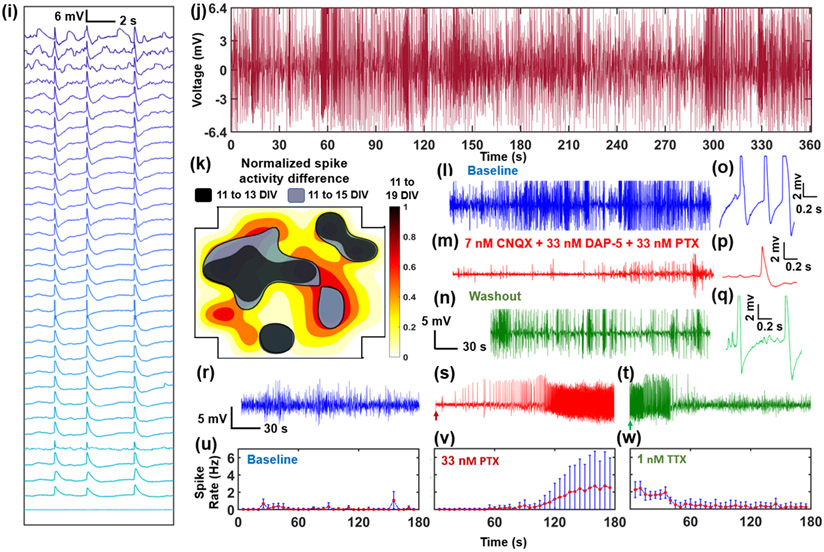
Example electrophysiological recording from one array (pitch=10 μm) and pharmacological interrogation. a, c, e, g) Overall 5 s electrophysiological recording segments of multiple USNWs from group B (10 μm electrode pitch) at 11, 13, 15, and 19 DIV respectively. b, d, f, h) Close-up image of a 7 s recording segment of selected channel 31 from group B exhibiting intracellular AP waveforms at 11, 13, 15, and 19 DIV respectively. a) Overall 5 s recording segments at 11 DIV (different time segments are plotted for each channel to illustrate the overall electrophysiological activities at 11 DIV). b) Close-up image of 7 s recording segment, 11 DIV. c) Overall 5 s recording segments at 13 DIV. d) Close-up image of 7 s recording segment, 13 DIV. Potential shift in USNW-neuron interface is illustrated with green and purple borders (channels 12 and 4 respectively) between 13 and 19 DIV. e) Overall 5 s recording segments at 15 DIV. f) Close-up image of 7 s recording segment, 15 DIV. g) Overall 5 s recording segments at 19 DIV, exhibiting wide variance in spike counts across channels. h) Close-up image of 7 s recording segment, 19 DIV. i) Waterfall plot of APs and varying subthreshold potentials arranged in a descending order across 32 channels from group B at 19 DIV. j) Continuous, 6 minutes recording segment from channel 31 USNW from group B (10 μm electrode pitch) at 19 DIV, showing consistent high amplitude without attenuation. k) Contour map of normalized spike activity differences of 32 channels from 13, 15, and 19 DIV with spike activities from corresponding channels at 11 DIV, group B. The black, blue, and red contours represent regions exhibiting spike activity increases from 11 to 13 DIV, 11 to 15 DIV, and 11 to 19 DIV respectively. Contour colormap from 19 DIV is depicted (normalized to the maximum spike activity difference across 32 channels). l, m, n) Sequential recording segment of sequential pharmacological drug test performed at 8 DIV with 7nM CNQX, 33 nM DAP-5, 33 nM PTX, and 1 nM TTX. o, p, q) Representative spike plots from 8 DIV from baseline recording, after CNQX, DAP-5, and PTX application, and final washout. r, s, t) Sequential recording segment of sequential pharmacological drug test performed at 7 DIV with 33 nM PTX and 1 nM TTX. The arrow pointing at the initial section mark the exact moment the drug was applied to the cultured neurons. PTX application results in heightened spike frequencies and TTX application following PTX application and recording results in reduction in spiking activities. u, v, w) Plots of spike rate over time for baseline, PTX, and TTX recording segments. Spike rate change according to pharmacological drug applications.
Example electrophysiological recording from one array (pitch=10 μm) and pharmacological interrogation. a, c, e, g) Overall 5 s electrophysiological recording segments of multiple USNWs from group B (10 μm electrode pitch) at 11, 13, 15, and 19 DIV respectively. b, d, f, h) Close-up image of a 7 s recording segment of selected channel 31 from group B exhibiting intracellular AP waveforms at 11, 13, 15, and 19 DIV respectively. a) Overall 5 s recording segments at 11 DIV (different time segments are plotted for each channel to illustrate the overall electrophysiological activities at 11 DIV). b) Close-up image of 7 s recording segment, 11 DIV. c) Overall 5 s recording segments at 13 DIV. d) Close-up image of 7 s recording segment, 13 DIV. Potential shift in USNW-neuron interface is illustrated with green and purple borders (channels 12 and 4 respectively) between 13 and 19 DIV. e) Overall 5 s recording segments at 15 DIV. f) Close-up image of 7 s recording segment, 15 DIV. g) Overall 5 s recording segments at 19 DIV, exhibiting wide variance in spike counts across channels. h) Close-up image of 7 s recording segment, 19 DIV. i) Waterfall plot of APs and varying subthreshold potentials arranged in a descending order across 32 channels from group B at 19 DIV. j) Continuous, 6 minutes recording segment from channel 31 USNW from group B (10 μm electrode pitch) at 19 DIV, showing consistent high amplitude without attenuation. k) Contour map of normalized spike activity differences of 32 channels from 13, 15, and 19 DIV with spike activities from corresponding channels at 11 DIV, group B. The black, blue, and red contours represent regions exhibiting spike activity increases from 11 to 13 DIV, 11 to 15 DIV, and 11 to 19 DIV respectively. Contour colormap from 19 DIV is depicted (normalized to the maximum spike activity difference across 32 channels). l, m, n) Sequential recording segment of sequential pharmacological drug test performed at 8 DIV with 7nM CNQX, 33 nM DAP-5, 33 nM PTX, and 1 nM TTX. o, p, q) Representative spike plots from 8 DIV from baseline recording, after CNQX, DAP-5, and PTX application, and final washout. r, s, t) Sequential recording segment of sequential pharmacological drug test performed at 7 DIV with 33 nM PTX and 1 nM TTX. The arrow pointing at the initial section mark the exact moment the drug was applied to the cultured neurons. PTX application results in heightened spike frequencies and TTX application following PTX application and recording results in reduction in spiking activities. u, v, w) Plots of spike rate over time for baseline, PTX, and TTX recording segments. Spike rate change according to pharmacological drug applications.
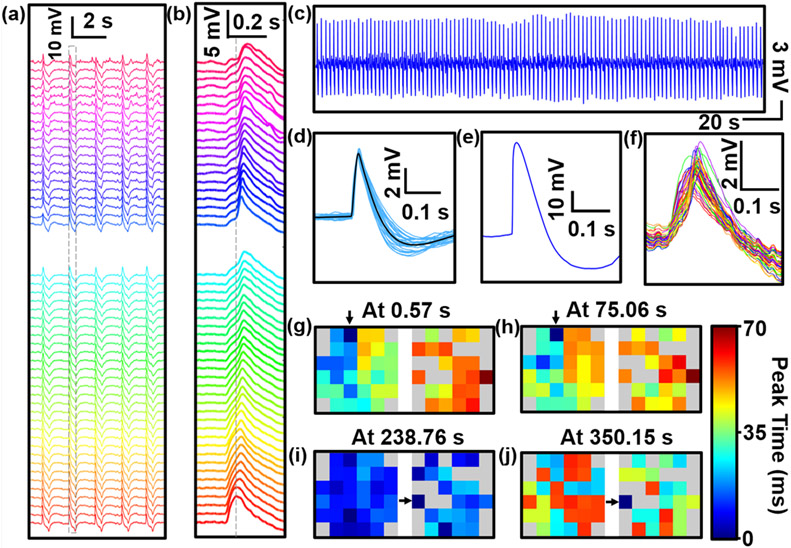
a) 52-Channel voltage traces of two arrays recorded from the iPSC-CVPCs at day 34 of differentiation (5 DIV). b) Zoom-in view of the second column of traces in a) shows a single-spiked AP recording. c) Intracellular recordings of cardiac activity from a representative channel (No. 48) show consistent spiked APs with no amplitude decay during the 372 s recording time. d) Zoom-in view of 47 randomly selected raw waveforms of a representative spike-sorting APs and spike averaged waveform, as shown in black. e) 60 mV AP measured via TDT system. f) Selected time segment of 52-channel voltage traces. g-j) Mapping of AP propagation patterns across the two arrays at different time points before (at 0.57 s in g) and at 75.06 s in h)) and after (at 238.76 s in i) and at 350.15 s in j)) electrical stimulation. Two intracellular recordings before electrical stimulation (at 0.57 s and at 75.06 s) show AP propagation from left to right, whereas intracellular recordings after electrical stimulation show an evolution from homogeneous propagation at 238.76 s to reversed direction that originates from right to left, where the AP propagation direction start from the simulating electrode. The original pacemaker foci location are labeled with arrows. The biphasic-pulse stimulation peak width, amplitude and frequency were 0.5 ms, 10 nA and 1 Hz, respectively.
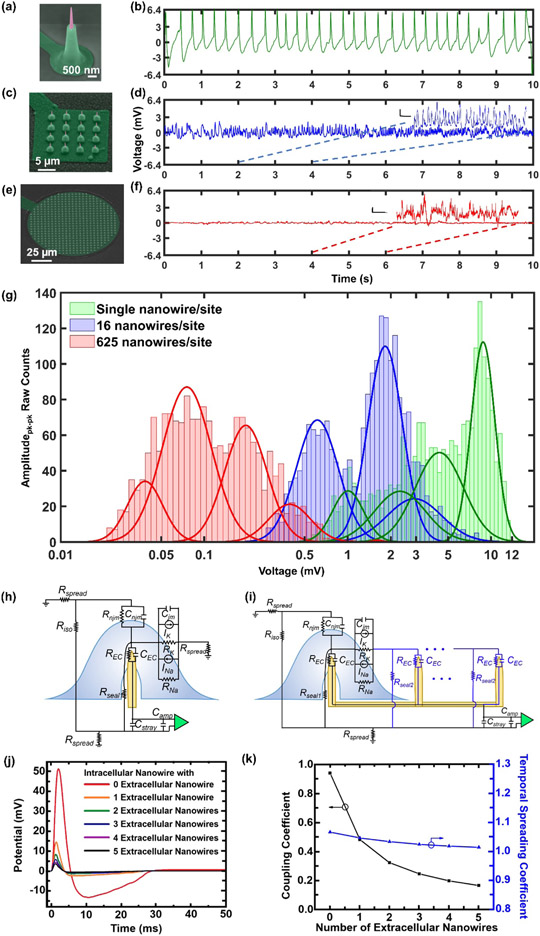
Sample recording traces and amplitude contrasts between individually addressable USNW and multiple USNWs per recording sites and small signal circuit model simulation results. a-f) SEM images of individually addressable, single USNW, 16 USNWs, and 625 USNWs and sample 10 s recording trace from recordings performed at 11 DIV. Single USNW - channel 31 from group B (10 μm electrode pitch), 16 USNWs – channel 31 from group B (10 μm electrode pitch), 625 USNWs – channel 21 from group C (30 μm electrode pitch). Vertical scale bars for zoomed-in recording segments for 16 USNWs and 625 USNWs are: 500 μV and 200 μV respectively. The time scale bar for both segments is 250 ms. g) Histogram of peak-to-peak signal amplitude between single USNW and multi-USNWs per site. There are clear, distinguishable differences in the distribution of amplitudes. Two distributions most likely correspond to the intracellular and extracellular recording interface setup the USNW formed with the neurons. h) Circuit model of single USNW penetrating the cultured neuron. i) Circuit model of multi-USNW setup with only one USNW penetrating the cultured neuron. j) Simulated intracellular signal amplitude based on the number of extracellular USNWs connected to the intracellular USNW. k) Simulated plot of coupling coefficient and temporal spreading coefficient versus the number of extracellular USNWs. Signal attenuation decays exponentially with increasing the number of extracellular USNWs.
References
-
- Steriade M, Timofeev I, Grenier F, Journal of neurophysiology 2001, 85, 1969. - PubMed
-
- Neher E, Sakmann B, Steinbach JH, Pflügers Archiv 1978, 375, 219. - PubMed
-
- Martina M, Vida I, Jonas P, Science 2000, 287, 295. - PubMed
-
- Henze D, Buzsaki G, Neuroscience 2001, 105, 121. - PubMed
-
- Hai A, Shappir J, Spira ME, Nature methods 2010, 7, 200. - PubMed