. 2022 Jan 28:2:10.
doi: 10.1038/s43856-022-00072-0. eCollection 2022.

SARS-CoV-2 introductions and early dynamics of the epidemic in Portugal

Collaborators, Affiliations

SARS-CoV-2 introductions and early dynamics of the epidemic in Portugal

Vítor Borges et al. Commun Med (Lond). .

Abstract

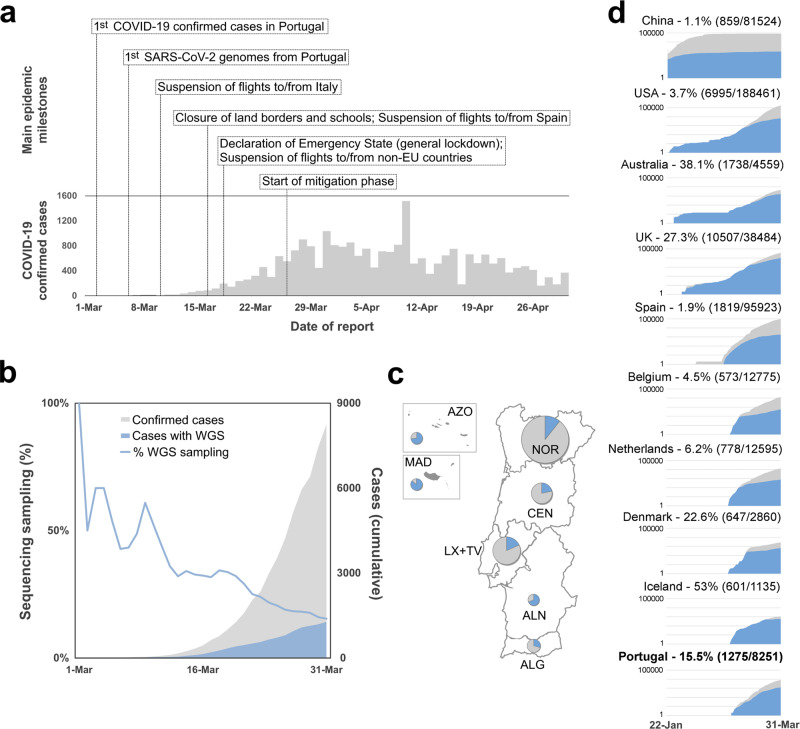
Background: Genomic surveillance of SARS-CoV-2 in Portugal was rapidly implemented by the National Institute of Health in the early stages of the COVID-19 epidemic, in collaboration with more than 50 laboratories distributed nationwide.

Methods: By applying recent phylodynamic models that allow integration of individual-based travel history, we reconstructed and characterized the spatio-temporal dynamics of SARS-CoV-2 introductions and early dissemination in Portugal.

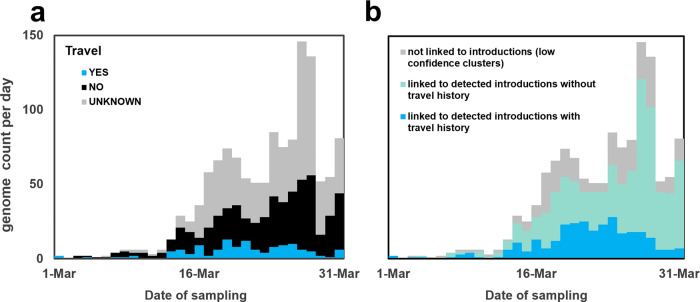
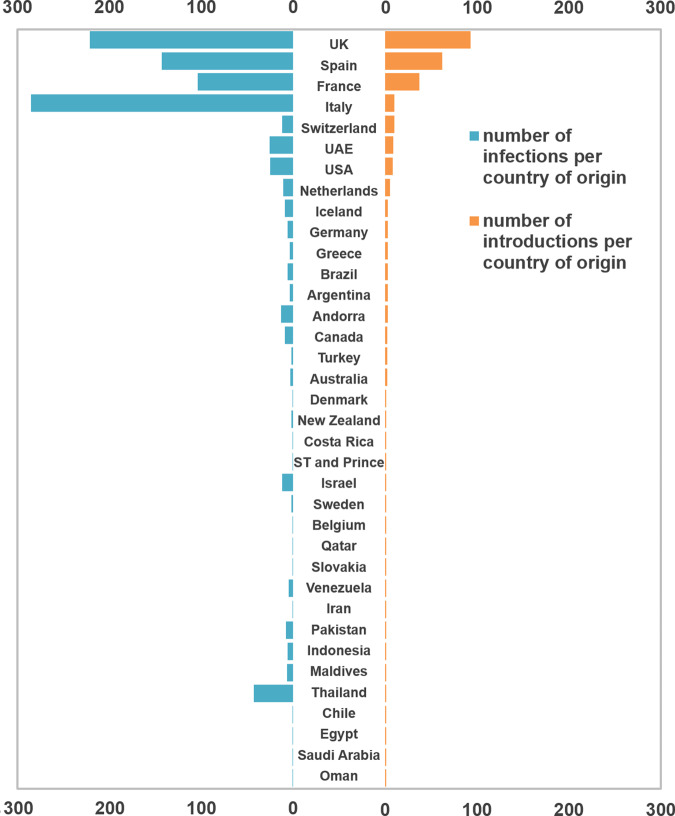
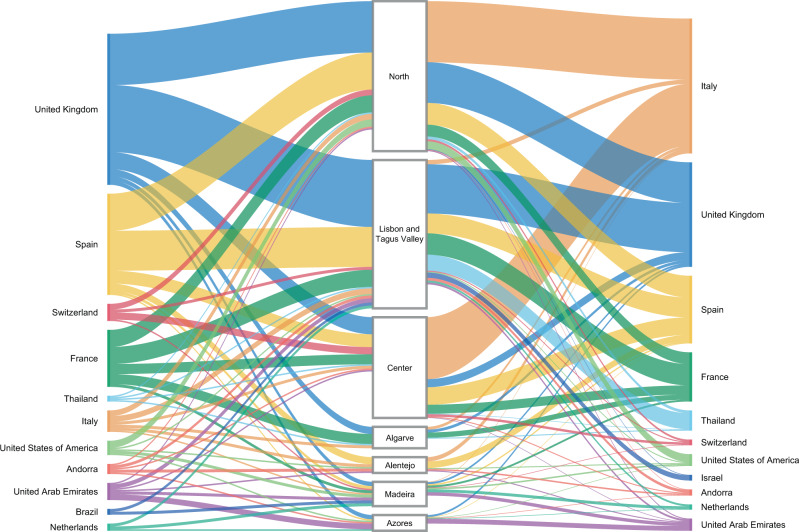
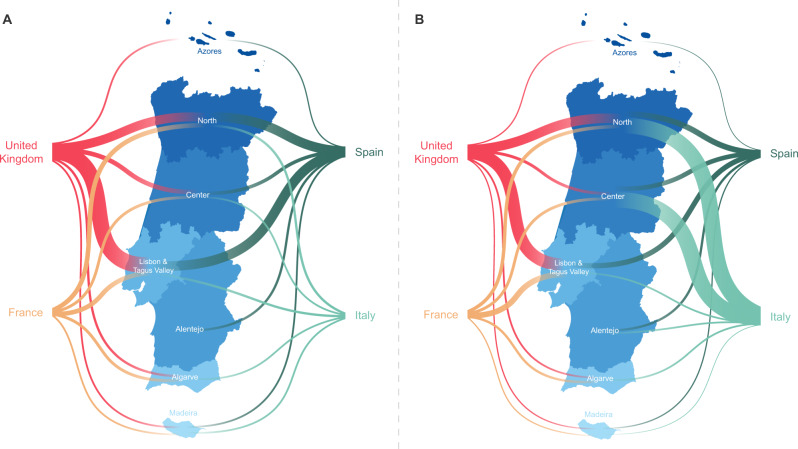
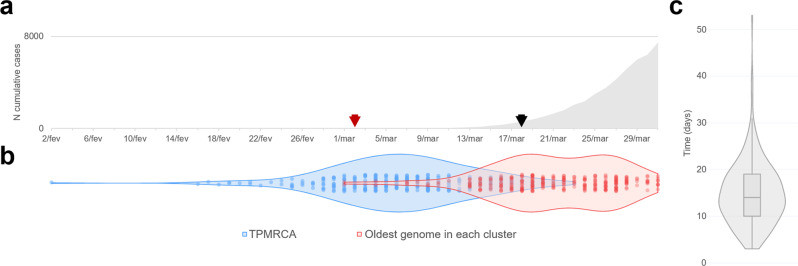
Results: We detected at least 277 independent SARS-CoV-2 introductions, mostly from European countries (namely the United Kingdom, Spain, France, Italy, and Switzerland), which were consistent with the countries with the highest connectivity with Portugal. Although most introductions were estimated to have occurred during early March 2020, it is likely that SARS-CoV-2 was silently circulating in Portugal throughout February, before the first cases were confirmed.

Conclusions: Here we conclude that the earlier implementation of measures could have minimized the number of introductions and subsequent virus expansion in Portugal. This study lays the foundation for genomic epidemiology of SARS-CoV-2 in Portugal, and highlights the need for systematic and geographically-representative genomic surveillance.

Keywords: SARS-CoV-2; Viral infection.


Conflict of interest statement

Competing interestsThe authors declare no competing interests.

Figures

Fig. 1
Fig. 1. Overview of the COVID-19 confirmed cases and SARS-CoV-2 genome sequencing sampling in Portugal during the early phase of the pandemic.
a Daily reported COVID-19 confirmed cases in Portugal and key milestones during the early phase of the pandemic (source: Directorate-General of Health, https://covid19.min-saude.pt/relatorio-de-situacao/). b Area plots (right y-axis) reflect the cumulative total number of COVID-19 confirmed cases (gray) and SARS-CoV-2 genome sequences (blue) reported/obtained in Portugal, until 31 March 2020. The blue line (left y-axis) displays the “sequencing sampling”, i.e. the proportion of confirmed cases with SARS-CoV-2 genome data during the same period. c SARS-CoV-2 sequencing sampling generated by the Health Administration region until 31 March 2020 (circles are proportional to the number of confirmed cases by Region, with the blue representing the proportion of samples with SARS-CoV-2 genome data). NOR Northern region, CEN Central region, LX+TV Lisbon and Tagus Valley region, ALN Alentejo, ALG Algarve, AZO Autonomous Region of Azores, MAD Autonomous Region of Madeira. d Area plots reflect the cumulative total number of COVID-19 confirmed cases (gray) and SARS-CoV-2 genome sequences (blue) reported by country between 22 January and 31 March 2020 for the top 10 countries with the highest number of genomes with collection date until 31 March 2020 (available on GISAID by 8th August 2020). A log10 scale y-axis was used for visualization purposes. Countries are ordered according to the date of the first reported COVID-19 case.
Fig. 2
Fig. 2. Overview of sequences linked to detected introductions, stratified by travel history data.
a Histogram of COVID-19 confirmed cases with SARS-CoV-2 genome sequencing data stratified by travel history. b Histogram with sequence counts stratified by respective reconstruction linked with clades that include sequences from cases with (blue) or without (green) known travel history. Sequences belonging to BEAST clades with low topology posterior probability are shown in gray.
Fig. 3
Fig. 3. Number and size of SARS-CoV-2 introductions per country.
Bar plots represent the number of introductions by country of origin (orange) and respective total number of cases (blue), inferences are derived from the phylodynamic reconstruction.
Fig. 4
Fig. 4. Sankey plots summarizing the viral flow into Portuguese Health Administration regions.
Left. The plot shows the relative number of transitions between countries of origin and different regions in Portugal. For summaries that show all transitions to and from all connected locations, we refer to the Supplementary Data 4. Right. The plot shows the relative number of infections generated by introductions from countries of origin and different regions in Portugal. For summaries that show the size of all introductions to and from all connected locations, we refer to the Supplementary Data 5. For both panels, for graphics simplicity, we present the eleven countries linked with most introductions (left) and relative number of infections generated (right), estimated across phylogenies inferred for the whole dataset, i.e., including both Pango lineages A and B (thin – low proportion of number/size of viral introductions attributed to this source; thick – high proportion of number/size of viral introductions attributed to this source). We note that there is no temporal order for the transitions involved.
Fig. 5
Fig. 5. Map summarizing the viral flow into Portuguese Health Administration regions.
A The plot shows the relative number of transitions between the four countries of origin linked with most introductions to different regions in Portugal. For summaries that show all transitions to and from all connected locations, we refer to the Supplementary Data 4. B The plot shows the relative number of infections generated by introductions from the four countries of origin linked with most relative number of infections generated in different regions in Portugal. For summaries that show the size of all introductions to and from all connected locations, we refer to the Supplementary Data 5. For a broader overview of the 11 countries linked with most introductions and relative number of infections generated, we also refer to Fig. 4. For both panels, introductions (left) and relative number of infections generated (right) were estimated across phylogenies inferred for the whole dataset, i.e., including both Pango lineages A and B (thin – low proportion of number/size of viral introductions attributed to this source; thick – high proportion of number/size of viral introductions attributed to this source). We note that there is no temporal order for the transitions involved.
Fig. 6
Fig. 6. Cryptic transmission of SARS-CoV-2 in Portugal revealed by genomic epidemiology.
a Number of cumulative cases over time (red and black arrows indicate the date of notification of the first COVID-19 case detected in Portugal and the start of the general lockdown, respectively) b Violin plots represent the date of sample collection of the oldest genome in a Portuguese clade (red) and the times for the parent nodes of the most recent common ancestors (TPMRCA in blue) for each of the 277 inferred introductions. c Violin and box plots depict the time lag between the introduction and the first surveilled genome for all 277 clusters.

Similar articles

  • International importance and spread of SARS-CoV-2 variants Alpha, Delta, and Omicron BA.1 into Spain.
    Gallego-García P, Hong SL, Bollen N, Dellicour S, Baele G, Suchard MA, Lemey P, Posada D. Gallego-García P, et al. Commun Med (Lond). 2025 May 30;5(1):209. doi: 10.1038/s43856-025-00912-9. Commun Med (Lond). 2025. PMID: 40447716 Free PMC article.
  • A Founder Effect Led Early SARS-CoV-2 Transmission in Spain.
    Díez-Fuertes F, Iglesias-Caballero M, García-Pérez J, Monzón S, Jiménez P, Varona S, Cuesta I, Zaballos Á, Jiménez M, Checa L, Pozo F, Pérez-Olmeda M, Thomson MM, Alcamí J, Casas I. Díez-Fuertes F, et al. J Virol. 2021 Jan 13;95(3):e01583-20. doi: 10.1128/JVI.01583-20. Print 2021 Jan 13. J Virol. 2021. PMID: 33127745 Free PMC article.
  • The phylodynamics of SARS-CoV-2 during 2020 in Finland.
    Truong Nguyen P, Kant R, Van den Broeck F, Suvanto MT, Alburkat H, Virtanen J, Ahvenainen E, Castren R, Hong SL, Baele G, Ahava MJ, Jarva H, Jokiranta ST, Kallio-Kokko H, Kekäläinen E, Kirjavainen V, Kortela E, Kurkela S, Lappalainen M, Liimatainen H, Suchard MA, Hannula S, Ellonen P, Sironen T, Lemey P, Vapalahti O, Smura T. Truong Nguyen P, et al. Commun Med (Lond). 2022 Jun 10;2:65. doi: 10.1038/s43856-022-00130-7. eCollection 2022. Commun Med (Lond). 2022. PMID: 35698660 Free PMC article.
  • A small number of early introductions seeded widespread transmission of SARS-CoV-2 in Québec, Canada.
    Murall CL, Fournier E, Galvez JH, N'Guessan A, Reiling SJ, Quirion PO, Naderi S, Roy AM, Chen SH, Stretenowich P, Bourgey M, Bujold D, Gregoire R, Lepage P, St-Cyr J, Willet P, Dion R, Charest H, Lathrop M, Roger M, Bourque G, Ragoussis J, Shapiro BJ, Moreira S. Murall CL, et al. Genome Med. 2021 Oct 28;13(1):169. doi: 10.1186/s13073-021-00986-9. Genome Med. 2021. PMID: 34706766 Free PMC article.
  • Genomic epidemiology reveals multiple introductions of SARS-CoV-2 followed by community and nosocomial spread, Germany, February to May 2020.
    Muenchhoff M, Graf A, Krebs S, Quartucci C, Hasmann S, Hellmuth JC, Scherer C, Osterman A, Boehm S, Mandel C, Becker-Pennrich AS, Zoller M, Stubbe HC, Munker S, Munker D, Milger K, Gapp M, Schneider S, Ruhle A, Jocham L, Nicolai L, Pekayvaz K, Weinberger T, Mairhofer H, Khatamzas E, Hofmann K, Spaeth PM, Bender S, Kääb S, Zwissler B, Mayerle J, Behr J, von Bergwelt-Baildon M, Reincke M, Grabein B, Hinske CL, Blum H, Keppler OT. Muenchhoff M, et al. Euro Surveill. 2021 Oct;26(43):2002066. doi: 10.2807/1560-7917.ES.2021.26.43.2002066. Euro Surveill. 2021. PMID: 34713795 Free PMC article.

Cited by

References

    1. Wu F, et al. Author Correction: a new coronavirus associated with human respiratory disease in China. Nature. 2020;580:E7. doi: 10.1038/s41586-020-2202-3. - DOI - PMC - PubMed
    1. Zhou P, et al. A pneumonia outbreak associated with a new coronavirus of probable bat origin. Nature. 2020;579:270–273. doi: 10.1038/s41586-020-2012-7. - DOI - PMC - PubMed
    1. World Health Organization (WHO). Weekly operational update on COVID-19https://www.who.int/docs/default-source/coronaviruse/weekly-updates/wou_... (2021).
    1. Dong, E., Du, H. & Gardner, L. An interactive web-based dashboard to track COVID-19 in real time. Lancet Infect Dis. 20, 533–534 (2020). Erratum in: Lancet Infect Dis. 2020 Sep;e215. PMID: 32087114; PMCID: PMC7159018. https://www.arcgis.com/apps/opsdashboard/index.html#/bda7594740fd4029942.... - PMC - PubMed
    1. Alm E, et al. Geographical and temporal distribution of SARS-CoV-2 clades in the WHO European Region, January to June 2020. Euro Surveill. 2020;25:pii=2001410. doi: 10.2807/1560-7917.ES.2020.25.32.2001410. - DOI - PMC - PubMed