. 2022 Apr 13:2:41.
doi: 10.1038/s43856-022-00108-5. eCollection 2022.

Impact of SARS-CoV-2 Gamma lineage introduction and COVID-19 vaccination on the epidemiological landscape of a Brazilian city

Affiliations

Impact of SARS-CoV-2 Gamma lineage introduction and COVID-19 vaccination on the epidemiological landscape of a Brazilian city

Cecília Artico Banho et al. Commun Med (Lond). .

Abstract

Background: The emergence of the Brazilian variant of concern, Gamma lineage (P.1), impacted the epidemiological profile of COVID-19 cases due to its higher transmissibility rate and immune evasion ability.

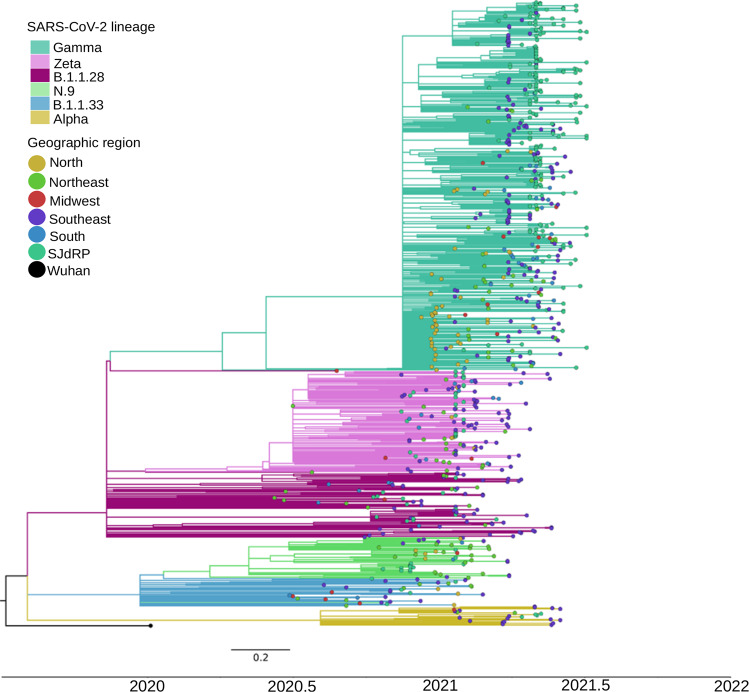
Methods: We sequenced 305 SARS-CoV-2 whole-genomes and performed phylogenetic analyses to identify introduction events and the circulating lineages. Additionally, we use epidemiological data of COVID-19 cases, severe cases, and deaths to measure the impact of vaccination coverage and mortality risk.

Results: Here we show that Gamma introduction in São José do Rio Preto, São Paulo, Brazil, was followed by the displacement of seven circulating SARS-CoV-2 variants and a rapid increase in prevalence two months after its first detection in January 2021. Moreover, Gamma variant is associated with increased mortality risk and severity of COVID-19 cases in younger age groups, which corresponds to the unvaccinated population at the time.

Conclusions: Our findings highlight the beneficial effects of vaccination indicated by a pronounced reduction of severe cases and deaths in immunized individuals, reinforcing the need for rapid and massive vaccination.

Keywords: Epidemiology; Viral infection.


Conflict of interest statement

Competing interestsThe authors declare no competing interests.

Figures

Fig. 1
Fig. 1. Geographic and temporal distribution of SARS-CoV-2 variants detected in the study area of São José do Rio Preto, São Paulo, Brazil, from October 2020 to June 2021 by genomic surveillance.
a Geopolitical map of Brazil and São Paulo state highlighted in grey. b Map of São Paulo state (in grey) indicating the municipality of São José do Rio Preto (SJdRP), located in the Northwest region. c Satellite image of SJdRP generated using the Google Maps Geocoder v. 0.0.3 plugin implemented in QGIS software version 3.8.2 (http://qgis.org). d Prevalence, and distribution of SARS-CoV-2 variants detected in SJdRP from October 2020 to June 2021 by genomic surveillance. The information about the detected SARS-CoV-2 variant’s location and collection date was used to create the maps in QGIS software version 3.8.2 (http://qgis.org).
Fig. 2
Fig. 2. Maximum likelihood tree of SARS-CoV-2 based on complete genome sequences from São José do Rio Preto and all Brazilian regions.
Phylogenetic tree reconstructed using GTR + F + R2 as nucleotide substitution model. The reliability of branching patterns was tested using Ultrafast Bootstrap (UFBoot) combined with SH-like Approximate Likelihood-ratio test (SH-aLRT). The analysis involved 272 complete genome sequences from SJdRP and 509 from five Brazilian regions. The analysis was conducted in IQ-TREE v. 2.0.3, and the final tree was visualized and edited in FigTree v.1.4.4. Branches are colored according to SARS-CoV-2 lineages classified by Pangolin v.3.1.14. Tip nodes are colored according to the origin of the sequences (except the reference sequence from Wuhan), which are from the study area of São José do Rio Preto (SJdRP) and all the Brazilian regions (North, Northeast, Midwest, South, and Southeast). Branch lengths are represented by a scale bar (labelled 0.2) at the bottom of the phylogenetic tree.
Fig. 3
Fig. 3. Maximum likelihood tree of SARS-CoV-2 based on complete genome sequences from São José do Rio Preto, from October 2020 to June 2021, according to sampled month.
The Maximum-Likelihood tree was reconstructed based on the GTR + F + R3 nucleotide substitution model. The reliability of branching patterns was tested using the Ultrafast Bootstrap (UFBoot) combined with SH-like Approximate Likelihood-ratio test (SH-aLRT). The analysis involved 272 complete genome sequences. The analysis was conducted in IQ-TREE v. 2.0.3, and the final tree was visualized and edited in FigTree v.1.4.4. Correlation between the sampling date of the most prevalent SARS-CoV-2 lineages detected in SJdRP and their genetic distance from the root (hCoV-19/Wuhan/WIV04/2019 - EPI_ISL_402124) based on the Maximum Likelihood phylogenetic tree (Correlation coefficient (Cc) = 0.84; R2 = 0.72, substitution rate (r) = 1.3734e-3). Branches are colored according to SARS-CoV-2 lineage classified by Pangolin v. 3.1.14. Tip nodes are colored (except the reference sequence from Wuhan) according to the sampled month. Branch lengths are represented by a scale bar (labelled 0.3) at the bottom of the phylogenetic tree.
Fig. 4
Fig. 4. COVID-19 deaths from March 2020 to June 2021 showing an increase associated with SARS-CoV-2 Gamma lineage introduction and spread in São José do Rio Preto, Brazil.
a COVID-19 deaths per 100,000 inhabitants (black line) from March 2020 to June 2021 (left y-axis) and proportion of Gamma (green line) and Zeta (lilac line) lineages detected (right y-axis). b Percentage of COVID-19 deaths by population age (years). Gamma: SARS-CoV-2 Pangolin lineage P.1. Zeta: SARS-CoV-2 Pangolin lineage P.2.
Fig. 5
Fig. 5. COVID-19 incidence per 100,000 inhabitants from March 2020 to June 2021 in São José do Rio Preto, Brazil.
a COVID-19 incidence per 100,000 inhabitants for total cases. Index of social mobility: measure based on individual mobility reports. b Estimates of effective reproductive number (Reff) overtime (blue line) for all COVID-19 cases (left y-axis), as well as the percentage of Gamma (green line) and Zeta (lilac line) (right y-axis). Error bars indicate 95% confidence intervals for Reff estimates, n = 75,323 cases for calculation. c COVID-19 incidence per 100,000 inhabitants for non-severe cases. d COVID-19 incidence per 100,000 inhabitants for severe cases.
Fig. 6
Fig. 6. Increased COVID-19 mortality risk associated with SARS-CoV-2 Gamma lineage introduction and estimated impact of COVID-19 vaccination on transmission, severity, and mortality in São José do Rio Preto, Brazil.
a Incidence rate ratio (IRR) for death for each 25% increase in Gamma prevalence, adjusted for per-day numbers of tests performed. Error bars indicate 95% confidence intervals. Diamonds of different colors represent the IRR death per 25% increase in Gamma prevalence for all individuals under 70 (n = 962) or over 70 years (n = 1210). Data of deaths by each age group and per day is available on Github repository. The circles of different colors represent the IRR death per 25% increase in Gamma prevalence for each age group. b Change in the proportion of cases in each age group from before versus after vaccination. Circles show effective vaccine coverage (total doses divided by twice the population), while diamonds show the percentage of people who have received both doses, along with the line of best fit and 95% confidence interval (shaded area) for each. c, d Change in proportions of severe cases and deaths, respectively.

References

    1. World Health Organization. W. H. O. Coronavirus (COVID-19) Dashboard (Global Situation, accessed 26 July 2021). https://covid19.who.int/.
    1. O’Toole, Á. et al. Pangolin: lineage assignment in an emerging pandemic as an epidemiological tool. Virus Evol.7, veab064 (2021). - PMC - PubMed
    1. W. H. O. Tracking SARS-CoV-2 Variants (World Health Organization, accessed 26 July 2021); https://www.who.int/en/activities/tracking-SARS-CoV-2-variants/.
    1. Plante, J. A. et al. Spike mutation D614G alters SARS-CoV-2 fitness. Nature10.1038/s41586-020-2895-3 (2021). - PMC - PubMed
    1. Zhang, L. et al. SARS-CoV-2 spike-protein D614G mutation increases virion spike density and infectivity. Nat. Commun. 10.1038/s41467-020-19808-4 (2020). - PMC - PubMed