. 2022 Apr 5:2:34.
doi: 10.1038/s43856-022-00095-7. eCollection 2022.

An olfactory self-test effectively screens for COVID-19

Affiliations

An olfactory self-test effectively screens for COVID-19

Kobi Snitz et al. Commun Med (Lond). .

Abstract

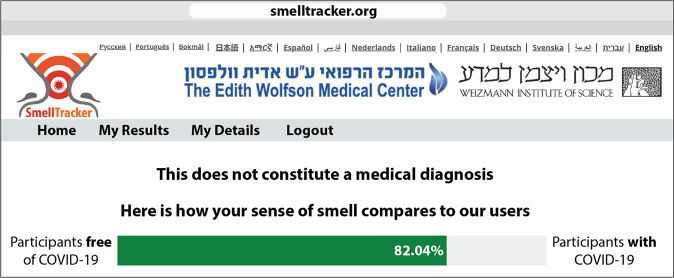
Background: Key to curtailing the COVID-19 pandemic are wide-scale screening strategies. An ideal screen is one that would not rely on transporting, distributing, and collecting physical specimens. Given the olfactory impairment associated with COVID-19, we developed a perceptual measure of olfaction that relies on smelling household odorants and rating them online.

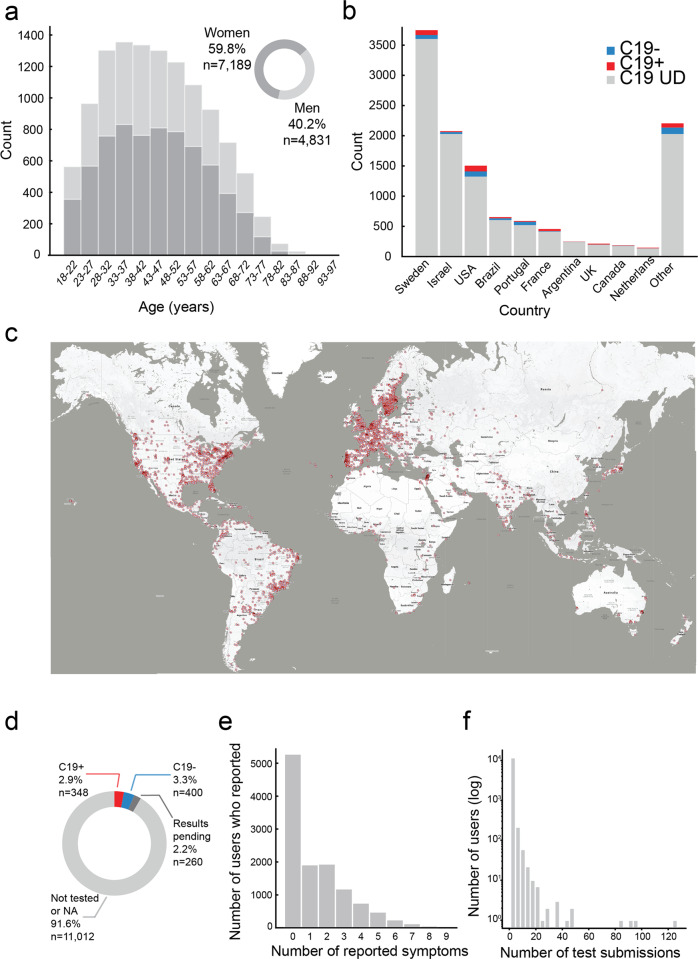
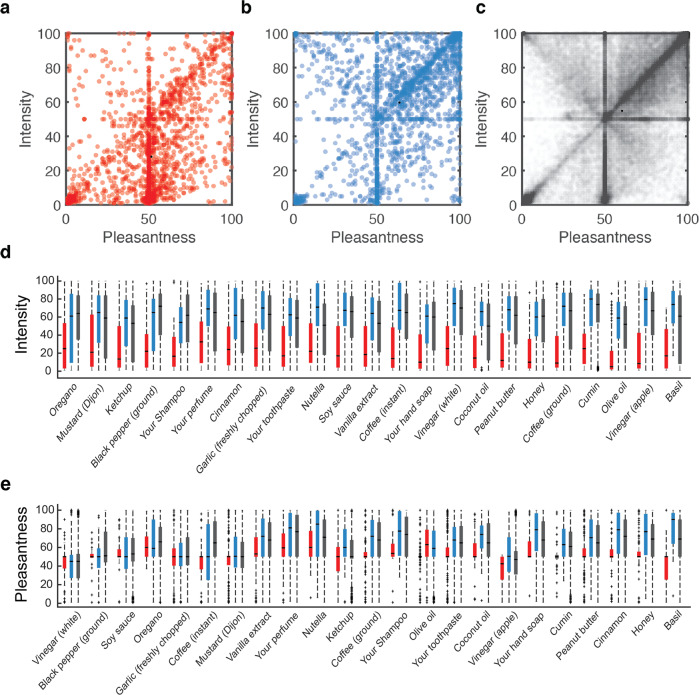
Methods: Each participant was instructed to select 5 household items, and rate their perceived odor pleasantness and intensity using an online visual analogue scale. We used this data to assign an olfactory perceptual fingerprint, a value that reflects the perceived difference between odorants. We tested the performance of this real-time tool in a total of 13,484 participants (462 COVID-19 positive) from 134 countries who provided 178,820 perceptual ratings of 60 different household odorants.

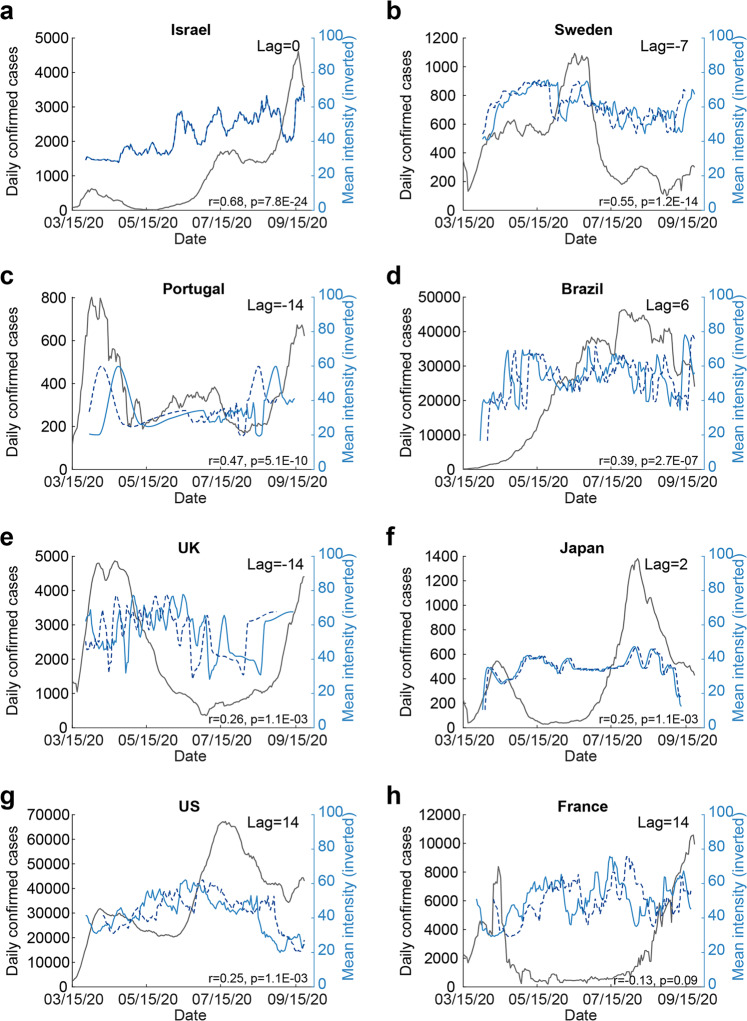
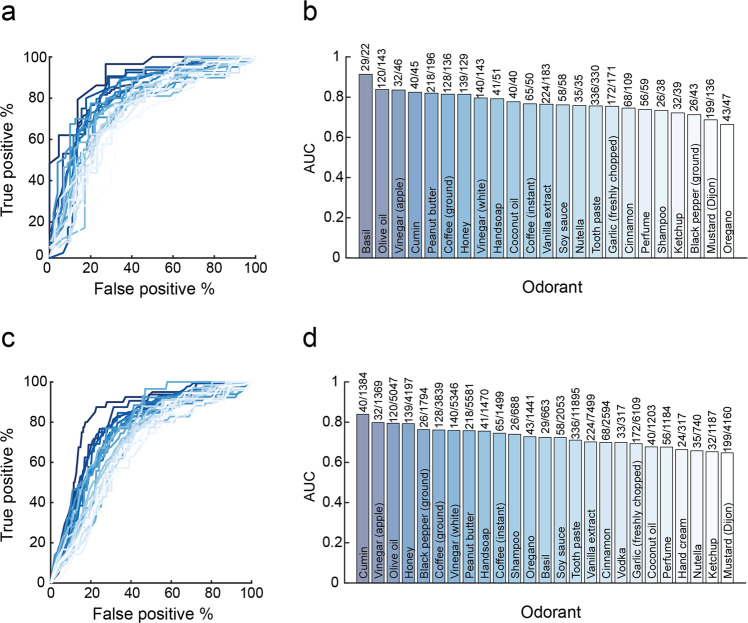
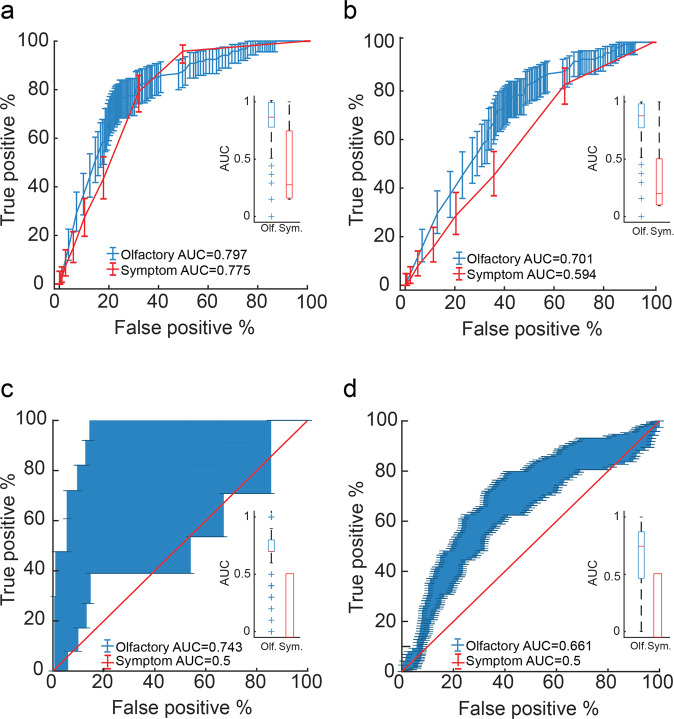
Results: We observe that olfactory ratings are indicative of COVID-19 status in a country, significantly correlating with national infection rates over time. More importantly, we observe indicative power at the individual level (79% sensitivity and 87% specificity). Critically, this olfactory screen remains effective in participants with COVID-19 but without symptoms, and in participants with symptoms but without COVID-19.

Conclusions: The current odorant-based olfactory screen adds a component to online symptom-checkers, to potentially provide an added first line of defense that can help fight disease progression at the population level. The data derived from this tool may allow better understanding of the link between COVID-19 and olfaction.

Keywords: Olfactory system; Signs and symptoms.


Conflict of interest statement

Competing interestsThe authors declare no competing interests.

Figures

Fig. 1
Fig. 1. Characterization of 12,020 participants.
a Histogram of age and gender distribution of participants. b Histogram of number of participants and their COVID-19 status from the ten highest-participation countries (see comment on India in “Methods” section). c Map of geographical distribution of respondents, each dot is a participant, overlapping dots not shown to maintain clarity. d Pie chart of the distribution of C19+, C19−, and C19-UD in the sample. e Histogram of the distribution of number of somatic symptoms reported by participants. f Histogram of the distribution of number of submissions per participant.
Fig. 2
Fig. 2. Olfactory perception indicates on levels of COVID-19 infection at the population level.
ac Each dot is an odorant rating, aligned for its pleasantness and intensity estimates: a All ratings from C19+ participants (n = 2670 ratings). b All ratings from C19− participants (n = 2580 ratings). c All ratings from C19-UD participants (n = 80,500 ratings). d Intensity estimates for the 23 odorants that were each rated by at least 25 C19+ participants, ordered by effect-size from low (left) to high (right). e Pleasantness estimates for the 23 odorants that were each rated by at least 25 C19+ participants, ordered by effect-size from low (left) to high (right). C19+ in red, C19− in blue, and C19-UD in black. d, e The central mark in the box indicates the median. Bottom and top edges of the box indicate the 25th and 75th percentiles, respectively. The whiskers extend to the most extreme data points not considered outliers. Outliers are plotted individually using the “+” symbol.
Fig. 3
Fig. 3. Odorant intensity estimates correlated with national COVID-19 infection rates over time.
a The correlation between intensity estimates and national levels of COVID-in Israel. Blue line: mean daily additive inverse intensity ratings. Dashed blue line: shifted additive inverse intensity time-series, after finding the peak lag using cross correlation (see “Methods” section). Black line: number of daily confirmed cases in each country. Note that when the lag is close to zero, then the dashed and solid blue lines align and overlap. All other panels the same as a but for: b Sweden. c Portugal. d Brazil. e United Kingdom. f Japan. g United States. h France.
Fig. 4
Fig. 4. Single odorant intensity estimates indicate on COVID-19 at the individual level.
a Receiver-operator curves (ROCs) based on intensity estimates of 23 odorants obtained from C19+ vs. C19− participants. b The area under the curve (AUC) for each odorant, with the number of C19+/C19− participants above each bar. We note that these bars reflect a single value, the AUC of all available data, which has no error associated with it. c ROCs based on intensity estimates of 23 odorants obtained from C19+ vs. C19− and C19-UD combined participants. d The AUC for each odorant, with the number of C19+/C19− and C19-UD participants above each bar.
Fig. 5
Fig. 5. Olfactory testing is more effective than symptom checking.
a Receiver-operator curves (ROCs) for all participants who smelled Olive Oil (n = 5167 participants), based on odor intensity (blue) or reported symptoms (red). For all panels: the inlay reflects mean ROC area under the curve (AUC). The central mark in the box indicates the median. Bottom and top edges of the box indicate the 25th and 75th percentiles, respectively. The whiskers extend to the most extreme data points not considered outliers. Outliers are plotted individually using the “+” symbol. b ROCs for all participants who smelled Olive Oil and had symptoms (n = 2627 participants), based on odor intensity (blue) or reported symptoms (red). c ROCs for all asymptomatic participants (n = 7740 participants), based on a classifier using OPFs (blue) or reported symptoms (red). We note no variance in the symptom-based box (red) as all participants were asymptomatic. d Same as in c, but for a later-collected independent set of 1464 participants, with a significantly higher proportion of C19+. Note that the reported symptoms have zero variance in c and d because these are all completely asymptomatic participants. The difference in variability between c and d is because c has 33 asymptomatic C19+ participants, yet d has 114 asymptomatic C19+ participants.
Fig. 6
Fig. 6. Implementation through informative feedback.
At the end of a ~5 min interaction, participants are informed as to what extent their sense of smell resembles a C19+ or C19− participant. The above depiction is an anecdotal actual case of an individual who was C19+, but completely subjectively unaware of any olfactory loss or impairment. Nevertheless, based on the olfactory perceptual fingerprint (OPF), our algorithm determined that this individual was 82.04% C19+. This implies a useful implementation of our tool.

References

    1. Imran A, et al. AI4COVID-19: AI enabled preliminary diagnosis for COVID-19 from cough samples via an app. Informat. Med. Unlocked. 2020;20:100378. - PMC - PubMed
    1. Menni C, et al. Real-time tracking of self-reported symptoms to predict potential COVID-19. Nat. Med. 2020;26:1037–1040. - PMC - PubMed
    1. Munsch N, et al. Diagnostic accuracy of web-based COVID-19 symptom checkers: comparison study. J. Med. Internet Res. 2020;22:e21299. - PMC - PubMed
    1. Ting DSW, Carin L, Dzau V, Wong TY. Digital technology and COVID-19. Nature Med. 2020;26:459–461. - PMC - PubMed
    1. Mizumoto K, Kagaya K, Zarebski A, Chowell G. Estimating the asymptomatic proportion of coronavirus disease 2019 (COVID-19) cases on board the Diamond Princess cruise ship, Yokohama, Japan, 2020. Eurosurveillance. 2020;25:2000180. - PMC - PubMed