. 2022 Apr 4:2:30.
doi: 10.1038/s43856-022-00096-6. eCollection 2022.

Auditory deep sleep stimulation in older adults at home: a randomized crossover trial

Affiliations

Auditory deep sleep stimulation in older adults at home: a randomized crossover trial

Caroline Lustenberger et al. Commun Med (Lond). .

Abstract

Background: Auditory stimulation has emerged as a promising tool to enhance non-invasively sleep slow waves, deep sleep brain oscillations that are tightly linked to sleep restoration and are diminished with age. While auditory stimulation showed a beneficial effect in lab-based studies, it remains unclear whether this stimulation approach could translate to real-life settings.

Methods: We present a fully remote, randomized, cross-over trial in healthy adults aged 62-78 years (clinicaltrials.gov: NCT03420677). We assessed slow wave activity as the primary outcome and sleep architecture and daily functions, e.g., vigilance and mood as secondary outcomes, after a two-week mobile auditory slow wave stimulation period and a two-week Sham period, interleaved with a two-week washout period. Participants were randomized in terms of which intervention condition will take place first using a blocked design to guarantee balance. Participants and experimenters performing the assessments were blinded to the condition.

Results: Out of 33 enrolled and screened participants, we report data of 16 participants that received identical intervention. We demonstrate a robust and significant enhancement of slow wave activity on the group-level based on two different auditory stimulation approaches with minor effects on sleep architecture and daily functions. We further highlight the existence of pronounced inter- and intra-individual differences in the slow wave response to auditory stimulation and establish predictions thereof.

Conclusions: While slow wave enhancement in healthy older adults is possible in fully remote settings, pronounced inter-individual differences in the response to auditory stimulation exist. Novel personalization solutions are needed to address these differences and our findings will guide future designs to effectively deliver auditory sleep stimulations using wearable technology.

Keywords: Randomized controlled trials; Slow-wave sleep.


Conflict of interest statement

Competing interestsC.L. is a member of the Scientific Advisory Board of Emma Sleep GmbH, which is not related to this work. R.H. and W.K. are founders and shareholders of Tosoo AG that has licensed the technology used in this work. All others have no competing interests to declare.

Figures

Fig. 1
Fig. 1. Study and auditory stimulation design.
a Participants first underwent a screening phase to familiarize with the in-home MHSL-Sleepbandv2 (MHSL-SB) use and the mobile phone assessments. In the experimental phase, two-week intervention periods of either Sham (no auditory stimulation) or Verum (auditory stimulation) were conducted in a randomized, crossover design. Daytime recordings reported here (hallmarked by a sun) included subjective sleep quality assessment in the morning, a psychomotor vigilance test (PVT) at 2 pm, the Karolinska sleepiness scale (KSS) in the morning, at 2 pm, and 8 pm, and a mood assessment in the morning and at 8 pm. Nocturnal recordings (hallmarked by a moon) included the nightly application of the MHSL-SB that recorded Fpz-A2 (electroencephalography [EEG]), left and right electrooculography (EOG), and chin electromyography (EMG). The identifiable person in this figure provided written consent to publish this image. b The MHSL-SB performed a sleep classification and defined stable NREM sleep and used a phase-locked-loop (PLL) to precisely time the slow wave modulation during up-phase of the slow wave. During Sham, only triggers were saved to mark slow wave up-phases, during Verum 50 ms pink noise bursts were applied (illustrated as red dots). The defined PLL target phase was around 45°. In each intervention period two types of application were used, the continuous and windowed approach. In the windowed approach, 6 s ON and 6 s OFF windows were alternated, during OFF no slow waves were targeted (but marked), during ON slow wave up-phases were targeted and either stimulated with pink noise bursts (Verum) or only marked (Sham). During the continuous approach, all targeted slow wave up-phases were either stimulated (Verum) or marked (Sham). Each of these approaches lasted for 7 days in a counter-balanced design resulting in four possible order combinations that were counter-balanced across participants: (1) Verum ON, Verum ONOFF, Sham ON, Sham ONOFF, (nsubjects = 4) (2) Sham ON, Sham ONOFF, Verum ON, Verum ONOFF, (nsubjects = 3) (3) Verum ONOFF, Verum ON, Sham ONOFF, Sham ON, (nsubjects = 5) (4) Sham ONOFF, Sham ON, Verum ONOFF, Verum ON (nsubjects = 4).
Fig. 2
Fig. 2. Slow wave effect of auditory stimulation in the windowed stimulation approach.
a Ratio (mean, shaded area SEM) between Verum and Sham in the windowed approach of the normalized spectral density (power divided by cumulative electroencephalography [EEG] power up to 30 Hz) during non-rapid eye movement (NREM) sleep (device and offline detected, consecutive analysis see methods) shows a significant cluster of frequency bins in the low-frequency range of 0.75–1.25 Hz (lowSWA). P-values (fixed factor condition, cond) were derived from a robust linear mixed model (see methods) performed for each frequency bin separately. b Error bars (mean ± SEM) with data points representing individual participants of ON-OFF window analysis of lowSWA for the difference between ON-OFF, ON windows, and OFF windows (see methods). Windows with stimulations (triggers or tones) were sorted and matched for their number of stimulations (stim#, 1–2 stimulations (1–2 stim), 3–4 stimulations (3–4 stim), and more than 4 stimulations (>4 stim)) and compared between Verum and Sham condition. Overall robust linear mixed model results (model includes average of nights) are summarized in the gray panels. The y-axis has been condensed to better visualize the error bars despite outliers. In case of significant main or interaction effects, a robust linear mixed-effects model was calculated for each stimulation bin separately (robust linear mixed-effect model [LMM], model includes all nights, *indicate p < 0.05 **indicate p < 0.01, stars in brackets illustrate exploratory analysis because of non-significant interaction effect). Effect of ON-OFF difference is driven by a significant increase of lowSWA in the ON window as indicated by a significant main effect of condition in a robustLMM, but not the OFF window. Following this significant overall model, separate robust LMM including all nights depict that specifically stimulation bins with more than 2 stimulations (3–4 stim, >4stim) show a significant condition effect in the ON window (*indicate p < 0.05). c In an additional analysis of all the ON-OFF window differences with more than 2 stims, we focused on whether there is a consistent difference between Verum and Sham for all seven nights. Results are shown as error bars (mean ± SEM) and data points represent individual nights of 16 participants. The y-axis has been condensed to better visualize the error bars despite outliers. In a robust LMM with factors nights, conditions, and control fixed and random factors (see methods) revealed no significant interaction night x condition (p > 0.1) and a main effect condition (p < 0.001), indicating a significant effect between Sham and Verum across all seven nights. Solid lines refer to ON window results, long dashed lines to ON-OFF difference and short dashed lines to OFF window results. Data underlying this figure is provided in Supplementary Data 1.
Fig. 3
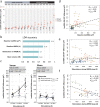
Fig. 3. Predictive factors for across and with subject variability in ON-OFF difference in low-frequency slow wave activity (lowSWA) during the windowed approach.
a Individual (all nights of nsubjects = 16) ON-OFF difference (calculated using ON-OFF analysis, see methods) of lowSWA for all windows with >2 stimulations sorted by averaged lowSWA (red horizontal lines) during Verum. Strong responders refer to the upper 50% and weak responders to the lower 50% of participants. Clear ON-OFF differences during Verum condition across the majority of nights are seen for strong responders but not that clearly for weak responders. (S = Sham, V = Verum). b Linear discrimination analysis (LDA) using 10-fold cross-validation. All good quality nights during Verum ONOFF were included in the model and labeled as weak or strong responder night (dependent variable for classification). For lowSWA and %NREM N3 (non-rapid eye movement stage 3) during baseline, number of stimulations during NREM sleep and mean sound volume (prediction factors) a separate LDA model was run and accuracy in predicting weak and strong responder nights were plotted in blue. * indicate p < 0.05 comparing accuracy achieved by the prediction factors to chance level (No Information Rate). c Comparison of lowSWA ON-OFF difference between weak and strong responder (factor resp) for windows that only included sound volume at 52 dB (baseline lowest level) and for different stimulation bins (factor stim#) using a robust linear mixed-effect model (LMM) illustrated as error bars (mean ± SEM) with data points representing individual participants. The y-axis has been condensed to better visualize the error bars despite outliers. df Repeated measures (rm) correlations to investigate the prediction of nightly lowSWA ON-OFF difference variance. d Predictor baseline lowSWA for all good quality Verum ONOFF nights. e Predictor number of NREM sleep stimuli for all good quality Verum ONOFF nights. f Predictor number of NREM sleep stimuli for all good quality Verum ONOFF nights in strong responder subjects. Data underlying this figure is provided in Supplementary Data 2.
Fig. 4
Fig. 4. Slow wave spectral analysis in the continuous approach in comparison/relation to the windowed approach using the consecutive analysis method.
a Ratio (mean, shaded area SEM) between Verum and Sham of the normalized spectral density (power divided by cumulative EEG power up to 30 Hz) during non-rapid eye movement (NREM) sleep (device and offline detected) shows a significant cluster of frequency bins in the low-frequency range of 1–1.25 Hz. P-values (fixed factor condition) were derived from a robust LMM (see methods) performed for each frequency bin separately. b Slow wave activity in the low-frequency range of 0.75–1.25 Hz (lowSWA) in windows containing more than 2 stimulations for Sham and Verum, for weak and strong responders separately illustrated as error bars (mean ± SEM) with data points representing individual participants. Robust linear mixed model results comparing conditions (factor cond) and the interaction of the condition (Verum vs Sham) and responder (factor resp, weak vs strong) are depicted in the gray panel. c LowSWA summed overall device and offline detected NREM sleep periods (energy, lowSWE) for Verum ON (continuous approach) Verum ONOFF (windowed approach), for weak and strong responders separately illustrated as error bars (mean ± SEM) with data points representing individual participants. Overall robust LMM results (all night included in model) regarding approach (appr) and the interaction of approach and responder are summarized in the gray panel. d LowSWA in windows containing more than 2 stimulations comparing windowed and continuous approaches in responders (nsubjects = 7), for Verum and Sham separately illustrated as error bars (mean ± SEM) with data points representing individual participants. Robust LMM comparing approaches (continuous vs windowed) are summarized in the gray panel. Data underlying this figure is provided in Supplementary Data 3.
Fig. 5
Fig. 5. Repeated measures correlation of mood with low-frequency slow wave activity (lowSWA) and rapid eye movement (REM) sleep.
Repeated measures (rm) correlation of (a) slow wave activity in the low-frequency range of 0.75–1.25 Hz (lowSWA) (calculated using the consecutive analysis (see methods), windows with >2 stimulations) changes in Verum relative to Sham and (b) REM sleep changes relative to Sham with mood changes relative to Sham. Mood assessments were used from the morning assessments (lower values indicate a more negative mood). All nights during Verum were taken (pooled approaches in this correlation) relative to the averaged values of the respective Sham period (Sham ONOFF in windowed Verum nights, Sham ON in continuous Verum nights). Data underlying this figure is provided in Supplementary Data 4.

References

    1. Ashford, R., Moore, P., Hu, B., Jackson, M. & Wan, J. Translational research and context in health monitoring systems. In 2010 International Conference on Complex, Intelligent and Software Intensive Systems 81–86 (IEEE, 2010).
    1. Nilsen W, Riley WT, Heetderks W. News from the NIH: using mobile and wireless technologies to improve health. Transl. Behav. Med. 2013;3:227–228. - PMC - PubMed
    1. Woolf SH. The meaning of translational research and why it matters. Jama. 2008;299:211–213. - PubMed
    1. Sim I. Mobile devices and health. N. Engl. J. Med. 2019;381:956–968. - PubMed
    1. Khosla S, et al. Consumer sleep technologies: how to balance the promises of new technology with evidence-based medicine and clinical guidelines. J. Clin. Sleep Med. 2019;15:163–165. - PMC - PubMed

Associated data