. 2022 May 18:2:52.
doi: 10.1038/s43856-022-00100-z. eCollection 2022.

German federal-state-wide seroprevalence study of 1st SARS-CoV-2 pandemic wave shows importance of long-term antibody test performance

Affiliations

German federal-state-wide seroprevalence study of 1st SARS-CoV-2 pandemic wave shows importance of long-term antibody test performance

Stefan Lohse et al. Commun Med (Lond). .

Abstract

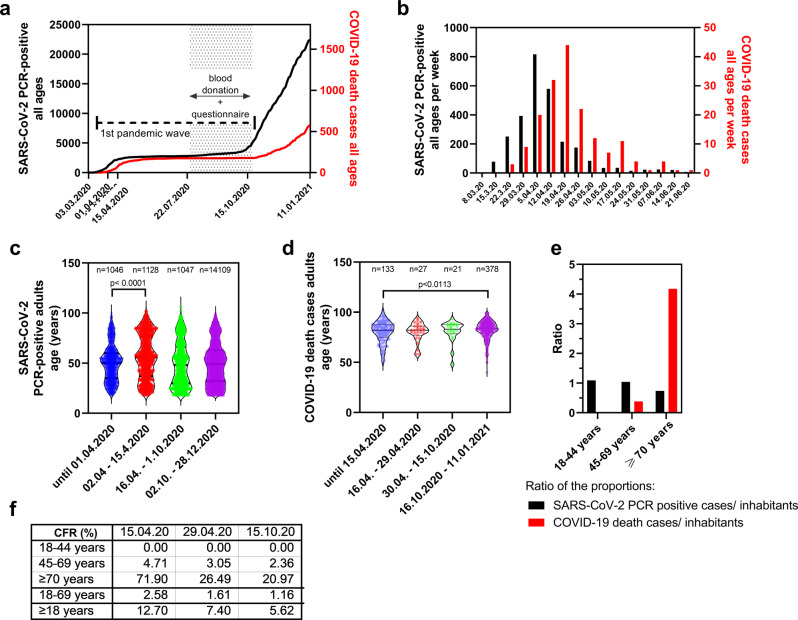
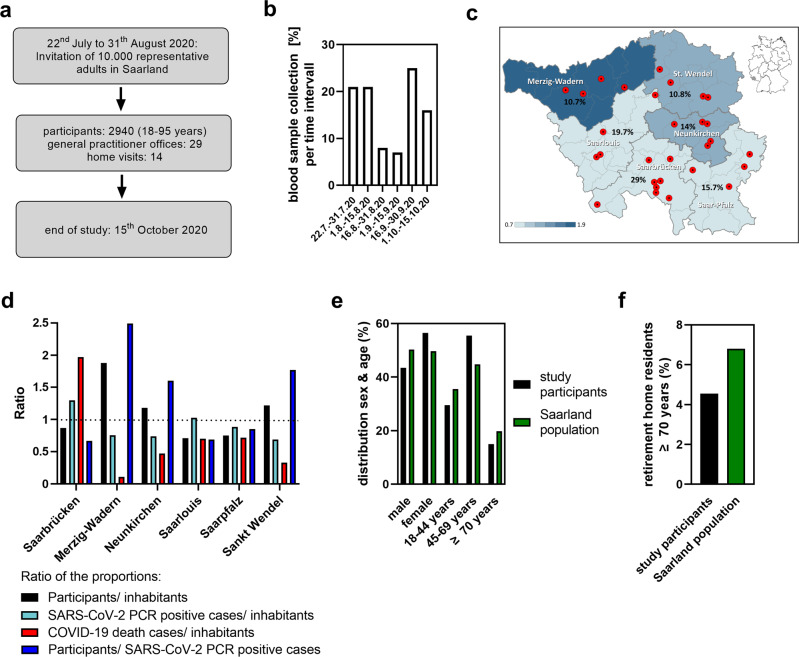
Background: Reliable data on the adult SARS-CoV-2 infection fatality rate in Germany are still scarce. We performed a federal state-wide cross-sectional seroprevalence study named SaarCoPS, that is representative for the adult population including elderly individuals and nursing home residents in the Saarland.

Methods: Serum was collected from 2940 adults via stationary or mobile teams during the 1st pandemic wave steady state period. We selected an antibody test system with maximal specificity, also excluding seroreversion effects due to a high longitudinal test performance. For the calculations of infection and fatality rates, we accounted for the delays of seroconversion and death after infection.

Results: Using a highly specific total antibody test detecting anti-SARS-CoV-2 responses over more than 180 days, we estimate an adult infection rate of 1.02% (95% CI: [0.64; 1.44]), an underreporting rate of 2.68-fold (95% CI: [1.68; 3.79]) and infection fatality rates of 2.09% (95% CI: (1.48; 3.32]) or 0.36% (95% CI: [0.25; 0.59]) in all adults including elderly individuals, or adults younger than 70 years, respectively.

Conclusion: The study highlights the importance of study design and test performance for seroprevalence studies, particularly when seroprevalences are low. Our results provide a valuable baseline for evaluation of future pandemic dynamics and impact of public health measures on virus spread and human health in comparison to neighbouring countries such as Luxembourg or France.

Keywords: Population screening; Viral infection.


Conflict of interest statement

Competing interestsThe authors declare no competing interests.

Figures

Fig. 1
Fig. 1. Assay performance data.
Evaluation of the test performance using sera from convalescent donors after asymptomatic or mild infection, or pre-pandemic sera from donors after PCR-approved infections with endemic coronavirus strains to test potential cross-reactivities. Data are illustrated as box and whiskers blots showing minimum and maximum and all data points as OD ratio for Euroimmun-IgG (a), index for Abbott-IgG (b) and COI/Q.E. for Roche-Ig (c). Sample size for convalescent donors was 61, for potentially cross-reactive sera 128 (EI-IgG, Roche-Ig) and 78 (Abbott-IgG) (Table 2).
Fig. 2
Fig. 2. Differences in longitudinal performances of SARS-CoV-2 antibody test systems.
ac Time course of serological test results from the same 30 convalescent donors; identical sera were tested in three different assays (Euroimmun-IgG, Abbott-IgG and Roche-Ig). d Calculation of the linear regression overall data points of each individual assay results shown in ac. e Calculation of the mean slope by simple linear regression analysis. f Comparison of test results of the first and last serum donation in the individual assays. g Number of positive and negative test results at the last individual date of blood donation. h Time interval after which a negative antibody test result was obtained from convalescent donors with previously positively tested sera. Data are illustrated as OD ratio for Euroimmun-IgG, index for Abbott-IgG and COI/Q.E. for Roche-Ig in ad and f, slope (signal ratio/days) in e, numbers of patients in g, time (days) in h as box and whiskers blots showing all data points with minimum and maximum. Significances were calculated with one-way ANOVA with Tukey correction (t = 3.005, df = 110) in e and unpaired two-tailed t-test (t = 15.05, df = 58) in f and resulting p-values are depicted.
Fig. 3
Fig. 3. SARS-CoV-2 PCR-confirmed cases in Saarland: Time course, mean age and death cases.
a Reported SARS-CoV-2 PCR-positive cumulative infections (black) and deaths (red) in Saarland from March 3, 2020 to January 11, 2021 (data source: Saarland Ministry of Health). First pandemic wave and time frame of the seroprevalence study (July 22 to October 15, 2020) are indicated. b SARS-CoV-2 PCR-positive cases (black) and COVID-19 death cases (red) in Saarland per calendar week. c Violin plot with median ages of PCR-positive cases during the indicated time intervals. (until 01.04.2020 n = 1046; 02.04.–15.04.2020 n = 1128; 16.04.–01.10.2020 n = 1047; 02.10.–28.12.2020 n = 14109). d Violin plot with median of death cases per age during the indicated time intervals (time frames shifted for 14 days compared to b. Until 15.04.2020 n = 133; 16.04.–29.04.2020 n = 27; 30.04.–15.10.2020 n = 21; 16.10.2020–11.01.2021 n = 378). Significances were calculated with unpaired two-sided t-test, p-values are depicted (B: t = 7.229, df = 2172; C: t = 2.543, df = 509). e Ratio of the proportion of SARS-CoV-2 PCR-confirmed cases by 01.04.2020 (black), or the proportion of COVID-19 death cases by 15.04.2020 (red) in the indicated age groups, relative to the proportion of Saarland inhabitants in the indicated age groups. f Time trends of case-fatality-rates (CFR) in Saarland at indicated time points for 18–44-, 45–69-year-old adults, elderly individuals ≥70 years, 18–69-year-old adults and all adults (≥18 years). Calculations are based on data in Supplementary Table 2.
Fig. 4
Fig. 4. Study design and composition of the study population.
a Time scale of study enrollment. b Percentages of blood samples from study participants collected during the indicated time frames of the study. c Numbers (%) indicate the proportion of study participants from respective administrative districts. The color graduation indicates the relative representation of the resident district population within the study population from 0.7 to 1.9 in steps of 0.2. Administrative boundaries from © GeoBasis-DE / BKG (2020), Data licence Germany—attribution—version 2.0. d Shown is the quotient of the relative proportions of study participants per district (black), SARS-CoV-2 PCR-positive cases per district (light blue), COVID-19 death cases per district (red), respectively, and the relative proportion of residents in that district, or the quotient of the relative proportion of study participants per district (blue) and the relative proportion of SARS-CoV-2 PCR-positive cases per district by October 15, 2020. e Sex and age characteristics of study participants in relation to the resident population (Supplementary Table 1). f Proportion of individuals aged 70 years or older living in nursing or retirement homes in the study sample and the overall population.
Fig. 5
Fig. 5. Comparison of unadjusted, age- and sex-adjusted seroprevalences as well as corrected seroprevalences.
a Comparison of results obtained with Roche-Ig, Abbott-IgG and Euroimmun-IgG assays. b Sex- and age-adjusted seroprevalence data of males and females. c Seroprevalences of males and females corrected for sensitivity and specificity. For correction, validation data from PEI were used (Table 1). 95% confidence intervals are shown in Supplementary Table 6.
Fig. 6
Fig. 6. Assay-dependent seroprevalence, underestimation ratio and estimation of IFR.
a Test performance-corrected seroprevalence rates on October 15, 2020. b Underestimation ratio as calculated by corrected seroprevalence in relation to the number of reported PCR-positive cases in Saarland (valuation date October the 1st, 2020). c Infection fatality rates as calculated from the CFRs and respective underreporting rates on October 15, 2020, the end of the 1st pandemic wave. Data in the subfigures ac were obtained with three different antibody tests systems, either in all adults or in adults younger than 70 years, respectively, as indicated. Respective 95% confidence intervals are shown in Supplementary Table 6.

References

    1. Stringhini, S. et al. Seroprevalence of anti-SARS-CoV-2 IgG antibodies in Geneva, Switzerland (SEROCoV-POP): a population-based study. Lancet10.1016/S0140-6736(20)31304-0 (2020). - PMC - PubMed
    1. Streeck H, et al. Infection fatality rate of SARS-CoV2 in a super-spreading event in Germany. Nat. Commun. 2020;11:5829. doi: 10.1038/s41467-020-19509-y. - DOI - PMC - PubMed
    1. Pritsch M, et al. Prevalence and risk factors of infection in the representative COVID-19 cohort Munich. Int. J. Environ. Res. Public Health. 2021;18:3572. doi: 10.3390/ijerph18073572. - DOI - PMC - PubMed
    1. Poethko-Müller, C. et al. German and international studies on SARS-CoV-2 seroprevalence. J. Health Monitor. 10.25646/7024 (2020). - PMC - PubMed
    1. Pollán M, et al. Prevalence of SARS-CoV-2 in Spain (ENE-COVID): a nationwide, population-based seroepidemiological study. Lancet. 2020;396:535–544. doi: 10.1016/S0140-6736(20)31483-5. - DOI - PMC - PubMed