. 2022 Dec;76(6):1778-1793.
doi: 10.1002/hep.32589. Epub 2022 Jun 11.

PAR2 promotes impaired glucose uptake and insulin resistance in NAFLD through GLUT2 and Akt interference

Affiliations

PAR2 promotes impaired glucose uptake and insulin resistance in NAFLD through GLUT2 and Akt interference

Andrew M Shearer et al. Hepatology. 2022 Dec.

Abstract

Background and aims: Insulin resistance and poor glycemic control are key drivers of the development of NAFLD and have recently been shown to be associated with fibrosis progression in NASH. However, the underlying mechanisms involving dysfunctional glucose metabolism and relationship with NAFLD/NASH progression remain poorly understood. We set out to determine whether protease-activated receptor 2 (PAR2), a sensor of extracellular inflammatory and coagulation proteases, links NAFLD and NASH with liver glucose metabolism.

Approach and results: Here, we demonstrate that hepatic expression of PAR2 increases in patients and mice with diabetes and NAFLD/NASH. Mechanistic studies using whole-body and liver-specific PAR2-knockout mice reveal that hepatic PAR2 plays an unexpected role in suppressing glucose internalization, glycogen storage, and insulin signaling through a bifurcating Gq -dependent mechanism. PAR2 activation downregulates the major glucose transporter of liver, GLUT2, through Gq -MAPK-FoxA3 and inhibits insulin-Akt signaling through Gq -calcium-CaMKK2 pathways. Therapeutic dosing with a liver-homing pepducin, PZ-235, blocked PAR2-Gq signaling and afforded significant improvements in glycemic indices and HbA1c levels in severely diabetic mice.

Conclusions: This work provides evidence that PAR2 is a major regulator of liver glucose homeostasis and a potential target for the treatment of diabetes and NASH.


Conflict of interest statement

CONFLICT OF INTEREST

Athan Kuliopulos is the scientific cofounder of Oasis Pharmaceuticals. Lidija Covic is the scientific cofounder of Oasis Pharmaceuticals.

Figures
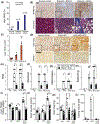
FIGURE 1
FIGURE 1
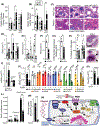
PAR2 is upregulated in the livers of patients and mice with diabetes and NAFLD and boosts blood glucose levels in both nonobese and diabetic mice. (A) Liver biopsies were obtained from 55 patients with diabetes with the diagnosis of NAFLD (Fib 0–1) or NASH (Fib 2–4), along with 20 control nondiabetic patients with normal liver biopsies. Biopsies were stained with hPAR2-Ab (brown: 3,3′-diaminobenzidine/HRP) and scored in a blinded manner for low or high expression. Data analyzed by Cochran-Armitage test for trend. (B) Photomicrographs (400×) of liver biopsies from control, patients with NAFLD and diabetes, and patients with NASH and diabetes stained with hPAR2-Ab or Masson’s trichrome to show blue collagen matrix deposition and macrovesicular steatosis (white empty spaces), bar = 50 μm. (C) Par2+/+ (wild type [WT]) C57BL/6 mice were fed either normal chow (NC) or high-fat diet (HFD) for 16weeks. Diabetes was induced with streptozotocin (STZ; 50mg/kg/day for 5days) at week 8 in cohorts of mice fed HFD. Quantitative PCR (ΔΔCT) of Par2 expression from liver obtained at the 16 week endpoint, normalized to Gapdh (liver). (D) Representative photomicrographs of liver sections from WT and Par/ mice after 16 weeks of NC, 60%HFD or 60%HFD/STZ, stained with mPAR2-Ab; bar = 50 μm. (E–H) NAFLD activity score (NAS), and individual components of the NAS score of mouse livers (n = 9–11) at week 16 were determined from H&E stained sections using the NASH CRN criteria. (I, K) The total weight and liver weight of each mouse was measured at the 16 week endpoint. (J) Blood glucose levels were obtained after 4h fast at week 14–16 after dietary challenge. (L) Plasma insulin levels following 4h fast were quantified the day before the 16 week endpoint. Data depict mean ± SE. In panels E–L, the comparisons used the Student t test between samples under the same dietary conditions; In panel C, multiple comparisons were made using the Dunnett’s test, ****p < 0.0001, ***p < 0.001, **p <0.01, *p < 0.05.
FIGURE 2
FIGURE 2
Genetic loss of PAR2 increases hepatic glycogen storage and expression of Glut2. (A, B) Livers were obtained from mice in Figure 1 at the 16 week endpoint. Hepatic glucose and glycogen was isolated and quantified using the KOH method. (C) Representative images of liver sections at 16 weeks stained for glycogen using PAS with hematoxylin counterstain, bar = 25 μm. (D,E) Quantitative PCR (ΔΔCT) of Glut2 and Glut10 expression in livers with values normalized to Gapdh. (F) Quantitative PCR (ΔΔCT) of Par2 expression in HepG2 cells transduced with either shPar2 to knockdown Par2 expression or shScr controls where values were normalized to Actb. (G) Relative mean fluorescence intensity (MFI) for surface expression of PAR2 on HepG2 cells transduced with either shScr or shPar2 was determined by FACS. (H) Change in glycogen content in HepG2 cells following 0 h or 1 h exposure to 5.5 mM glucose after 4 h preincubation period in serum free and glucose free media. Cells exposed to glucose were normalized to baseline glycogen (no serum, no glucose), n = 12. Glycogen was measured using the amyloglucosidase degradation method. Images on right depict representative PAS staining of glycogen in HepG2 cells following 1 h glucose exposure, bar = 10 μm. (I) Quantitative PCR of Glut2 and Glut10 expression in HepG2 cells determined as in panel D. (J) HepG2 hepatocytes (n = 4) were placed in serum free media for 2h with the indicated pharmacologic inhibitor before addition of trypsin (30 nM) or buffer (−). Quantitative PCR for Glut2 expression was then determined as in D. (K) Quantitative PCR for FoxA3 expression in HepG2 cells (n = 8) 2 h after 30 nM trypsin or buffer as in D. (L) FoxA3 promoter/hGlut2-luciferase reporter constructs pGL3-luciferase (Luci), FoxA3-p1-Luciferase, or FoxA3-p1/p2-Luciferase transiently transfected into HepG2 cells in 96-well plates. HepG2 cells were stimulated for 4 h with buffer (−) or PAR2 agonist trypsin (30 nM) and luciferase activity measured. (M) HepG2 cells were stimulated for4h with 30nm trypsin and glucose uptake quantified using a Glo 2DG (2-deoxyglucose)-coupled luciferase assay (Promega). (N) Summary of findings of effects of array of pharmacologic inhibitors in K on PAR2 suppression of Glut2 expression in hepatocytes. All inhibitors were used at 10 μm concentration except for GFX109203X (5 μm) and U73122 (20 μm) and AZ628 (20 μm). The Student t test was used to determine statistical significance, ***p <0.001, **p < 0.01, *p <0.05, #p = 0.06.
FIGURE 3
FIGURE 3
Patients with diabetes and NAFLD with high levels of hepatic PAR2 have lower GLUT2 expression. (A) Liver biopsies from 52 patients with the diagnosis of NAFLD/NASH and scored for low versus high hepatic PAR2 protein expression in Figure 1A, were stained for GLUT2 using a monoclonal GLUT-2 Ab and anti-mouse FITC secondary-IgG, along with DAPI. Fisher’s extact test of the medians was performed. (B) Representative photomicrographs of GLUT2 and DAPI staining of liver sections from patients with low PAR2 expression versus high PAR2 expression shown in B, bar = 10 μm.
FIGURE 4
FIGURE 4
PAR2 suppresses insulin-stimulated Akt phosphorylation in hepatocytes. (A) Phospho-(S474)-Akt western blots from five independent experiments of HepG2 cells transduced with either shPar2 to knockdown Par2 expression or shScr and preincubated with or without the PAR2 pepducin inhibitor PZ-235 (20 μm). PAR2 was then activated with 30 nm trypsin or buffer (−), followed 10 min later by addition of 15 nm insulin and cell lysates harvested after 10 min. (B) Quantification of western blots in A, with phospho (p)-Akt signal intensity normalized to total Akt (n = 5). (C) Normalized comparison of changes in pAkt signal in B between cells pretreated with PAR2 agonist trypsin prior to insulin stimulation. (D) Western blots of p(S474)Akt, total Akt, pGSK3β,and total GSK3β from mouse livers following 16 weeks high-fat diet (HFD) with or without streptozotocin (STZ) to induce diabetes as in Figure 1. (E) Quantification of pAkt/Akt and pGSK3β/GSK3β from D using liver lysates derived from mice in Figure 1 (n = 9–11). Statistical comparisons used the Dunnett’s test for multiple comparisons in B, C and Student t test in E, **p <0.01, *p <0.05.
FIGURE 5
FIGURE 5
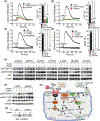
PAR2 attenuates insulin-Akt signaling by a calcium-CaMKK2 dependent mechanism. (A–D) Intracellular calcium flux signals evoked by PAR2 agonists 30 nM trypsin or 1 μm LIGRLO in HepG2 cells transduced with shPar2 to suppress PAR2 expression or shScr ± 20 μm PZ-235 (A-B), or untransduced cells preincubated with 20 μm U73122, 50 μm 2-APB, 0.3 μm YM254890 (C, D). Each calcium trace represents the average signal with AUC normalized relative to the shScr groups (n = 4). Statistical comparisons were made using ANOVA with the Dunnett’s test, ****p <0.0001. (E) Representative western blots (n = 2–5) of the pAkt signals at Ser 473 and Thr 308 5 min after addition of PAR2 agonist 30 nM trypsin and/or 10 nm insulin in HepG2 cells preincubated for 45 min with 10 μm BAPTA-AM, 10 μm A23187, 20 μm U73122, 50 μm 2-APB, 25 μm Sto-609, or 10 μm FK-506. (F) Akt phosphorylation at Ser 473 and Thr 308 in response to trypsin and insulin treatment in HepG2 cells as in E with siRNA knockdown of β-Arrestin2 vs scrambled siRNA control. (G) Detection of CaMKK2 in immunoprecipitates of HepG2 cells following total Akt antibody or β-arrestin1/2 antibody pulldowns after 5 min stimulation with 30 nM trypsin or buffer (−). (H) Proposed mechanism of PAR2 inhibition of insulin-dependent Akt signaling in hepatocytes.
FIGURE 6
FIGURE 6
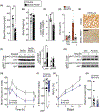
PAR2 deficiency or pepducin inhibition improves hepatic insulin sensitivity and glycemic parameters in obese-diabetic (Db/Db) mice. (A) Blood glucose levels were quantified after a 4 h fast from 8 week old Db/Db;Par2−/ (n = 11) and littermate control wild-type (wt) PAR2 Db/Db (n = 10) mice in the C57BL/6 background. (B, C) Mean body weight and liver weight of mice in panel A at 8 weeks. (D) Quantitative PCR (ΔΔCT) for Par2 expression in liver and fat from wt C57BL/6 versus Db/Db mice (n = 5) with values were normalized to Gapdh (Liver) or Eef2 (Fat). (E) Representative images of PAR2-Ab stained (brown: 3,3′-diaminobenzidine/HRP) liver sections from Db/Db and Db/Db;PAR2−/ mice, bar = 50 μm. (F) Western blots of pAkt in liver and gWAT from fasted mice (n = 4–5) following 5 min stimulation with ip insulin or buffer (−). Quantification is shown on the right panel, fold activation was determined by normalizing pAkt to total Akt for each mouse. (G) Western blot of pAkt from fasted Db/Db mice following 5 min stimulation with ip insulin or buffer (−) receiving PZ-235 (sc 10mg/kg) PAR2 pepducin inhibitor or vehicle 1 h prior to insulin. (H) Blood glucose levels (normalized to baseline) of 6 week Db/Db mice receiving a single sc dose of PZ-235 (10 mg/kg) or vehicle over a 6 h fasting period (n = 9). (I) Average absolute drop in blood glucose levels (mg/dl) in Db/Db mice at the end of the 6 h fasting period shown in panel H. (J) Mean % glycated hemoglobin (HbA1c) levels in whole blood over a 3 week period in Db/Db mice receiving daily sc doses of PZ-235 (10mg/kg/day) or vehicle (n = 9). (K) Fasting plasma insulin levels from mice in J at the end of the 3 week period. Statistical comparisons made use of the Student t test (A–D, F), repeated measures ANOVA (H, J), ***p < 0.001, **p <0.01, *p < 0.05.
FIGURE 7
FIGURE 7
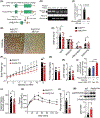
Liver-specific knockout of PAR2 suppresses NAFLD, reduces weight gain, and improves glycemic parameters in mice fed high-fat diet (HFD). (A,B) Strategy and confirmation of targeted mutation in the Par2 gene (F2rl1) in C57BL6 mice. Mice expressing Cre-recombinase under control of the Albumin promoter, Alb-Cre, were crossed with floxed F2rl1tm1c mice in order to generate PAR2ΔHep. Mouse livers (wild-type [WT] PAR2fl/fl vs PAR2ΔHep littermates) were analyzed for (C) Par2 mRNA, (D) PAR2 immunostaining, (E) NAFLD activity score (NAS), and individual components of the NAS score (n = 8–12) after 12weeks HFD. (F) Body weight and (G) daily food consumption in WT (fl/fl) vs PAR2ΔHep mice over 12weeks HFD. (H) Liver weight after 12weeks of HFD. (I) Hepatic glycogen was isolated and quantified by the KOH method in representative livers. (J) Fasting plasma glucose in WT (fl/fl) vs PAR2ΔHep mice. (K) Glucose tolerance test (GTT, 2g glucose ip/kg) in 7–9 WT vs PAR2ΔHep mice at the 12 week endpoint. (L) Plasma insulin levels to mice in I were quantified prior to GTT. (M) Western blots of pS473 AKT, total AKT, and β-actin in representative livers from 12week HFD WT vs. PAR2ΔHep mice with quantification of all samples in the lower panel. Data depict mean ± SE. Student t test or multiple comparisons were made using ANOVA, ****p <0.0001, ***p < 0.001, **p < 0.01, *p < 0.05.
FIGURE 8
FIGURE 8
Mechanism of PAR2 in suppression of hepatic glucose storage and insulin signaling. Activation of the PAR2 protease receptor inhibits the expression of the major hepatic glucose transporter, Glut2, by Gq–MAPK suppression of FoxA3, and reduces the ability of insulin to fully activate phosphoT473-Akt via Gq-calcium-CaMKK2 interference. This results in hepatic insulin resistance, lowered glucose uptake and glycogen storage, with a commensurate increase in circulating glucose levels.

Comment in

References

    1. Younossi ZM, Golabi P, de Avila L, Paik JM, Srishord M, Fukui N, et al. The global epidemiology of NAFLD and NASH in patients with type 2 diabetes: a systematic review and meta-analysis. J Hepatol. 2019;71:793–801. - PubMed
    1. Samuel VT, Shulman Gl. Nonalcoholic fatty liver disease as a nexus of metabolic and hepatic diseases. Cell Metab. 2018;27:22–41. - PMC - PubMed
    1. Jiang S, Young JL, Wang K, Qian Y, Cai L. Diabetic-induced alterations in hepatic glucose and lipid metabolism: the role of type 1 and type 2 diabetes mellitus. Mol Med Rep. 2020;22:603–11. - PMC - PubMed
    1. Alexopoulos AS, Crowley MJ, Wang Y, Moylan CA, Guy CD, Henao R, et al. Glycemic control predicts severity of hepatocyte ballooning and hepatic fibrosis in nonalcoholic fatty liver disease. Hepatology. 2021;74:1220–33. - PMC - PubMed
    1. Rana R, Shearer AM, Fletcher EK, Nguyen N, Guha S, Cox DH, et al. PAR2 controls cholesterol homeostasis and lipid metabolism in nonalcoholic fatty liver disease. Mol Metab. 2019;29:99–113. - PMC - PubMed

Publication types