

Transcriptome analysis of eutopic endometrial stromal cells in women with adenomyosis by RNA-sequencing
- PMID: 35603555
- PMCID: PMC9275863
- DOI: 10.1080/21655979.2022.2077614
Transcriptome analysis of eutopic endometrial stromal cells in women with adenomyosis by RNA-sequencing
Abstract
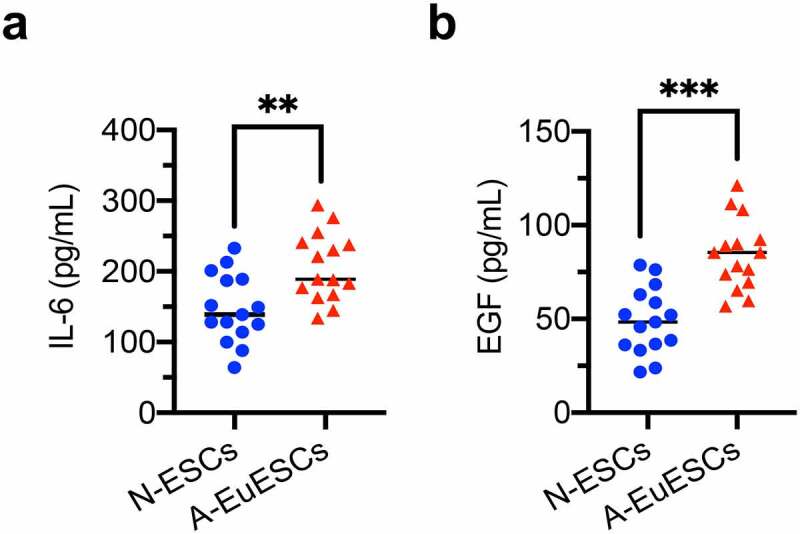
This study aimed to identify differentially expressed genes (DEGs) and molecular pathways in eutopic endometrial stromal cells (EuESCs) from adenomyosis (AM) patients and to provide a new insight into the disease mechanisms. The gene expression profiles in adenomyotic EuESCs (A-EuESCs) and normal ESCs (N-ESCs) were analyzed by RNA-sequencing (RNA-Seq) and validated by quantitative reverse transcription-polymerase chain reaction (qRT-PCR). Gene Ontology (GO) and Kyoto Encyclopedia of Genes and Genomes (KEGG) pathways enrichment analyses were performed to obtain insights into the functions of DEGs. The protein-protein interaction (PPI) network was constructed using the STRING database and visualized by Cytoscape software, and their hub genes were identified. A total of 458 up-/363 down-regulated genes were identified in A-EuESCs versus N-ESCs. The GO enrichment analysis showed that these genes were significantly enriched in calcium-dependent cell-cell adhesion. The most significant term of the KEGG pathway analysis was cytokine-cytokine receptor interaction. There were 145 nodes in the PPI network of the 157 DEGs, which were identified in significant enrichment pathway by the KEGG pathway analysis in N-ESCs and A-EuESCs. The PPI network revealed that IL-6 was a central hub gene. Besides, IL-6 was found as a central hub gene in the pro-inflammatory/chemotactic subnetwork, and EGF was noted as a central hub gene in the angiogenesis subnetwork. Our study indicated the alterations of transcriptomic profiles in A-EuESCs and provided new insights into the pathogenesis of AM. The A-EuESCs in women with AM have fundamental abnormalities that may predispose to pro-invasion/migration and angiogenesis.
Keywords: Adenomyosis; RNA sequencing; angiogenesis; chemokines; eutopic endometrial stromal cells; inflammatory cytokines; transcriptome.
Conflict of interest statement
No potential conflict of interest was reported by the author(s).
Figures


Similar articles
-
Transcriptome sequencing of adenomyosis eutopic endometrium: A new insight into its pathophysiology.J Cell Mol Med. 2019 Dec;23(12):8381-8391. doi: 10.1111/jcmm.14718. Epub 2019 Oct 1. J Cell Mol Med. 2019. PMID: 31576674 Free PMC article.
-
Quercetin Inhibits Adenomyosis by Attenuating Cell Proliferation, Migration and Invasion of Ectopic Endometrial Stromal Cells.Drug Des Devel Ther. 2020 Sep 21;14:3815-3826. doi: 10.2147/DDDT.S265066. eCollection 2020. Drug Des Devel Ther. 2020. PMID: 33061289 Free PMC article.
-
Bioinformatics analyses of gene expression profile identify key genes and functional pathways involved in cutaneous lupus erythematosus.Clin Rheumatol. 2022 Feb;41(2):437-452. doi: 10.1007/s10067-021-05913-2. Epub 2021 Sep 23. Clin Rheumatol. 2022. PMID: 34553293
-
Study on differentially expressed genes and participating pathways of ectopic endometrium in adenomyosis patients with different data sets.Genomics. 2023 May;115(3):110619. doi: 10.1016/j.ygeno.2023.110619. Epub 2023 Apr 3. Genomics. 2023. PMID: 37019419
-
Whole Transcriptomic Analysis of Key Genes and Signaling Pathways in Endogenous ARDS.Dis Markers. 2022 Oct 4;2022:1614208. doi: 10.1155/2022/1614208. eCollection 2022. Dis Markers. 2022. PMID: 36246560 Free PMC article.
Cited by
-
Understanding the Molecular Landscape of Endometriosis: A Bioinformatics Approach to Uncover Signaling Pathways and Hub Genes.Iran J Pharm Res. 2024 Apr 6;23(1):e144266. doi: 10.5812/ijpr-144266. eCollection 2024 Jan-Dec. Iran J Pharm Res. 2024. PMID: 39108650 Free PMC article.
-
Phenotypic heterogeneity in adenomyosis: internal and external subtypes.Arch Gynecol Obstet. 2025 Aug 31. doi: 10.1007/s00404-025-08166-5. Online ahead of print. Arch Gynecol Obstet. 2025. PMID: 40886209
-
Cell adhesion function was altered during the seasonal regression of the seminiferous epithelium in the mink species Neovison vison.J Anim Sci. 2023 Jan 3;101:skad190. doi: 10.1093/jas/skad190. J Anim Sci. 2023. PMID: 37282598 Free PMC article.
-
Endometrial Inflammation and Impaired Spontaneous Decidualization: Insights into the Pathogenesis of Adenomyosis.Int J Environ Res Public Health. 2023 Feb 20;20(4):3762. doi: 10.3390/ijerph20043762. Int J Environ Res Public Health. 2023. PMID: 36834456 Free PMC article. Review.
-
From Invaginating Site to Deep Lesion: Spatial Transcriptomics Unravels Ectopic Endometrial Penetration Features in Adenomyosis.Adv Sci (Weinh). 2025 May;12(20):e2411752. doi: 10.1002/advs.202411752. Epub 2025 Apr 7. Adv Sci (Weinh). 2025. PMID: 40190183 Free PMC article.
References
-
- Benetti-Pinto CL, Mira TAA, Yela DA, et al. Pharmacological treatment for symptomatic adenomyosis: a systematic review. Rev Bras Ginecol Obstet. 2019;41(9):564–574. - PubMed
-
- Struble J, Reid S, Bedaiwy MA.. Adenomyosis: a clinical review of a challenging gynecologic condition. J Minim Invasive Gynecol. 2016;23(2):164–185. - PubMed
-
- Chapron C, Vannuccini S, Santulli P, et al. Diagnosing adenomyosis: an integrated clinical and imaging approach. Hum Reprod Update. 2020;26(3):392–411. - PubMed
MeSH terms
Substances
LinkOut - more resources
Full Text Sources
Other Literature Sources
Molecular Biology Databases