. 2022 May 23;7(10):e158380.
doi: 10.1172/jci.insight.158380.

Bap1/SMN axis in Dpp4+ skeletal muscle mesenchymal cells regulates the neuromuscular system

Affiliations

Bap1/SMN axis in Dpp4+ skeletal muscle mesenchymal cells regulates the neuromuscular system

Ji-Hoon Kim et al. JCI Insight. .

Abstract

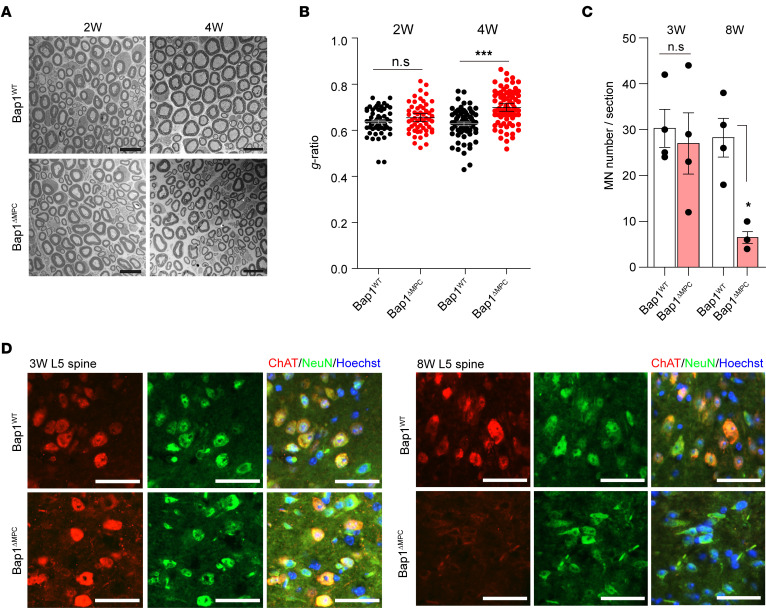
The survival of motor neuron (SMN) protein is a major component of the pre-mRNA splicing machinery and is required for RNA metabolism. Although SMN has been considered a fundamental gene for the central nervous system, due to its relationship with neuromuscular diseases, such as spinal muscular atrophy, recent studies have also revealed the requirement of SMN in non-neuronal cells in the peripheral regions. Here, we report that the fibro-adipogenic progenitor subpopulation expressing Dpp4 (Dpp4+ FAPs) is required for the neuromuscular system. Furthermore, we also reveal that BRCA1-associated protein-1 (Bap1) is crucial for the stabilization of SMN in FAPs by preventing its ubiquitination-dependent degradation. Inactivation of Bap1 in FAPs decreased SMN levels and accompanied degeneration of the neuromuscular junction, leading to loss of motor neurons and muscle atrophy. Overexpression of the ubiquitination-resistant SMN variant, SMNK186R, in Bap1-null FAPs completely prevented neuromuscular degeneration. In addition, transplantation of Dpp4+ FAPs, but not Dpp4- FAPs, completely rescued neuromuscular defects. Our data reveal the crucial role of Bap1-mediated SMN stabilization in Dpp4+ FAPs for the neuromuscular system and provide the possibility of cell-based therapeutics to treat neuromuscular diseases.

Keywords: Cell Biology; Mouse models; Muscle; Muscle Biology; Neurodegeneration.


Figures

Figure 1
Figure 1. Severe muscular atrophy in Bap1ΔMPC mice.
(A) Gross morphology of tibialis anterior (TA), gastrocnemius (GA), quadriceps (Q), and triceps (Tri) muscles from 19-month-old Bap1WT and Bap1ΔMPC mice. (B) Representative IHC staining images of laminin. (C) Morphometric quantifications of CSA of TA and GA myofibers from Bap1WT and Bap1ΔMPC mice. (D) Quantification of myofiber numbers in whole TA and GA. (E) Representative IHC staining images of TA muscles of 1-, 3-, and 8-week-old Bap1WT or Bap1ΔMPC mice. (F) Morphometric quantifications of CSA of TA muscles. n = 4 animals per group; mean ± SEM; Mann-Whitney U test; *P < 0.05, **P < 0.01. Scale bars: 100 μm (A, B, and E).
Figure 2
Figure 2. Impaired motor functions and NMJs in Bap1ΔMPC mice.
(A) The score of negative geotaxis test (38). (B and C) hind limb clasping time (85) (B) and immobility time (89) (C) during tail suspension test of 3-week-old Bap1WT and Bap1ΔMPC mice. n = 5 animals per group; mean ± SEM; Mann-Whitney U test; *P < 0.05, ***P < 0.001. (D) Representative captures of Bap1WT and Bap1ΔMPC mice during tail suspension test. Arrow indicates the hind limb clasping. (E and F) Representative graph data (E) and quantifications of amplitude and latency (F) of CMAP from 1-week-old GA muscles of Bap1WT and Bap1ΔMPC mice. (G) Confocal images for BTX and neurofilament immunofluorescence in TA muscles. White arrowheads and arrows indicate swelling of neurofilament and denervation, respectively. (H) Relative mRNA expressions of each AChR subunit in TA muscles. (F and H) n = 4 animals per group; data are mean ± SEM; Mann-Whitney U test; *P < 0.05, **P < 0.01, ***P < 0.001. Scale bars: 2 cm (D) and 20 μm (G).
Figure 3
Figure 3. Loss of motor neurons in Bap1ΔMPC mice.
(A) Representative electron microscopy images of myelinated axons in sciatic nerve cross sections from 2- (left panels) or 4-week-old (right panels) Bap1WT and Bap1ΔMPC mice. (B) The g-ratio of sciatic nerves from 2- or 4-week-old Bap1WT and Bap1ΔMPC mice. (C and D) Quantifications of motor neuron (MN) number (C) and representative IHC images of choline acetyltransferase (ChAT) and NeuN in the ventral horn regions of L5 spinal cord from 3- or 8-week-old Bap1WT and Bap1ΔMPC mice (D). n = 4 animals for each group (B and C); data are mean ± SEM; Mann-Whitney U test; *P < 0.05, ***P < 0.001. Scale bars: 10 μm (A) and 50 μm (D).
Figure 4
Figure 4. Prevention of neuromuscular degeneration by FAPs.
(A) Representative captures from tail suspension test of Bap1WT (Cont), PBS-treated (PBS), or FAP-transplanted (FAPs) Bap1ΔMPC mice. See also Supplemental Video 2. (B and C) Quantifications of hind limb clasping time (B) and immobility time (C) during tail suspension test for 5 minutes. (D) Representative graph data of CMAP. (E and F) Quantifications of amplitude (E) and latency (F) of CMAP measured in GA muscles of Cont, PBS, and FAPs mice. (G) Confocal images of BTX and NF immunofluorescence (top) and IHC images of TA muscles (bottom). (H) Percentages of the innervated NMJs. (I and J) Representative IHC images of ChAT and neurofilament (NF) in ventral horn regions of L5 spinal cord (I) and quantifications of MN number (J). (K) Quantification of CSA. n = 5 animals for each group (B, C, E, F, H, J, and K) (n = 6 animals in J); data are mean ± SEM; Tukey’s pairwise comparison test after 1-way ANOVA; *P < 0.05, **P < 0.01, ***P < 0.001. Scale bars: 2 cm (A), 20 μm (G, top), 100 μm (G, bottom), and 50 μm (I).
Figure 5
Figure 5. Maintenance of the neuromuscular system by FAPs.
(A) Experimental scheme of FAPs’ transplantation. FAPs from hind limb muscles of 1.5-week-old Rosa-CreER Bap1fl/fl mice were transplanted into TA and GA muscles of 1.5-week-old Bap1ΔMPC mice. Eight weeks after transplantation, the transplanted mice were orally administered with tamoxifen (Tmx) for 3 consecutive days. (B and C) Tail suspension test was performed at the indicated weeks after Tmx administration. Representative captures of tail suspension tests (B). Arrow indicates the hind limb clasping. See also Supplemental Video 3. Quantification of immobility time during tail suspension test for 5 minutes (C). n = 5 animals for each group; data are mean ± SEM; Tukey’s pairwise comparison test after 1-way ANOVA; *P < 0.05, **P < 0.01. (DG) Histological analyses were performed at the indicated weeks after Tmx administration. Representative confocal images of NMJs (D) and quantification of innervated NMJs (E). Representative IHC images of ChAT (F) and quantifications of MNs (G) in L5 spinal cords. (H) Representative IHC staining images of TA muscles. (I) Quantification of CSA in TA muscles. (E, G, and I) n = 5 animals for each group; data are mean ± SEM; unpaired t test; **P < 0.01, ***P < 0.001. Scale bars: 2 cm (B), 25 μm (D), 50 μm (F), and 100 μm (H).
Figure 6
Figure 6. Identification of the neuroprotective Dpp4+ subpopulation within FAPs.
(A) Uniform manifold approximation and projection (UMAP) plot showing distinct subpopulations (Dpp4+ or Cxcl14+) within Bap1WT versus Bap1ΔMPC FAPs. (B) Heatmap of top 100 differentially expressed genes in Bap1WT versus Bap1ΔMPC FAPs. (C) Heatmap showing expression of marker genes used to distinguish the 2 subpopulations in each cluster. (D) GO analysis using statistical overrepresentation test on DEGs selected from comparing Bap1WT versus Bap1ΔMPC FAPs in each subpopulation. (E) Representative FACS plots of Dpp4+ versus Dpp4 FAPs isolated from 4-week-old tdTomato reporter mice. (F) Quantification of immobility time during tail suspension test. Bap1ΔMPC mice transplanted with PBS, Dpp4+ FAPs, or Dpp4 FAPs were compared with Bap1WT mice. n = 5 animals for each group; data are mean ± SEM; Tukey’s pairwise comparison test after 1-way ANOVA; **P < 0.01. (G and H) Representative IHC images of ChAT (scale bars: 50 μm) (G) and quantifications of MN number stained with ChAT on the ventral horn region of L5 spinal cord in Dpp4+ FAP– or Dpp4 FAP–transplanted Bap1ΔMPC mice (H). n = 5 animals for each group. Mean ± SEM; unpaired t test; ***P < 0.001.
Figure 7
Figure 7. Deubiquitination of SMN by Bap1.
(A) Relative expression of SMN in FAPs from hind limb muscles of 1.5-week-old Bap1WT and Bap1ΔMPC mice. Gapdh and b-actin were used for normalization in quantitative PCR analysis. n = 4 animals for each group; Mann-Whitney U test; data are mean ± SEM. (B) Immunoblot of Bap1 and SMN in FAPs from 4-week-old Bap1WT and Bap1ΔMPC mice. (C) Immunoblot of Bap1 and SMN after immunoprecipitation (IP) analysis. IP was performed with pre-immune IgG, anti-Bap1, or anti-SMN antibodies. Each sample was blotted with each indicated antibody. (D) Ubiquitination assay of SMN following BAP1 overexpression. Flag-tagged BAP1 was expressed in HEK293T cells with HA-Ubiquitin (HA-Ub) and HisMax-tagged SMN (His-SMN). Cell lysates were subjected to pull-down assays with NTA resins followed by immunoblot. (E) Ubiquitination assay of SMN following BAP1 or BAP1C91S overexpression. HEK293T cells expressing Flag-tagged BAP1 or its C91S mutant were subjected to IP with anti-SMN antibody. After IP, each sample was blotted with each indicated antibody. (F) Ubiquitination assay of SMN and its lysine-substitution variants. HisMax-tagged variants (K41R, K51R, or K186R) were expressed in HEK293T cells with or without HA-Ub. Cell lysates were subjected to pull-down assays with NTA resins followed by immunoblot with each indicated antibody. (G) Immunoblot of SMN in Bap1WT or Bap1ΔMPC FAPs transduced with lentiviral vectors containing His-tagged SMNWT or SMNK186R. Samples were blotted with each indicated antibody. (H) Immunoblot analysis of SMN protein half-life. Bap1ΔMPC FAPs transduced with lentiviral vectors containing His-tagged SMN or its K186R mutant were subjected to immunoblot with indicated antibodies. Cells were incubated with cycloheximide (CHX) for the indicated times. (I) A schematic model for deubiquitination of SMN1 by BAP1. (D, F, and G) For MG132 treatment, cells were incubated with 10 μM MG132 for 4 hours before the preparation of cell lysates.
Figure 8
Figure 8. Rescue of Bap1ΔMPC mice by SMNK186R-expressing FAPs.
(A) Representative captures of hind limb clasping during tail suspension test. See also Supplemental Video 5. (B) Quantification of immobility time during tail suspension test for 5 minutes. (C) Representative graph data of CMAP. (D and E) Quantification of amplitude (D) and latency (E) of CMAP on GA muscles. (F) Representative confocal images for BTX and NF (F, top) and IHC staining (F, bottom) of TA muscles. (G) Quantification of innervated NMJs. (H) Representative images of ChAT and NeuN in the ventral horn of L5 spinal cord. (I) Quantification of the number of MNs in L5 spinal cord. (J) Quantification of CSA in TA muscles. (B, D, E, G, I, and J) n = 5 animals for each group; data are mean ± SEM; Tukey’s pairwise comparison test after 1-way ANOVA; *P < 0.05, **P < 0.01, ***P < 0.001. (AJ) tail suspension tests, CMAP measure, and histological analyses were performed at 8 or 10 weeks after transplantation. Scale bars: 2 cm (A), 25 μm (F, top), 100 μm (F, bottom), 50 μm (H).

Similar articles

Cited by

References

    1. Lefebvre S, et al. Identification and characterization of a spinal muscular atrophy-determining gene. Cell. 1995;80(1):155–165. doi: 10.1016/0092-8674(95)90460-3. - DOI - PubMed
    1. Park GH, et al. Reduced survival of motor neuron (SMN) protein in motor neuronal progenitors functions cell autonomously to cause spinal muscular atrophy in model mice expressing the human centromeric (SMN2) gene. J Neurosci. 2010;30(36):12005–12019. doi: 10.1523/JNEUROSCI.2208-10.2010. - DOI - PMC - PubMed
    1. Besse A, et al. AAV9-mediated expression of SMN restricted to neurons does not rescue the spinal muscular atrophy phenotype in mice. Mol Ther. 2020;28(8):1887–1901. doi: 10.1016/j.ymthe.2020.05.011. - DOI - PMC - PubMed
    1. Passini MA, et al. CNS-targeted gene therapy improves survival and motor function in a mouse model of spinal muscular atrophy. J Clin Invest. 2010;120(4):1253–1264. doi: 10.1172/JCI41615. - DOI - PMC - PubMed
    1. Gogliotti RG, et al. Motor neuron rescue in spinal muscular atrophy mice demonstrates that sensory-motor defects are a consequence, not a cause, of motor neuron dysfunction. J Neurosci. 2012;32(11):3818–3829. doi: 10.1523/JNEUROSCI.5775-11.2012. - DOI - PMC - PubMed

Publication types

MeSH terms