

The impact of phosphorylated PTEN at threonine 366 on cortical connectivity and behaviour
- PMID: 35603900
- PMCID: PMC10233299
- DOI: 10.1093/brain/awac188
The impact of phosphorylated PTEN at threonine 366 on cortical connectivity and behaviour
Abstract
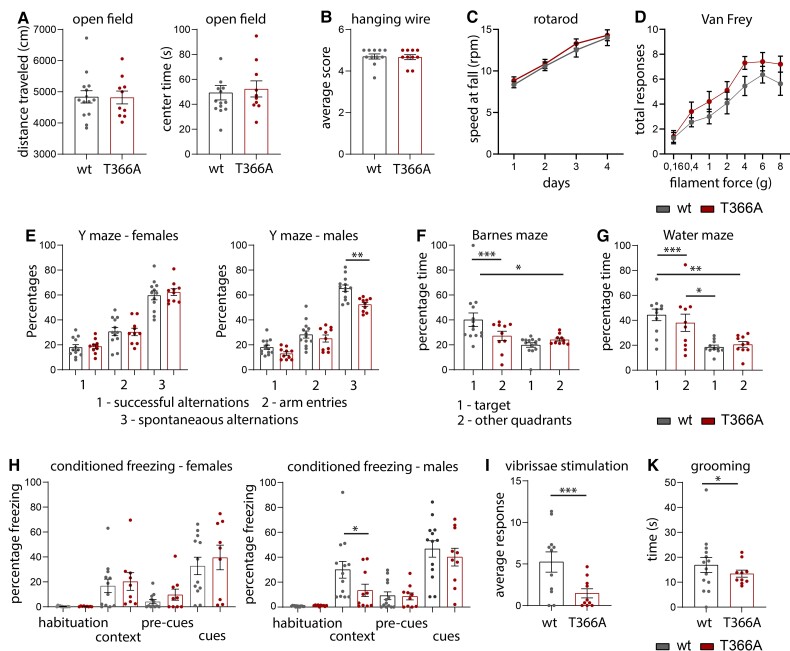
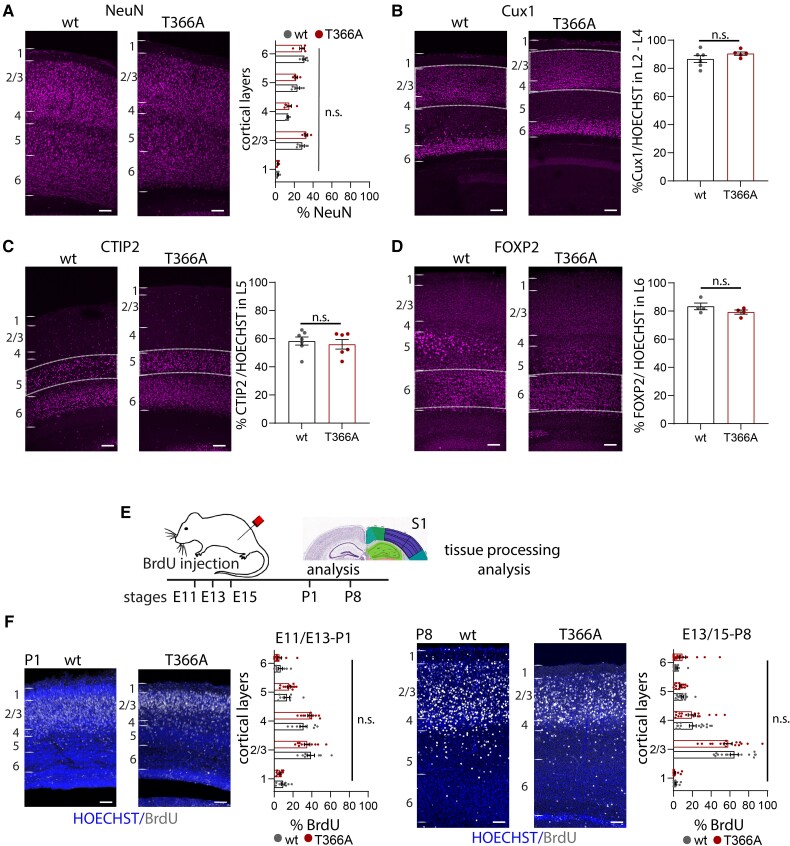
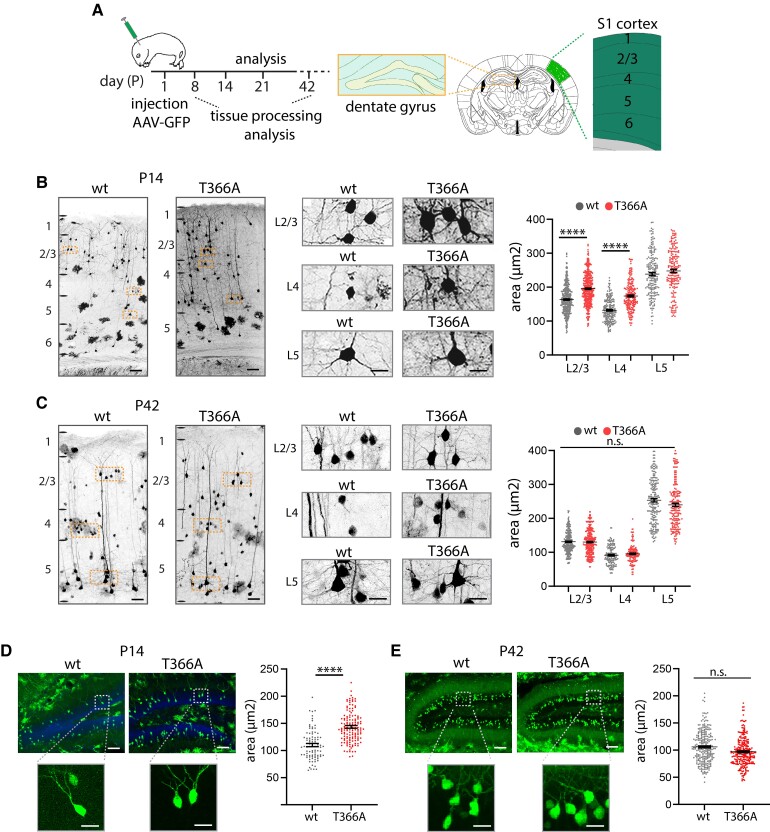
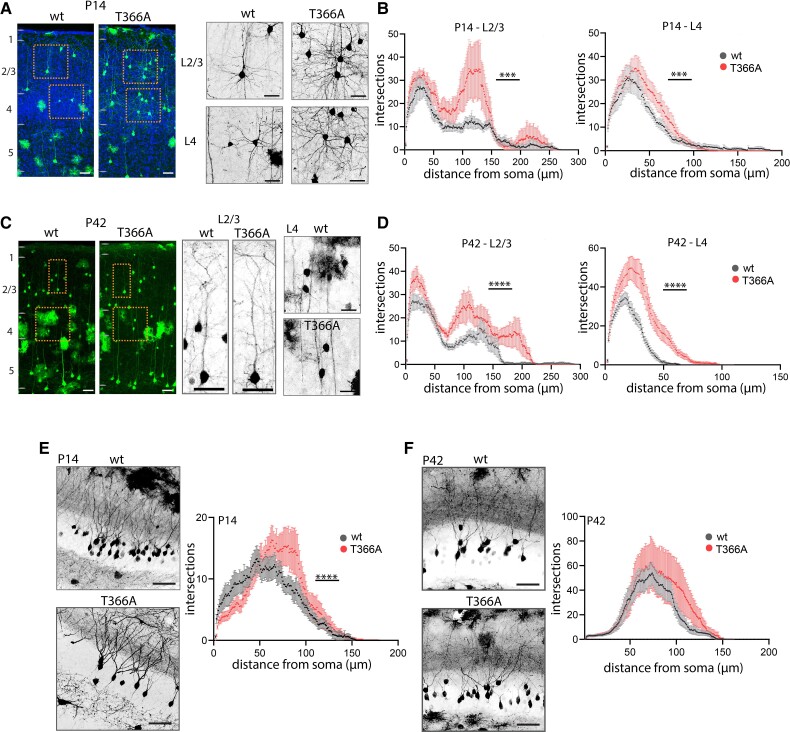
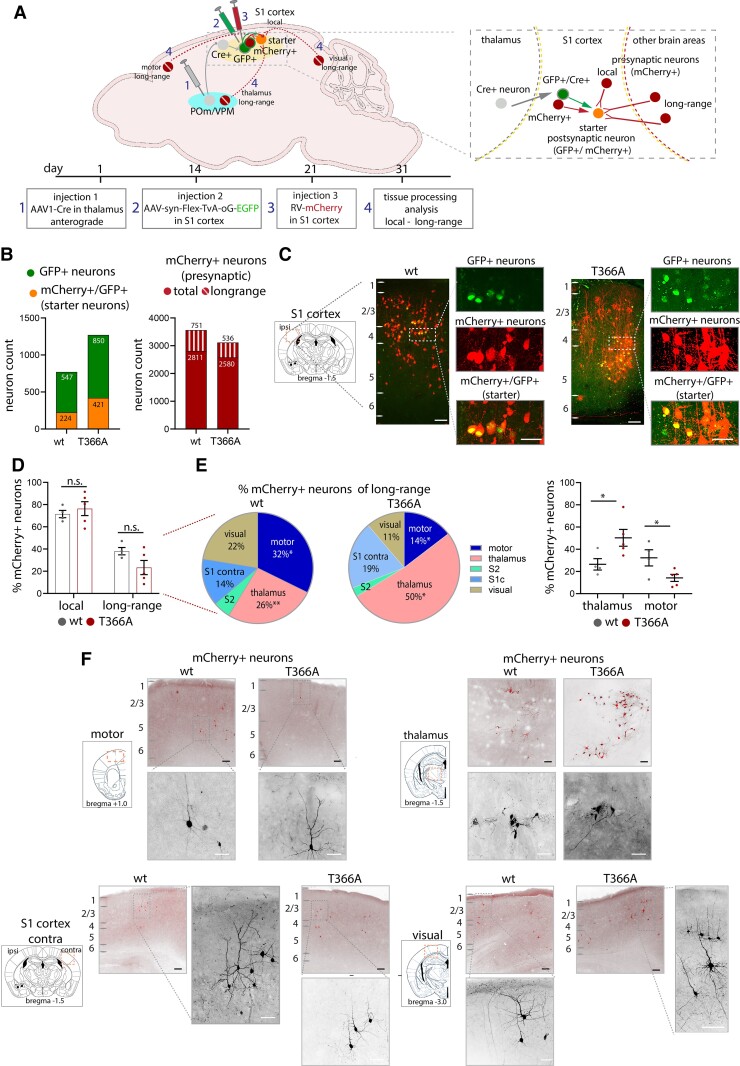
The lipid phosphatase PTEN (phosphatase and tensin homologue on chromosome 10) is a key tumour suppressor gene and an important regulator of neuronal signalling. PTEN mutations have been identified in patients with autism spectrum disorders, characterized by macrocephaly, impaired social interactions and communication, repetitive behaviour, intellectual disability, and epilepsy. PTEN enzymatic activity is regulated by a cluster of phosphorylation sites at the C-terminus of the protein. Here, we focused on the role of PTEN T366 phosphorylation and generated a knock-in mouse line in which Pten T366 was substituted with alanine (PtenT366A/T366A). We identify that phosphorylation of PTEN at T366 controls neuron size and connectivity of brain circuits involved in sensory processing. We show in behavioural tests that PtenT366/T366A mice exhibit cognitive deficits and selective sensory impairments, with significant differences in male individuals. We identify restricted cellular overgrowth of cortical neurons in PtenT366A/T366A brains, linked to increases in both dendritic arborization and soma size. In a combinatorial approach of anterograde and retrograde monosynaptic tracing using rabies virus, we characterize differences in connectivity to the primary somatosensory cortex of PtenT366A/T366A brains, with imbalances in long-range cortico-cortical input to neurons. We conclude that phosphorylation of PTEN at T366 controls neuron size and connectivity of brain circuits involved in sensory processing and propose that PTEN T366 signalling may account for a subset of autism-related functions of PTEN.
Keywords: PTEN; cognitive behaviour; cortical connectivity; developmental disorders; neuronal morphology.
© The Author(s) 2022. Published by Oxford University Press on behalf of the Guarantors of Brain. All rights reserved. For permissions, please e-mail: journals.permissions@oup.com.
Conflict of interest statement
The authors report no competing interests.
Figures
Comment in
-
Loss of PTEN phosphorylation via single point mutation alters cortical connectivity and behaviour.Brain. 2022 Oct 21;145(10):3343-3344. doi: 10.1093/brain/awac350. Brain. 2022. PMID: 36148582 Free PMC article.
Similar articles
-
The integral role of PTEN in brain function: from neurogenesis to synaptic plasticity and social behavior.Acta Neurobiol Exp (Wars). 2025 Jan 14;84(4):309-318. doi: 10.55782/ane-2024-2657. Acta Neurobiol Exp (Wars). 2025. PMID: 39812527 Review.
-
PTEN Regulates Dendritic Arborization by Decreasing Microtubule Polymerization Rate.J Neurosci. 2022 Mar 9;42(10):1945-1957. doi: 10.1523/JNEUROSCI.1835-21.2022. Epub 2022 Jan 31. J Neurosci. 2022. PMID: 35101965 Free PMC article.
-
Balancing Proliferation and Connectivity in PTEN-associated Autism Spectrum Disorder.Neurotherapeutics. 2015 Jul;12(3):609-19. doi: 10.1007/s13311-015-0356-8. Neurotherapeutics. 2015. PMID: 25916396 Free PMC article. Review.
-
Genetic Suppression of mTOR Rescues Synaptic and Social Behavioral Abnormalities in a Mouse Model of Pten Haploinsufficiency.Autism Res. 2019 Oct;12(10):1463-1471. doi: 10.1002/aur.2186. Epub 2019 Aug 23. Autism Res. 2019. PMID: 31441226 Free PMC article.
-
Pten loss results in inappropriate excitatory connectivity.Mol Psychiatry. 2019 Nov;24(11):1627-1640. doi: 10.1038/s41380-019-0412-6. Epub 2019 Apr 9. Mol Psychiatry. 2019. PMID: 30967683 Free PMC article.
Cited by
-
Oxidative stress and neuroimmune proteins in a mouse model of autism.Cell Stress Chaperones. 2023 Mar;28(2):201-217. doi: 10.1007/s12192-023-01331-2. Epub 2023 Feb 16. Cell Stress Chaperones. 2023. PMID: 36795226 Free PMC article.
-
Loss of PTEN phosphorylation via single point mutation alters cortical connectivity and behaviour.Brain. 2022 Oct 21;145(10):3343-3344. doi: 10.1093/brain/awac350. Brain. 2022. PMID: 36148582 Free PMC article.
-
Rapamycin improves social and stereotypic behavior abnormalities induced by pre-mitotic neuronal subset specific Pten deletion.Genes Brain Behav. 2023 Aug;22(4):e12854. doi: 10.1111/gbb.12854. Epub 2023 Jun 28. Genes Brain Behav. 2023. PMID: 37376966 Free PMC article.
References
-
- Li DM, Sun H. TEP1, encoded by a candidate tumor suppressor locus, is a novel protein tyrosine phosphatase regulated by transforming growth factor beta. Cancer Res. 1997;57:2124–2129. - PubMed
-
- Li J, Yen C, Liaw D, et al. PTEN, a putative protein tyrosine phosphatase gene mutated in human brain, breast, and prostate cancer. Science. 1997;275:1943–1947. - PubMed
-
- Steck PA, Pershouse MA, Jasser SA, et al. Identification of a candidate tumour suppressor gene, MMAC1, at chromosome 10q23.3 that is mutated in multiple advanced cancers. Nat Genet. 1997;15:356–362. - PubMed
-
- Marsh DJ, Dahia PL, Zheng Z, et al. Germline mutations in PTEN are present in Bannayan-Zonana syndrome. Nat Genet. 1997;16:333–334. - PubMed
-
- Liaw D, Marsh DJ, Li J, et al. Germline mutations of the PTEN gene in Cowden disease, an inherited breast and thyroid cancer syndrome. Nat Genet. 1997;16:64–67. - PubMed
Publication types
MeSH terms
Substances
Grants and funding
LinkOut - more resources
Full Text Sources
Molecular Biology Databases
Research Materials
