. 2022 Aug 1;189(4):1943-1960.
doi: 10.1093/plphys/kiac244.

Metabolic control of arginine and ornithine levels paces the progression of leaf senescence

Affiliations

Metabolic control of arginine and ornithine levels paces the progression of leaf senescence

Daniela Liebsch et al. Plant Physiol. .

Abstract

Leaf senescence can be induced by stress or aging, sometimes in a synergistic manner. It is generally acknowledged that the ability to withstand senescence-inducing conditions can provide plants with stress resilience. Although the signaling and transcriptional networks responsible for a delayed senescence phenotype, often referred to as a functional stay-green trait, have been actively investigated, very little is known about the subsequent metabolic adjustments conferring this aptitude to survival. First, using the individually darkened leaf (IDL) experimental setup, we compared IDLs of wild-type (WT) Arabidopsis (Arabidopsis thaliana) to several stay-green contexts, that is IDLs of two functional stay-green mutant lines, oresara1-2 (ore1-2) and an allele of phytochrome-interacting factor 5 (pif5), as well as to leaves from a WT plant entirely darkened (DP). We provide compelling evidence that arginine and ornithine, which accumulate in all stay-green contexts-likely due to the lack of induction of amino acids (AAs) transport-can delay the progression of senescence by fueling the Krebs cycle or the production of polyamines (PAs). Secondly, we show that the conversion of putrescine to spermidine (SPD) is controlled in an age-dependent manner. Thirdly, we demonstrate that SPD represses senescence via interference with ethylene signaling by stabilizing the ETHYLENE BINDING FACTOR1 and 2 (EBF1/2) complex. Taken together, our results identify arginine and ornithine as central metabolites influencing the stress- and age-dependent progression of leaf senescence. We propose that the regulatory loop between the pace of the AA export and the progression of leaf senescence provides the plant with a mechanism to fine-tune the induction of cell death in leaves, which, if triggered unnecessarily, can impede nutrient remobilization and thus plant growth and survival.


Figures

Figure 1
Figure 1
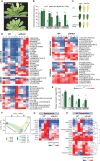
Phenotypic, metabolic, and transcriptomic characterization of pif5-621 during dark-induced senescence. A, Phenotype of the WT seg. and pif5-621 mutant after individually darkening single leaves (IDL) for 6 days. Background digitally removed to facilitate comparison. B, Chlorophyll content of Col-0 WT (WT), pif5-621, and the complemented pif5-621 PIF5g leaves in light, and after 6, 9, and 12 days of darkening treatment. *P < 0.05; **P < 0.01; ***P < 0.001 after Student’s t test with WT; n = 6 ±sd; colored asterisks highlight statistical differences between pif5-621 and pif5-621 PIF5g. C, Phenotype of IDLs of WT, pif5-621, and pif5-621 PIF5g line after 12 days of dark treatment. D, Relative metabolite levels in WT and pif5-621 leaves in light and after darkening treatment, where each metabolite's abundance is normalized to its maximum level detected within all samples. *P < 0.05; **P < 0.01; ***P < 0.001 after Student’s t test compared with WT; n = 4–5. D0 = light samples, D1, 3, 6, and 9 are samples from a darkening treatment of 1, 3, 6, or 9 days, respectively. For details, see Supplemental Dataset S1. E, Protein content. Significant differences between mutant and WT were assessed using a Student’s t test and are indicated as *P < 0.05, n = 4 ±se. F, PCA plot displaying component 1 versus component 2 and showing a conserved and divergent response pattern between WT IDL and pif5-621 IDL transcriptomes. G, Heatmaps for the normalized expression pattern of transcripts associated with senescence. H, HC analysis of transcripts coding for AAs transporters. For (G) and (H), statistically significant differences in expression are indicated according to adjusted P-values (limma), see Supplemental Material and Methods for details: *adj. P < 0.05; **adj. P < 0.01, and ***adj. P < 0.001. For detailed data, see Supplemental Datasets S4 and S5.
Figure 2
Figure 2
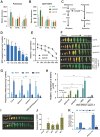
Contribution of arginine and ornithine to the production of PAs and energy metabolism. A, AA feeding experiments on leaf discs. Images of leaf discs were digitally extracted for comparison. Significance: Student’s t test with *P < 0.05, **P < 0.01; ***P < 0.001; n > 6 ±se. B, Simplified metabolic scheme leading to PAs, GABA, and TCA cycle intermediates production. Black arrow: enzymatic reaction, orange arrow: non-enzymatic reaction. C, Percentage of the 13C enrichment in the total pool of several metabolites in the metabolic vicinity of arginine (Arg) and ornithine (Orn) as shown in (B). Data were normalized to the mock treatment and compensated for the natural abundance of 13C; n = 3. Statistical significance: Student’s t test with *P < 0.05, **P < 0.01; ***P < 0.001. α-KG, α-ketoglutarate.
Figure 3
Figure 3
Endogenous SPD content decreases with leaf aging. Abundance of PUT (A) and SPD (B) in IDLs of WT, pif5-621, and ore1-2 across a 6-day time course. n = 3 ± sd. *P < 0.05, Student’s t test versus WT. C, Scheme illustrating biosynthesis of ethylene and SPD. Ethylene biosynthesis starts with the conversion of S-adenosyl-l-methione (SAM), which is converted from methionine by SAM synthase (SAMS), into 1-aminocyclopropane-1-carboxylic acid (ACC) by the enzyme ACC synthase (ACS). ACC can then be converted to the end product ethylene by ACC oxidase (ACO). SAM decarboxylase (SAMDC1/4) converts SAM into decarboxylated SAM (DcSAM). SPD is synthesized from PUT and DcSAM by SPDS (SPDS1/2). SPD is further metabolized to spermine by spermine synthase (SPMS). D, SPD content in the fourth leaf of WT (Col-0) at different developmental stages: 7-, 14-, 21-, 28-, 35-, and 42-day-old. Student’s t test, *P < 0.05, **P < 0.01; n = 3 ± sd. E, Transcript abundance of SPDS1 and SPDS2 in the fourth leaf across the same time course. n = 3 ± sd, and two technical replicates were performed. F, Senescence phenotype of spds1-2, spds2-2, VIGS-SPDS2/spds1-2, and WT plants. VIGS-SPDS2/spds1-2 plants were treated with 10 μM SPD. Rosette leaves detached from 45-day-old plants were arranged according to their age. G, PA contents in SPDS1/2 loss-of-function mutants. PAs were isolated from the fourth leaves of each line (30-day-old) and measured by HPLC. Bars represent mean ± sd (n = 3) (Student’s t test, *P < 0.05, **P < 0.01). H, RT-qPCR analysis of SAG12 expression. Bars represent mean ± sd (n = 3) (Student’s t test, *P < 0.05, **P < 0.01, ***P < 0.001). I, The senescence phenotype of SPDS1ox. Rosette leaves of 6.5-week-old Col-0 and SPDS1ox were detached and arranged according to their age. J, RT-qPCR analysis of SPDS1 expression in SPDS1ox lines. K, Determination of SPD contents in SPDS1ox plants as described in G. J and K: mean ± sd; n = 3; Student’s t test, *P < 0.05, **P < 0.01, ***P < 0.001.
Figure 4
Figure 4
SPD delays leaf senescence via antagonistically regulating ethylene pathway. A, EIN3 protein accumulation in 35S:EIN3-GFP/Col-0 plants upon treatment with SPD. A nonspecific band was used as a loading control in the CBB. B, SPD-induced EIN3 protein degradation depends on EBF1/2. 35S:EIN3-GFP/ein3 eil1 ebf1 ebf2 seedlings treated with SPD were used for protein extraction. C, EBF1/2 protein accumulation in 35S:EBF1/2-GFP/Col-0 plants upon treatment with SPD. D, The senescence phenotype of 45-day-old plants. E, Measurement of the chlorophyll contents. Error bars indicate sd (n = 24). F, RT-qPCR analysis of SAG12 expression. Error bars indicate sd (n = 3). G, Immunoblot assay of EIN3 protein accumulation. EIN3ox and ein3 eil1 were used as the positive and negative controls, respectively.
Figure 5
Figure 5
Model summarizing the metabolic regulation of the transcriptional module controlling the induction of leaf senescence in response to light stress and aging. For details, see text. Arg, arginine; Met, methionine; Orn, ornithine, SPM, spermine.

References

    1. Alcázar R, Altabella T, Marco F, Bortolotti C, Reymond M, Koncz C, Carrasco P, Tiburcio AF (2010) Polyamines: molecules with regulatory functions in plant abiotic stress tolerance. Planta 231: 1237–1249 - PubMed
    1. Araújo WL, Ishizaki K, Nunes-Nesi A, Larson TR, Tohge T, Krahnert I, Witt S, Obata T, Schauer N, Graham IA, et al. (2010) Identification of the 2-hydroxyglutarate and isovaleryl-CoA dehydrogenases as alternative electron donors linking lysine catabolism to the electron transport chain of Arabidopsis mitochondria. Plant Cell 22: 1549–1563 - PMC - PubMed
    1. Araújo WL, Ishizaki K, Nunes-Nesi A, Tohge T, Larson TR, Krahnert I, Balbo I, Witt S, Dörmann P, Graham IA, et al. (2011) Analysis of a range of catabolic mutants provides evidence that phytanoyl-coenzyme A does not act as a substrate of the electron-transfer flavoprotein/electron-transfer flavoprotein:ubiquinone oxidoreductase complex in Arabidopsis during dark-induced senescence. Plant Physiol 157: 55–69 - PMC - PubMed
    1. Baena-González E, Rolland F, Thevelein JM, Sheen J (2007) A central integrator of transcription networks in plant stress and energy signalling. Nature 448: 938–942 - PubMed
    1. Balazadeh S, Siddiqui H, Allu AD, Matallana‐Ramirez LP, Caldana C, Mehrnia M, Zanor M-I, Köhler B, Mueller‐Roeber B (2010) A gene regulatory network controlled by the NAC transcription factor ANAC092/AtNAC2/ORE1 during salt-promoted senescence. Plant J 62: 250–264 - PubMed

Publication types