. 2022 Aug;44(4):2243-2257.
doi: 10.1007/s11357-022-00589-1. Epub 2022 May 23.

Insulin-like growth factor I sensitization rejuvenates sleep patterns in old mice

Affiliations

Insulin-like growth factor I sensitization rejuvenates sleep patterns in old mice

Jonathan A Zegarra-Valdivia et al. Geroscience. 2022 Aug.

Abstract

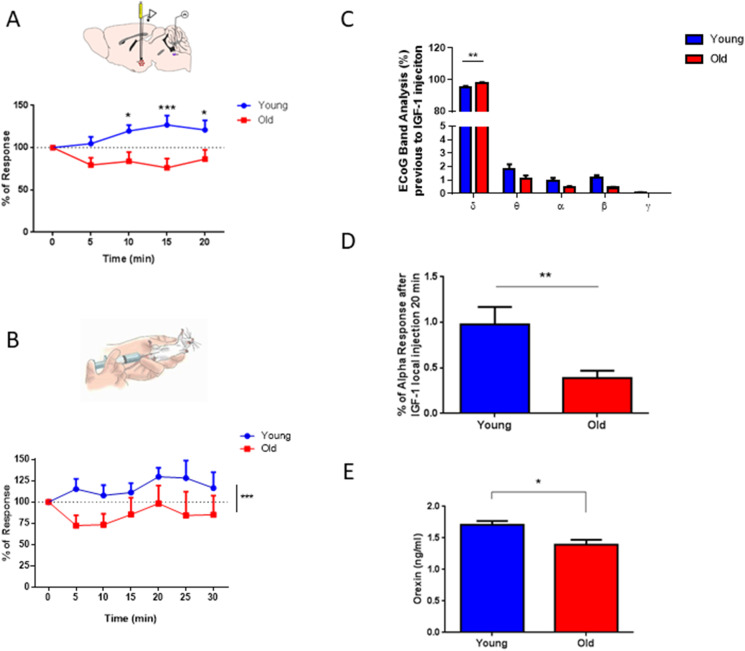
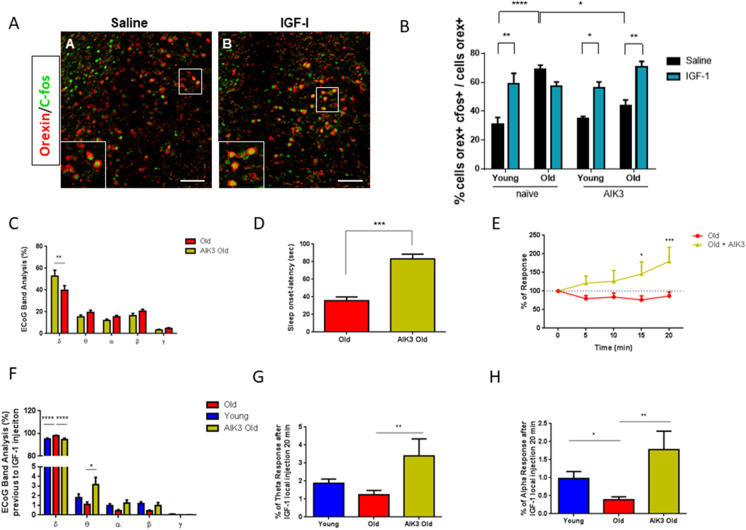
Sleep disturbances are common during aging. Compared to young animals, old mice show altered sleep structure, with changes in both slow and fast electrocorticographic (ECoG) activity and fewer transitions between sleep and wake stages. Insulin-like growth factor I (IGF-I), which is involved in adaptive changes during aging, was previously shown to increase ECoG activity in young mice and monkeys. Furthermore, IGF-I shapes sleep architecture by modulating the activity of mouse orexin neurons in the lateral hypothalamus (LH). We now report that both ECoG activation and excitation of orexin neurons by systemic IGF-I are abrogated in old mice. Moreover, orthodromical responses of LH neurons are facilitated by either systemic or local IGF-I in young mice, but not in old ones. As orexin neurons of old mice show dysregulated IGF-I receptor (IGF-IR) expression, suggesting disturbed IGF-I sensitivity, we treated old mice with AIK3a305, a novel IGF-IR sensitizer, and observed restored responses to IGF-I and rejuvenation of sleep patterns. Thus, disturbed sleep structure in aging mice may be related to impaired IGF-I signaling onto orexin neurons, reflecting a broader loss of IGF-I activity in the aged mouse brain.

Keywords: Aging; Cortical activation; IGF-I; Orexinergic neurons; Rejuvenation; Sleep.


Conflict of interest statement

MV and ITA have shares in Allinky BioPharma, manufacturer of AIK3a.

Figures

Fig. 1
Fig. 1
Altered sleep structure in old mice. A Diagram of the intracranial localization of the electrodes in S1cortex for ECoG recording in freely-moving mice; left hemisphere has the reference electrode in all cases. B–F Sleep architecture during the light and dark period (“zeitgeber” time: ZT 1–19) determined by δ (C), θ (D), α (E), β (F), and γ (G) oscillations in old (red line) and young mice (blue line). Old mice display lower δ activity, as compared to young mice, and an increase in fast-wave activity (young = 8, old = 4; male mice only, two-way ANOVA – δ: F(1,94) = 23.98, ****p < 0.0001; θ: F(1,94) = 19.21, ****p < 0.0001, α: F(1,94) = 15.91, ***p = 0.0001; β: F(1,94) = 22.41, ****p < 0.0001, and γ time factor: F(9,94) = 2.322, *p = 0.0209, interaction: F(9,94) = 3.452, **p = 0.0010; and Sidak’s multiple comparison test; *p < 0.05, **p < 0.01, ***p < 0.001, ****p < 0.0001). G Average changes in ECoG bands during the passive phase (ZT 9–11) display a significant reduction in the δ band in old mice (***p < 0.0004, young = 13, old = 8, sex balanced, two-way ANOVA, time factor: F(4,95) = 98.37, ****p < 0.0001, interaction: F(4,95) = 6.761, ****p < 0.0001 and Sidak’s multiple comparison test). H Latency to sleep onset was markedly reduced in old mice (**p < 0.0099, young = 11, 71.27 ± 10.97; old = 8, 35.64 ± 4.255; sex balanced, unpaired t test, t = 3.027, df = 12.75, and Welch’s correction)
Fig. 2
Fig. 2
Loss of sensitivity to systemic IGF-I in aged mice. A Average changes in ECoG bands 20 to 60 min after administration of IGF-I (1 µg/kg, ip) were compared with average baseline activity. B ECoG response to IGF-I (ip) is lost in theta and alpha bands in old mice (> 18 months; n = 7), compared to young ones (3–4 months, n = 10). Differences between young and old mice injected with IGF-I are maximal within the frequency range of delta and beta waves (*p < 0.05; **p < 0.01; ***p < 0.001, one-way ANOVA)
Fig. 3
Fig. 3
Systemic IGF-I does not promote the expression of c-fos in orexin neurons of old mice. A–D Representative photomicrographs of double-labeled c-fos+/orexin+ cells in young and old mice after saline and IGF-I administration at ZT9. E Young mice show increased c-fos expression in orexin neurons after ip injection of IGF-I (1 µg/kg), while old ones show decreased expression (young saline = 6; 31.07 ± 3.762; young IGF-I = 6; 58.88 ± 7.4). Old mice treated with saline (n = 6; 68.82 ± 3.17) show increased activation of c-fos as compared to young ones, whereas old mice treated with IGF-I (n = 6, 57.31 ± 3.056) do not show an increase response over basal levels (old saline). Similarly, old mice treated with IGF-I show increased c-fos immunoreactivity as compared to young saline mice (**p < 001, sex balanced). Two-way repeated measure ANOVA, interaction treatment × group factor: F(1,5) = 54.05; ***p = 0.0007 and Sidak’s multiple comparison test. ANOVA. F Quantification of c-fos expression in non-orexinergic cells in the LH. Young mice show increased c-fos expression in non-orexinergic cells after IGF-I administration (n = 4 per group, saline = 33.71 ± 5.591; IGF-I = 74.58 ± 2.498; **p < 0 05, sex balanced, two-way ANOVA, and Sidak’s multiple comparison test). Old saline mice display an increase in basal c-fos over young mice (n = 4 per group; saline = 69.03 ± 9.19; IGF-I = 60.68 ± 7.014; *p < 0146; sex balanced, two-way ANOVA, time factor: F(1,12) = 6.18; **p = 0.0027; interaction: F(1,12) = 14.16; *p = 0.0286, and Sidak’s multiple comparison test)
Fig. 4
Fig. 4
Lateral hypothalamic neurons lose sensitivity to IGF-I in old mice. A Right cartoon: a stimulating electrode was placed in the LC and a recording electrode in the PeF area at the lateral hypothalamus (LH). The area of the evoked potential elicited by LC stimulation increased in young, but not in old mice, in response to local application of IGF-I (at time 0; 10 μM, 0.1 μl). Time course of the area of the evoked potential expressed as a percentage of basal responses at time 0 (*p < 0.05 and ***p < 0.001 n = 13 per group; sex balanced, two-way repeated measure ANOVA, group factor: F(1,125) = 26.67, ***p < 0.0001, and Sidak’s multiple comparison test). B Intraperitoneal injection of IGF-I (1 μg/g, right cartoon) increased the response to LC stimulation in LH neurons of young but not old mice (***p = 0.0003; young = 9; old = 7; sex balanced, ordinary two-way ANOVA, group factor: F(1,98) = 12.46; ***p = 0.0006, and Sidak’s multiple comparison test). Time course as in previous panel. C Prior to local IGF-I administration, analysis of ECoG bands in anesthetized mice revealed an increased amount of δ waves in old mice (***p > 0.0001); no other differences were observed. Ordinary two-way ANOVA, time factor: F(4,144) = 18,429; ****p < 0.0001, interaction factor: F(4,144) = 6.328; ****p < 0.0001, and Sidak’s multiple comparison test. D ECoG band analysis 20 min after IGF-I injection indicated an increase of the α band that was larger in young mice (young = 19, 0.9772 ± 0.1918; old = 12, 0.388 ± 0.0816; sex balanced, unpaired t test, t = 2.827, df = 23.84, and Welch’s correction). E Levels of orexin in the hypothalamus were reduced in old mice (n = 6, 1.394 ± 0.0767) compared to young ones (n = 5, 1.707 ± 0.0607). *p = 0.0129; sex balanced, unpaired t test, t = 3.093, df = 9
Fig. 5
Fig. 5
Dysregulation of IGF-IR expression in orexin neurons of old mice. A Representative photomicrograph of the mouse hypothalamus showing staining of orexin neurons (red) in the PeF area of the lateral hypothalamus (LH) and IGF-IR (green). Bars are 10 µm. B Co-localization ratio of double-stained IGF-IR/orexin cells in young (0.1038 ± 0.0044) and old (0.0482 ± 0.0051) mice revealed greater levels of IGF-IR immunoreactivity in old mice (***p = 0.0001, young = 31 cells, 0.1069 ± 0.0552; old = 26 cells, 0.0482 ± 0.0051; male-only, unpaired t test, t = 8.151, df = 55). C Representative photomicrograph of combined in situ hybridization by RNAscope for IGF-IR mRNA (red) and orexin immunocytochemistry (green) in the mouse PeF area of the lateral hypothalamus (LH). Bars are 25 µm. Large white squares: magnifications detailing IGF-IR mRNA (red) signal from the smaller white squares showing both IGF-IR and orexin signal (green). D Quantification analysis showed that expression of IGF-IR mRNA was increased in orexin cells of old mice compared to young ones (young = 19 cells, 5.684 ± 0.892; old = 20 cells, 2.35 ± 0.4604; ***p < 0 .001, Mann–Whitney test, U = 70)
Fig. 6
Fig. 6
IGF-IR sensitization with AIK3a305 recovers orexin responses to IGF-I and rejuvenates ECG patterns in old mice. A Representative photomicrograph of orexin+ (red) and c-fos+ (green) cells under saline and IGF-I condition in old-AIK3 treated mice. B Quantification of double-stained c-fos+/orexin+ cells after AIK3 treatment shows a recovery of the c-fos response to IGF-I. Naïve group: young saline (n = 6; 31.07 ± 3.762); young IGF-I (n = 6; 58.88 ± 7.4); old saline (n = 6; 68.82 ± 3.17), old with IGF-I (n = 6, 57.31 ± 3.056). Mice treated with AIK3a305: young saline (n = 3; 34.77 ± 1.661); young IGF-I (n = 3; 56.32 ± 4.056); old saline (n = 3; 44.07 ± 3.776), and old with IGF-I (n = 3; 70.65 ± 3.945). Ordinary two-way and Tukey’s multiple comparison test. ANOVA, treatment condition: F(1,28) = 19.74, ***p = 0.0001; group condition: F(3,28) = 7.721, ***p = 0.0001; interaction: F(3,28) = 9.02, ***p = 0.0002. C Percentage of each ECoG frequency band during the passive phase [ZT 9–11) displays significant differences in the δ band in old-AIK3 treated mice compared to old untreated mice (**p = 0.0085, old + AIK3 = 14, old = 8, sex balanced, two-way ANOVA, time factor: F(4,100) = 60.01; ****p < 0.0001, interaction factor: F(4,100) = 3.33; *p = 0.0132, and Sidak’s multiple comparison test). D Treatment with AIK3 normalized sleep-onset latency (***p < 0 .001, n = 7 per group, old = 35.64 ± 4.255, old treated with AIK3 = 83.14 ± 5.358, unpaired t test, t = 6.942, df = 12). E Old mice treated with AIK3a305 recovered responses to local application of IGF-I in LH responses to LC stimulation (10 μM, 0.1 μl). Time course showing the evoked potential elicited by electrical stimulation of the LC in both experimental groups expressed as a percentage of basal responses at time 0 (n = 13 per group; sex balanced; two-way repeated measure ANOVA, interaction group × time: F(4,48) = 2.631, *p = 0.045, Sidak’s multiple comparison test at 15 min *p = 0.0109 and 20 min ***p = 0.0004). F Treatment of old mice with AIK3 rejuvenated the level of δ band in anesthetized mice. ECoG analysis was carried out before local IGF-I administration (***p > 0.0001). AIK3 old mice also display an increase of θ band (young = 19, old = 13, old AIK3 = 10, sex balanced, ordinary two-way ANOVA, ECoG factor: F(4,189) = 20,051, ****p < 0.0001, interaction: F(8,189) = 4.207, ****p < 0.0001; and Sidak’s multiple comparison test, δ band = ****p < 0.0001 and θ band = *p = 0.0308). G–H After 20 min of local IGF-I injection, ECoG band analysis reveals an increase of θ (G) and α (H) band in old-AIK3 treated mice (young = 19, old = 12, old AIK = 10, sex balanced, *p < 0.05; **p < 0.01; ***p < 0.001, one-way ANOVA, F(2,36) = 5.052, *p = 0.0116; and Kruskal–Wallis test (K-W = 10.43)), with Dunn’s multiple comparison test (old vs old AIK3 **p = 0.0065, young vs old *p = 0.039; respectively)

Similar articles

Cited by

References

    1. Mander BA, Winer JR, Walker MP. Sleep and human aging. Neuron. 2017;94:19–36. - PMC - PubMed
    1. Ju YE, Lucey BP, Holtzman DM. Sleep and Alzheimer disease pathology–a bidirectional relationship. Nat Rev Neurol. 2014;10:115–119. - PMC - PubMed
    1. Nixon JP, Mavanji V, Butterick TA, et al. Sleep disorders, obesity, and aging: the role of orexin. Ageing Res Rev. 2015;20:63–73. - PMC - PubMed
    1. Kenyon C. A conserved regulatory system for aging. Cell. 2001;105:165–168. - PubMed
    1. Zegarra-Valdivia JA, Santi A, Fernandez de Sevilla ME, et al 2019 Serum Insulin-like growth factor I deficiency associates to Alzheimer’s disease co-morbidities. J Alzheimers Dis - PubMed

Publication types