. 2022 Sep:122:215-221.
doi: 10.1016/j.ijid.2022.05.039. Epub 2022 May 20.

Cholera outbreaks in sub-Saharan Africa during 2010-2019: a descriptive analysis

Affiliations

Cholera outbreaks in sub-Saharan Africa during 2010-2019: a descriptive analysis

Qulu Zheng et al. Int J Infect Dis. 2022 Sep.

Abstract

Background: Cholera remains a public health threat but is inequitably distributed across sub-Saharan Africa. Lack of standardized reporting and inconsistent outbreak definitions limit our understanding of cholera outbreak epidemiology.

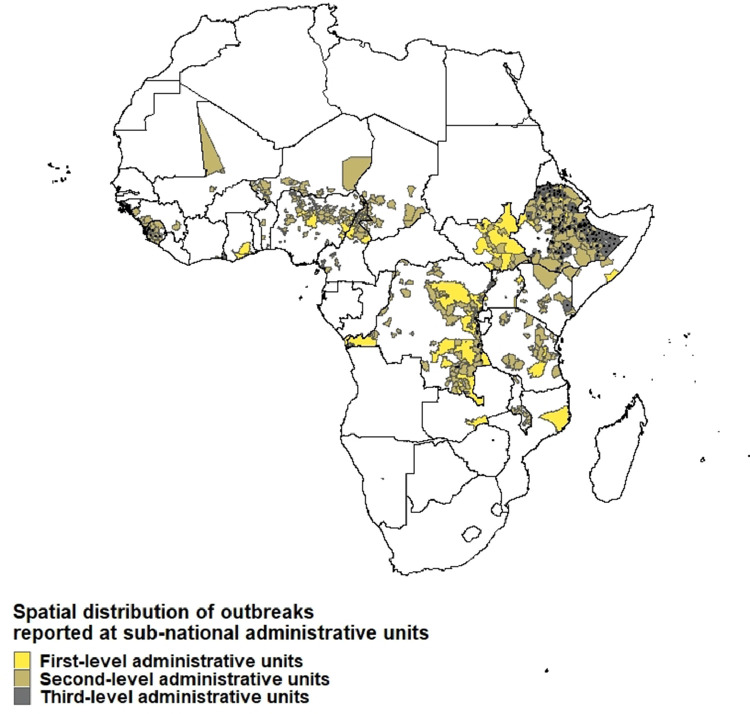
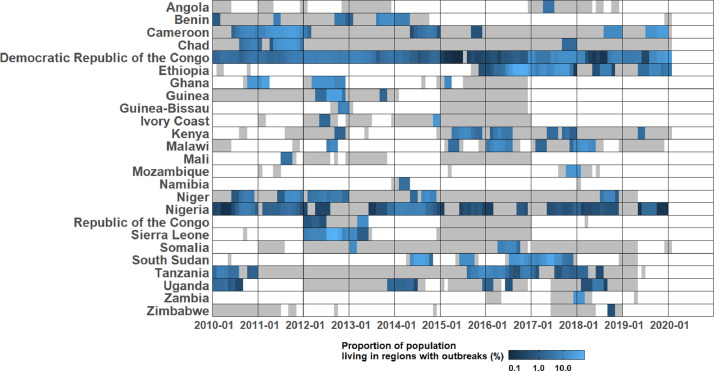
Methods: From a database of cholera incidence and mortality, we extracted data from sub-Saharan Africa and reconstructed outbreaks of suspected cholera starting in January 2010 to December 2019 based on location-specific average weekly incidence rate thresholds. We then described the distribution of key outbreak metrics.

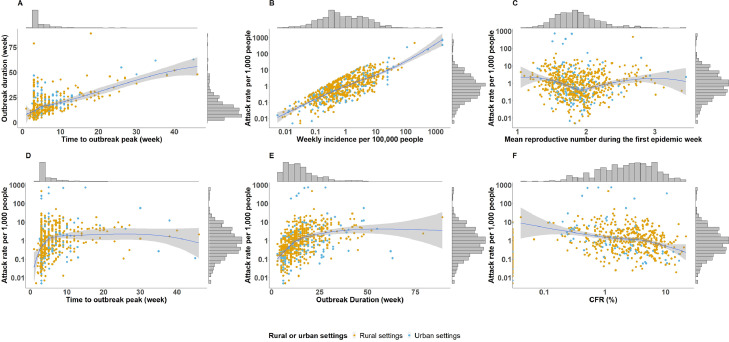
Results: We identified 999 suspected cholera outbreaks in 744 regions across 25 sub-Saharan African countries. The outbreak periods accounted for 1.8 billion person-months (2% of the total during this period) from January 2010 to January 2020. Among 692 outbreaks reported from second-level administrative units (e.g., districts), the median attack rate was 0.8 per 1000 people (interquartile range (IQR), 0.3-2.4 per 1000), the median epidemic duration was 13 weeks (IQR, 8-19), and the median early outbreak reproductive number was 1.8 (range, 1.1-3.5). Larger attack rates were associated with longer times to outbreak peak, longer epidemic durations, and lower case fatality risks.

Conclusions: This study provides a baseline from which the progress toward cholera control and essential statistics to inform outbreak management in sub-Saharan Africa can be monitored.

Keywords: Cholera; Outbreaks; Sub-Saharan Africa.


Conflict of interest statement

The authors have no competing interests to declare.

Figures

Figure 1
Figure 1
Spatial distribution of outbreaks reported at sub-national administrative units, January 2010 to January 2020. This map shows the regions that are associated with suspected cholera outbreaks. Different colors represent different sub-national administrative units at which cholera outbreaks were reported. Outbreaks in third-level administrative units are additionally marked with black dots to increase visibility on the map.
Figure 2
Figure 2
Proportion of population living in regions with outbreaks reported at the sub-national administrative units (%). The proportion of population living in regions with outbreaks reported at sub-national administrative units for each month between January 1, 2010 and January 31, 2020. The areas in grey represent time periods covered by daily and weekly cholera reports. To combine the population at different spatial levels, we added the population of different regions together, and when an outbreak was reported at multiple spatial units, the population of the highest spatial unit was used to represent the population affected by that outbreak.
Figure 3
Figure 3
Bivariate relationships between epidemic metrics among outbreaks reported at the second-level administrative units. This figure shows the correlations between different epidemic metrics for second-level administrative unit outbreaks, including outbreak threshold, mean reproductive number during the first epidemic week, attack rate, duration, time to outbreak peak and CFR. The marginal histograms show the distributions of individual metrics (The attack rate, weekly incidence per 100,000 people, and CFR are in log scale, whereas other characteristics are in linear scale). Panel A shows the correlation between time to outbreak peak (week) and outbreak duration (week). Panel B shows the correlation between outbreak threshold (i.e., weekly incidence per 100,000 people) and attack rate per 1000 people. Panel C shows the correlation between mean reproductive number during the first epidemic week and attack rate per 1000 people. Panel D shows the correlation between time to outbreak peak (week) and attack rate per 1000 people. Panel E shows the correlation between outbreak duration (week) and attack rate per 1000 people. Panel F shows the correlation between CFR (%) and attack rate per 1000 people. CFR = case fatality risks.

References

    1. Ajayi A, Smith SI. Recurrent cholera epidemics in Africa: which way forward? A literature review. Infection. 2019;47:341–349. - PubMed
    1. Balakrish Nair G, Takeda Y. Springer; Berlin: 2014. Cholera outbreaks.
    1. Best DJ, Roberts DE. Algorithm AS 89: The upper tail probabilities of Spearman's rho. Appl Stat. 1975;24:377.
    1. Bi Q, Abdalla FM, Masauni S, Reyburn R, Msambazi M, Deglise C, et al. The epidemiology of cholera in Zanzibar: implications for the Zanzibar comprehensive cholera elimination plan. J Infect Dis. 2018;218:S173–S180. - PMC - PubMed
    1. Chen YC, Yu SH, Chen WJ, Huang LC, Chen CY, Shih HM. Dispatcher-assisted cardiopulmonary resuscitation: disparity between urban and rural areas. Emerg Med Int. 2020;2020 - PMC - PubMed