Review
. 2022 May:349:17-35.
doi: 10.1016/j.atherosclerosis.2022.04.003.

Lipoprotein(a) beyond the kringle IV repeat polymorphism: The complexity of genetic variation in the LPA gene

Affiliations
Review

Lipoprotein(a) beyond the kringle IV repeat polymorphism: The complexity of genetic variation in the LPA gene

Stefan Coassin et al. Atherosclerosis. 2022 May.

Abstract

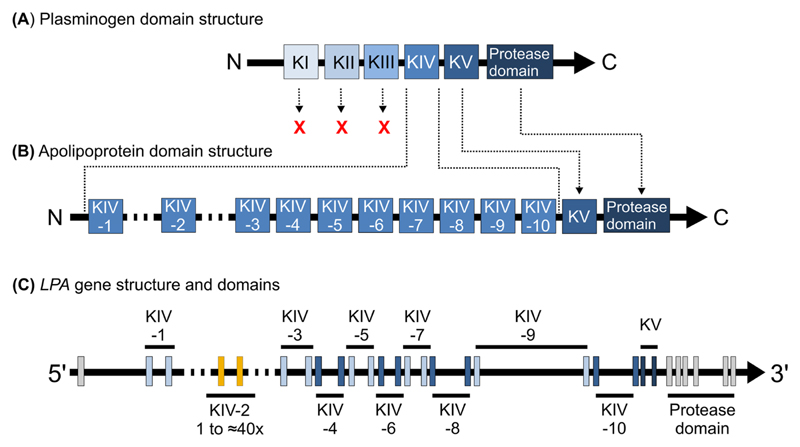
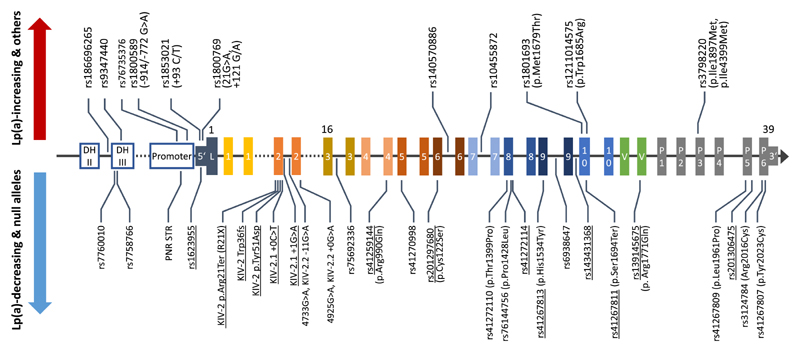
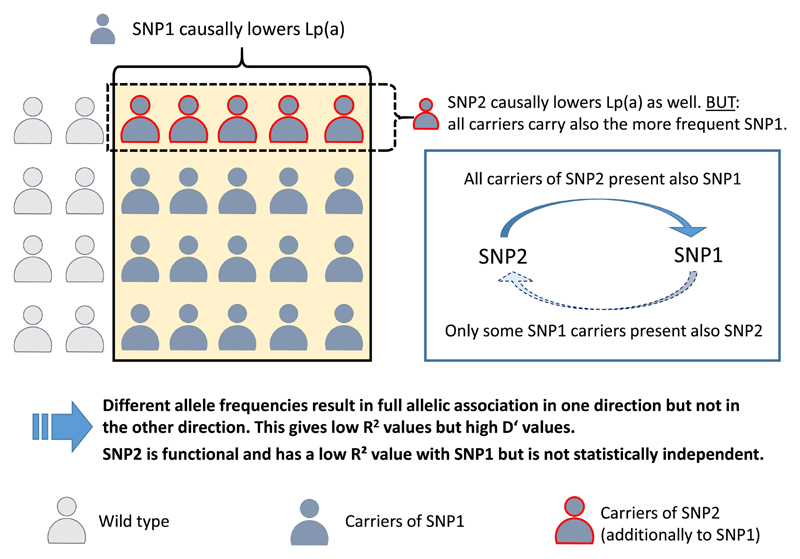
High lipoprotein(a) [Lp(a)] concentrations are one of the most important genetically determined risk factors for cardiovascular disease. Lp(a) concentrations are an enigmatic trait largely controlled by one single gene (LPA) that contains a complex interplay of several genetic elements with many surprising effects discussed in this review. A hypervariable coding copy number variation (the kringle IV type-2 repeat, KIV-2) generates >40 apolipoprotein(a) protein isoforms and determines the median Lp(a) concentrations. Carriers of small isoforms with up to 22 kringle IV domains have median Lp(a) concentrations up to 5 times higher than those with large isoforms (>22 kringle IV domains). The effect of the apo(a) isoforms are, however, modified by many functional single nucleotide polymorphisms (SNPs) distributed over the complete range of allele frequencies (<0.1% to >20%) with very pronounced effects on Lp(a) concentrations. A complex interaction is present between the apo(a) isoforms and LPA SNPs, with isoforms partially masking the effect of functional SNPs and, vice versa, SNPs lowering the Lp(a) concentrations of affected isoforms. This picture is further complicated by SNP-SNP interactions, a poorly understood role of other polymorphisms such as short tandem repeats and linkage structures that are poorly captured by common R2 values. A further layer of complexity derives from recent findings that several functional SNPs are located in the KIV-2 repeat and are thus not accessible to conventional sequencing and genotyping technologies. A critical impact of the ancestry on correlation structures and baseline Lp(a) values becomes increasingly evident. This review provides a comprehensive overview on the complex genetic architecture of the Lp(a) concentrations in plasma, a field that has made tremendous progress with the introduction of new technologies. Understanding the genetics of Lp(a) might be a key to many mysteries of Lp(a) and booster new ideas on the metabolism of Lp(a) and possible interventional targets.

Keywords: Ancestry; Ethnicity; Genetics; Kringle IV polymorphism; Kringle IV-2; LPA; Lipoprotein(a).


Conflict of interest statement

Declaration of competing interests

The authors declare the following financial interests/personal relationships which may be considered as potential competing interests:

Dr. Kronenberg has served on the advisory boards and has received lecture fees from Novartis and Amgen.

Figures

Fig. 1
Fig. 1. LPA evolution from plasminogen and the respective domain and gene structures.
(A) Plasminogen domain structure consisting of five kringle domains (I to V) and a C-terminal protease domain. (B) Apolipoprotein(a) domain structure. The origin of the domains from their precursors in plasminogen (A) is shown by arrows. LPA originated from plasminogen by gene duplication, loss of KI to KIII, expansion of KIV, introduction of a CNV structure for the KIV-2, and retaining of KV and the protease domain (which was inactivated by mutations). (C) Gene structure of LPA, with every kringle consisting of two short exons, spaced by a mostly ≈4 kb large intron (except KIV-9, 19 kb). A ≈1.2 kb intron separates the KIV units. The start of exon 1 has changed over time, with some early studies using an annotation with 90 additional bases on the 5’ side [66,88,101]. Ensembl annotations using the human genome reference GRCh37/hg19 and NCBI36/hg18 (before release 76; ENST00000447678.1) contained an additional non-coding exon ≈4 kb upstream of the current exon 1. This was not present in the very first genetic studies and has been removed again in the current annotations.
Fig. 2
Fig. 2. Lp(a) variance in a general European population.
(A) Lp(a) concentrations in each isoform group (defined in heterozygotes by the smaller isoform present). This shows the large variance of Lp(a) within each isoform group. Many samples with very low Lp(a) can be observed in each apo(a) isoform group, being most pronounced in isoforms 23 and 24. This is caused largely by the variant KIV-2 4925G>A (discussed in the section about KIV-2 variants), as well as partially by KIV-2 4733G>A [30] and other variants. (B) Median Lp(a) in isoforms groups (groups according to Ref. [1]). The concentrations decrease sharply between 22 and 23 KIV. (C) Box plots of the same data as in panel B shows a considerable variance in each group. Data are often shown in the literature as in Panel B which ignores the enormous variability in each apo(a) isoform group. (D) Same figure as panel A, but with the carriers of KIV-2 4925G>A shown in blue (yellow: non-carriers). This shows well how a strongly Lp(a)-modifying SNP may cluster with a defined isoform range. Several similar examples are described in Refs. [24,38]. Data is from the general population studies KORA [146] F3 and F4 (n = 5807 in panel A and D n = 6005 in panels B and C; updated from Ref. [29]). Study design and Lp(a) phenotyping have been described in Refs. [29,77,85].
Fig. 3
Fig. 3. Location of relevant LPA SNPs.
Location of multiple LPA SNPs with remarkable effects that have been discussed in the literature. Table 1 provides background information. The exons are numbered according to the domain that they encode (1-10: KIV-1 to KIV-10, L. leader sequence, P. protease domain, 5’: 5’UTR, 3’: 3’ UTR). For orientation, some exons carry a superscript reporting the exon number in the genome sequence hg38. SNPs that have been associated with increased Lp(a) concentrations or that act through other mechanisms (rs1211014575, which prevents OxPL binding) are shown above the gene structure; SNPs that have been associated with decreased Lp(a) (both causally or by association only) are shown below. SNPs that cause null alleles are underlined, albeit many more Lp(a)-lowering SNPs may cause null alleles if occurring on an allele with already low Lp(a) production. SNPs in the KIV-2 are named according to their publication, as they cannot be assigned a single rs-identifier because their location is not unique. Gene structure is not in scale.
Fig. 4
Fig. 4. Minor allele frequencies of selected LPA SNPs that are assumed or confirmed to be functional.
Several assumed or confirmed functional LPA SNPs show considerable MAF differences between population and ancestries. Selected SNPs are shown in this figure. Frequencies are from gnomAD [116] exome data v 2.1.1 for coding SNPs (125,748 exomes, 15,708 genomes) and from gnomAD 3.1.2 (76,156 genomes) for non-coding SNPs. For the KIV-2 SNPs 4733G>A [30], 4925G>A [29] and R21X [96], the MAF was estimated from the carrier frequency reported in the respective publications (which were based on the 1000 Genomes phase 3v5 [147] sequencing data, n = 2504 genomes) assuming Hardy-Weinberg-equilibrium. Light color indicates the minor allele according to the human genome hg38. Note that this is not necessarily the effect allele of the single SNPs (for example for rs1853021). The population color code is given bottom-right. Population codes are from GnomAD: AFR: African/African American, AMR: Latino/Admixed American, EAS: East Asian, FIN: European (Finnish), NFE: European (non-Finnish), SAS: South Asian. For non-missense SNPs, a description is given in square bracket for better classification (pr.: promoter).
Fig. 5
Fig. 5. Association of SNPs with apolipoprotein(a) isoforms.
(A) Association of selected SNPs with given apo(a) isoform ranges in Europeans, stratified by Lp(a)-increasing or Lp(a)-decreasing variants, as in Fig. 3. This shows considerable differences across SNPs. (B) Association of selected SNPs with different isoform ranges across ancestries (ancestry color code given bottom-right). Unfortunately, this data is available for only very few SNPs, but notable differences can be appreciated, which can bias cross-ancestry studies. Note that no truly structured and standardized data is available. For most SNPs isoform-association has been assessed only by one or maximum a few studies. Therefore, this figure has been assembled from multiple technologies such as LPA genotyping by pulsed-field gel electrophoresis [10,11], Western blotting and imputed KIV-2 content [24]. The ranges given here are thus purely indicative and, especially at single individual level, association with other isoforms may be possible as well. When various overlapping ranges were reported by different authors, the widest range is shown. Additional information and references are given in Table 1. For simplicity, boxes with defined boundaries have been used for representation (the limits are based on literature reports), but for many SNPs the isoform-association is not that well confined and extends also beyond the limits given here. For example, KIV-2 4733G>A is seen predominantly in 24–33 KIV but found across the whole isoform range.
Fig. 6
Fig. 6. The background isoform affects the interpretation of LPA SNP (selected examples).
The association of LPA SNPs with defined isoform ranges can mask their true effect. This figures describes three basic principles but several other combinations are possible, and each example could also be conceived into the opposite direction. For better representation, we assume a simplified trait with three well-defined isoform ranges clearly associated with high, moderate and low Lp(a) concentrations, respectively). Each SNP is associated only with one range. The exemplary SNPs affect the average Lp(a) concentrations in the groups but not the Lp(a) variance. The second isoform is omitted for simplicity. The left side of the figure describes the effect observed when just comparing wild type and SNP carriers (i.e. carriers of the variant base). This analysis reflects the analyses that are performed in common SNP association studies. The left panel shows the distribution of 18 exemplary individuals per group, with the y-axis representing the Lp(a) concentrations. Every dot represents an individual. The right panel shows the location of the respective average Lp(a) values. The red arrow indicates the resulting SNP effect. The right side of the figure shows the same data, but color-coded for the background isoform. The incorporation of the isoforms into the analysis changes the reference average. This can mitigate (example A), reverse (example B) or unmask (example C) the real effect of a SNP. It is important to note that, depending on the aim of the study, both types of analyses may actually be “correct”. Unadjusted analyses capture indirectly also the effect of the isoforms and may be appropriate for general association studies or construction of genetic risk scores. Isoform-adjusted studies can identify SNPs that govern Lp(a) variance in subgroups, improving the overall variance explained, and help to develop hypotheses for functional studies. See the main text for discussion of the SNP mentioned as examples. (A, left side (SNP only)) SNP variant is associated with low Lp(a). (A, right side (background isoform considered)) this SNP is located on large apo(a) alleles with a low expression level. This limits the total SNP effect. Examples: rs1853021, rs41272114. (B, left) An SNP is associated with low Lp(a). (B, right) This SNP is actually associated with increased Lp(a) but it is located on large isoforms. The overall Lp(a)-lowering effect of the large isoforms masks the Lp(a)-increasing effect of the SNP. Example: rs1800769. (C, left) The SNP has no effect on Lp(a). (C, right) When considering that this SNP is located on short isoforms, the SNP becomes strongly Lp(a)-decreasing. Example: KIV-2 4925G>A.
Fig. 7
Fig. 7. Effect of KIV-2 SNPs 4925G>A and 4733G>A on Lp(a).
Compound heterozygosity with KIV-2 SNPs 4925G>A and 4733G>A lowers Lp(a) by 32 mg/dL and virtually abolishes Lp(a) variance over the whole isoform range, resulting in a nine-fold narrower interquartile range in carriers than in wild type individuals (4.6 vs. 42.1 mg/dL). Data is from Fig. 4B of Schachtl-Riess et al., 2021 [30]. Outliers omitted for better representation. Where necessary, isoforms are grouped to encompass at least five individuals per group.
Fig. 8
Fig. 8. Example of how allelic association between a frequent and a rarer functional SNP might mislead association studies.
The functional LPA SNP2 occurs on the same haplotype as the second functional SNP1, which is, however, considerably more frequent. Due to the different MAFs, the R2 value between these two SNPs will be low and the SNPs might be easily regarded as independent (albeit D′ will be high). SNP2 alone will show an association with Lp(a), but this association will vanish if also SNP1 is included in the regression model. SNP2 is not statistically independent and adds little or nothing to the genetic variance explained by SNP1. Two such examples are described in section 8. “Allelic association between SNP” (SNP pairs rs41272114/KIV-2 R21X and rs76735376/rs10455872).

Similar articles

Cited by

References

    1. Kronenberg F, Utermann G. Lipoprotein(a): resurrected by genetics. J Intern Med. 2013;273:6–30. doi: 10.1111/j.1365-2796.2012.02592.x. - DOI - PubMed
    1. Nordestgaard BG, Langsted A. Lipoprotein(a) as a cause of cardiovascular disease: insights from epidemiology, genetics, and biology. J Lipid Res. 2016;57:1953–1975. doi: 10.1194/jlr.R071233. - DOI - PMC - PubMed
    1. Tsimikas S. A test in context: lipoprotein(a): diagnosis, prognosis, controversies, and emerging therapies. J Am Coll Cardiol. 2017;69:692–711. doi: 10.1016/j.jacc.2016.11.042. - DOI - PubMed
    1. Nordestgaard BG, Chapman MJ, Ray K, Boren J, Andreotti F, et al. Lipoprotein(a) as a cardiovascular risk factor: current status. Eur Heart J. 2010;31:2844–2853. doi: 10.1093/eurheartj/ehq386. - DOI - PMC - PubMed
    1. Boffa MB, Koschinsky ML. Oxidized phospholipids as a unifying theory for lipoprotein(a) and cardiovascular disease. Nat Rev Cardiol. 2019;16:305–318. doi: 10.1038/s41569-018-0153-2. - DOI - PubMed

MeSH terms