. 2022 Jun 22;42(25):5102-5114.
doi: 10.1523/JNEUROSCI.2006-21.2022. Epub 2022 May 23.

Calpain-2 Mediates MBNL2 Degradation and a Developmental RNA Processing Program in Neurodegeneration

Affiliations

Calpain-2 Mediates MBNL2 Degradation and a Developmental RNA Processing Program in Neurodegeneration

Lee-Hsin Wang et al. J Neurosci. .

Abstract

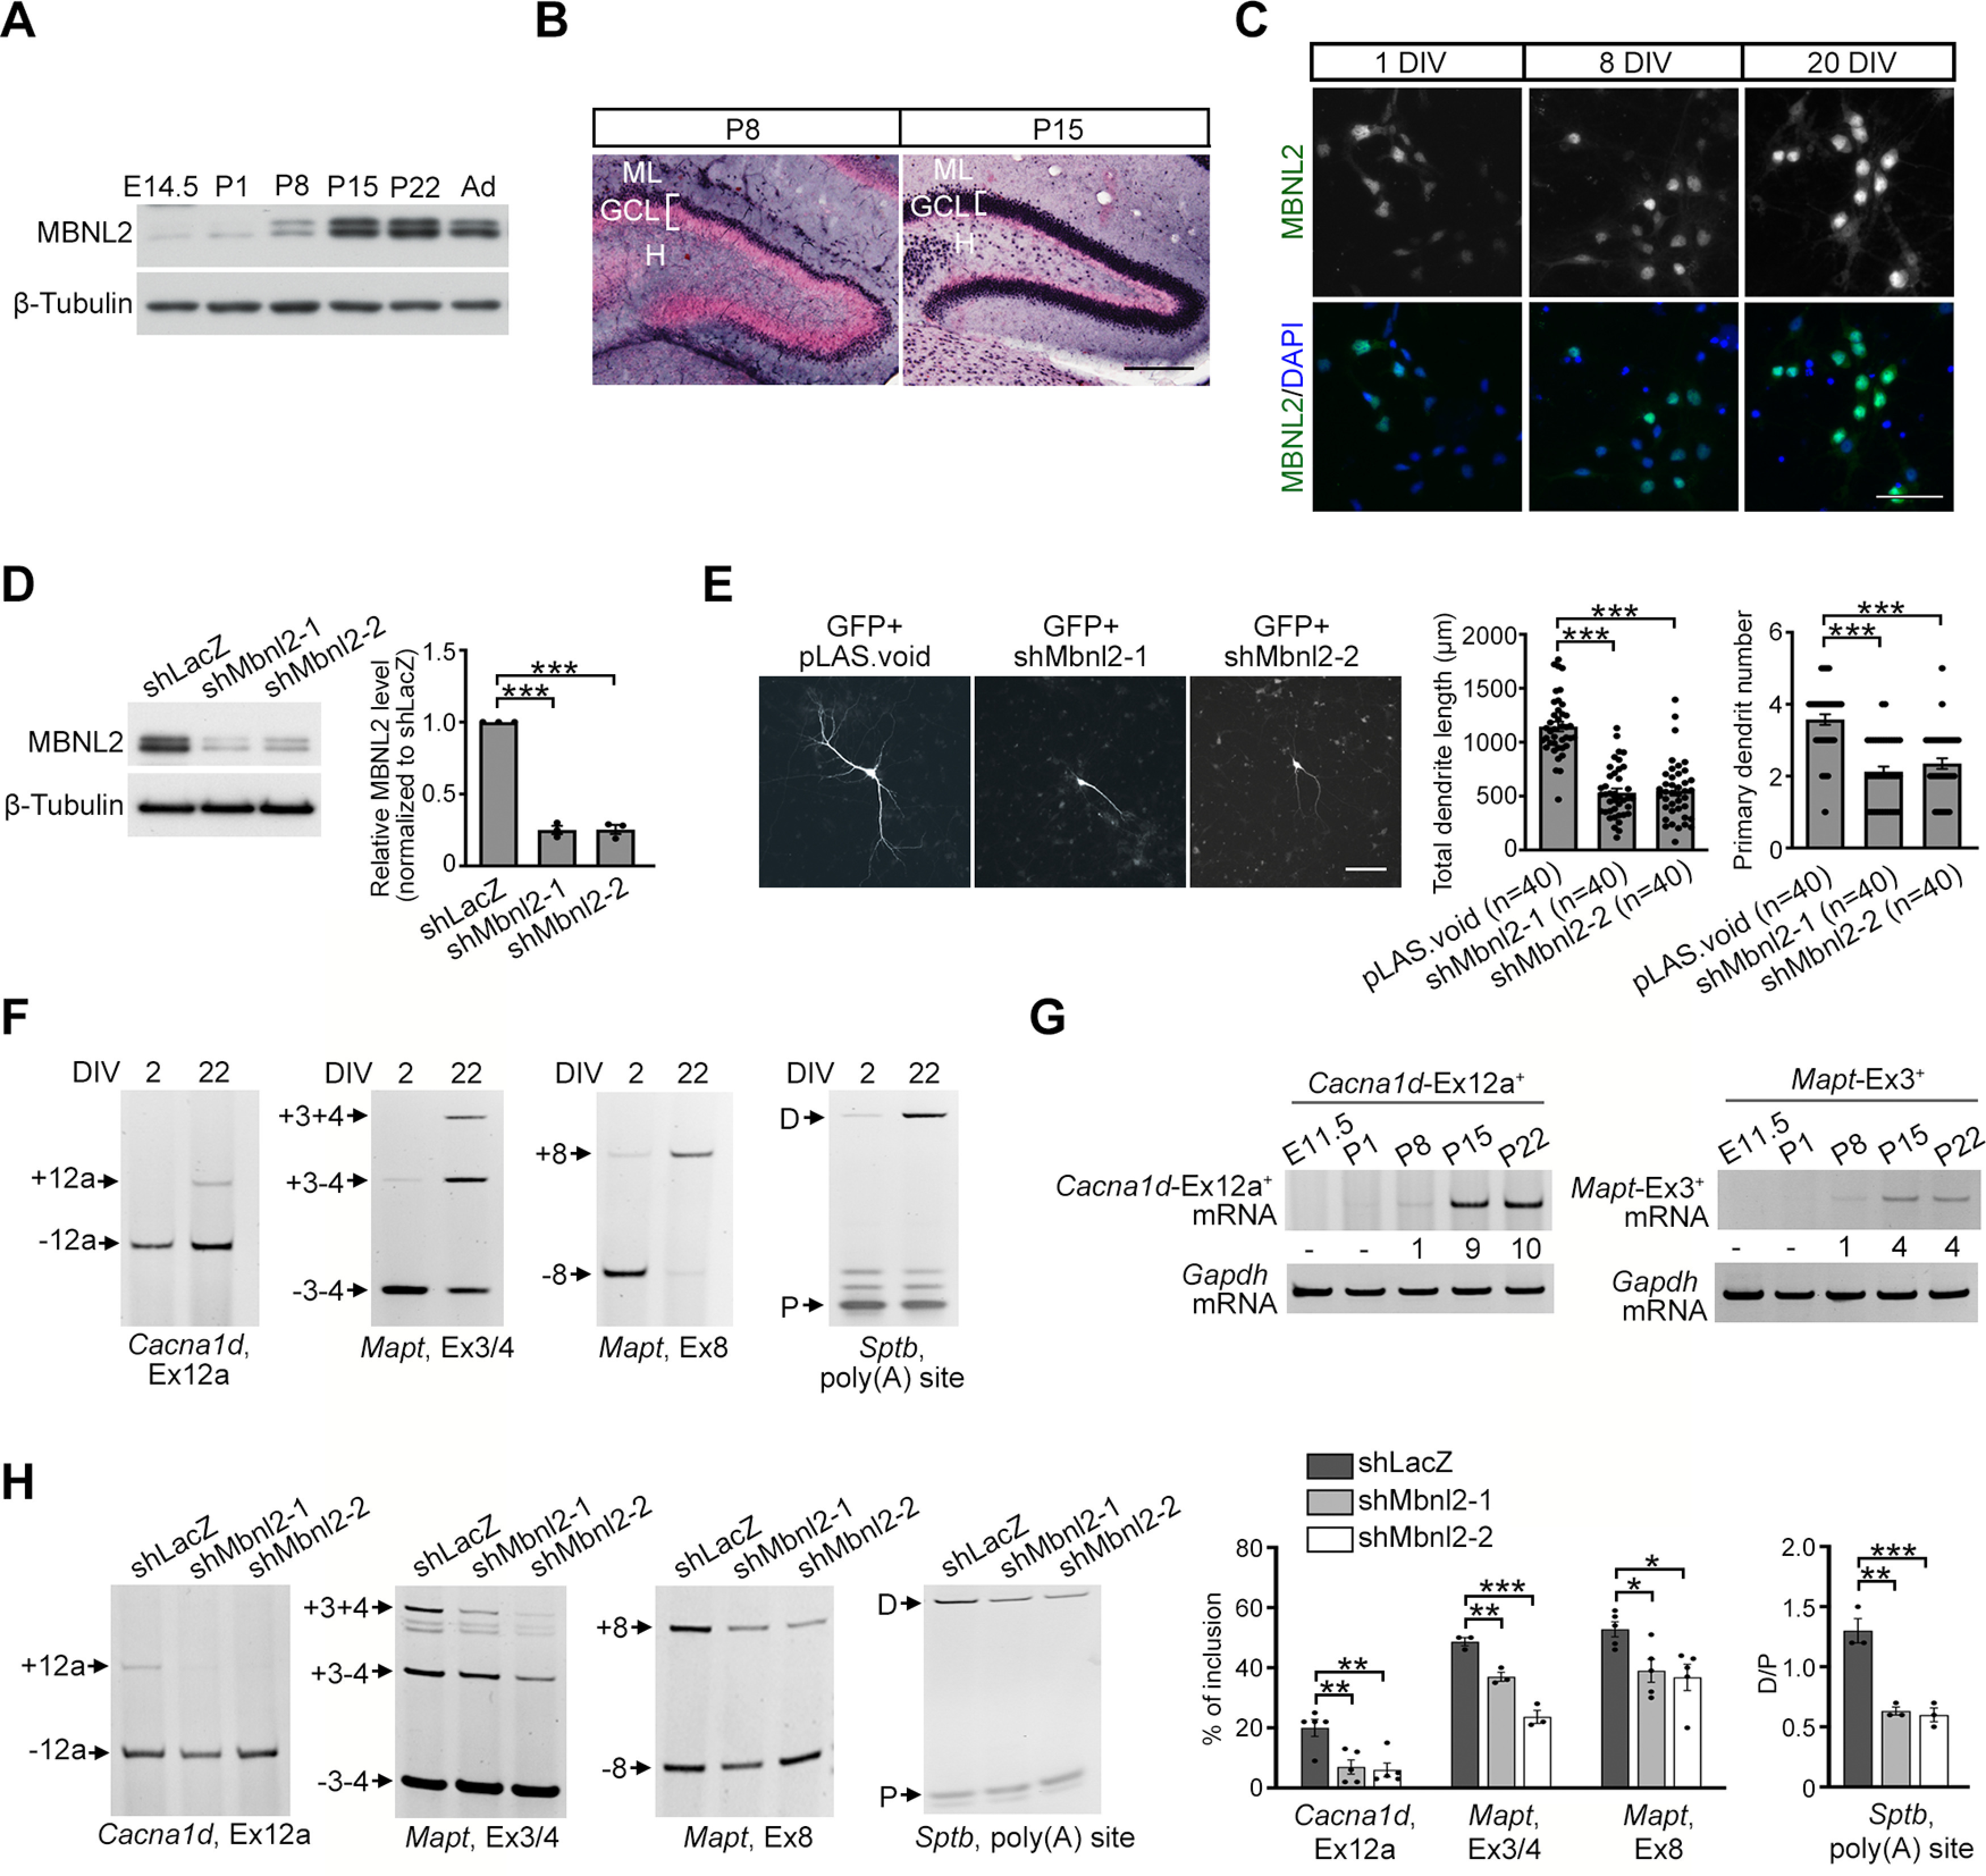
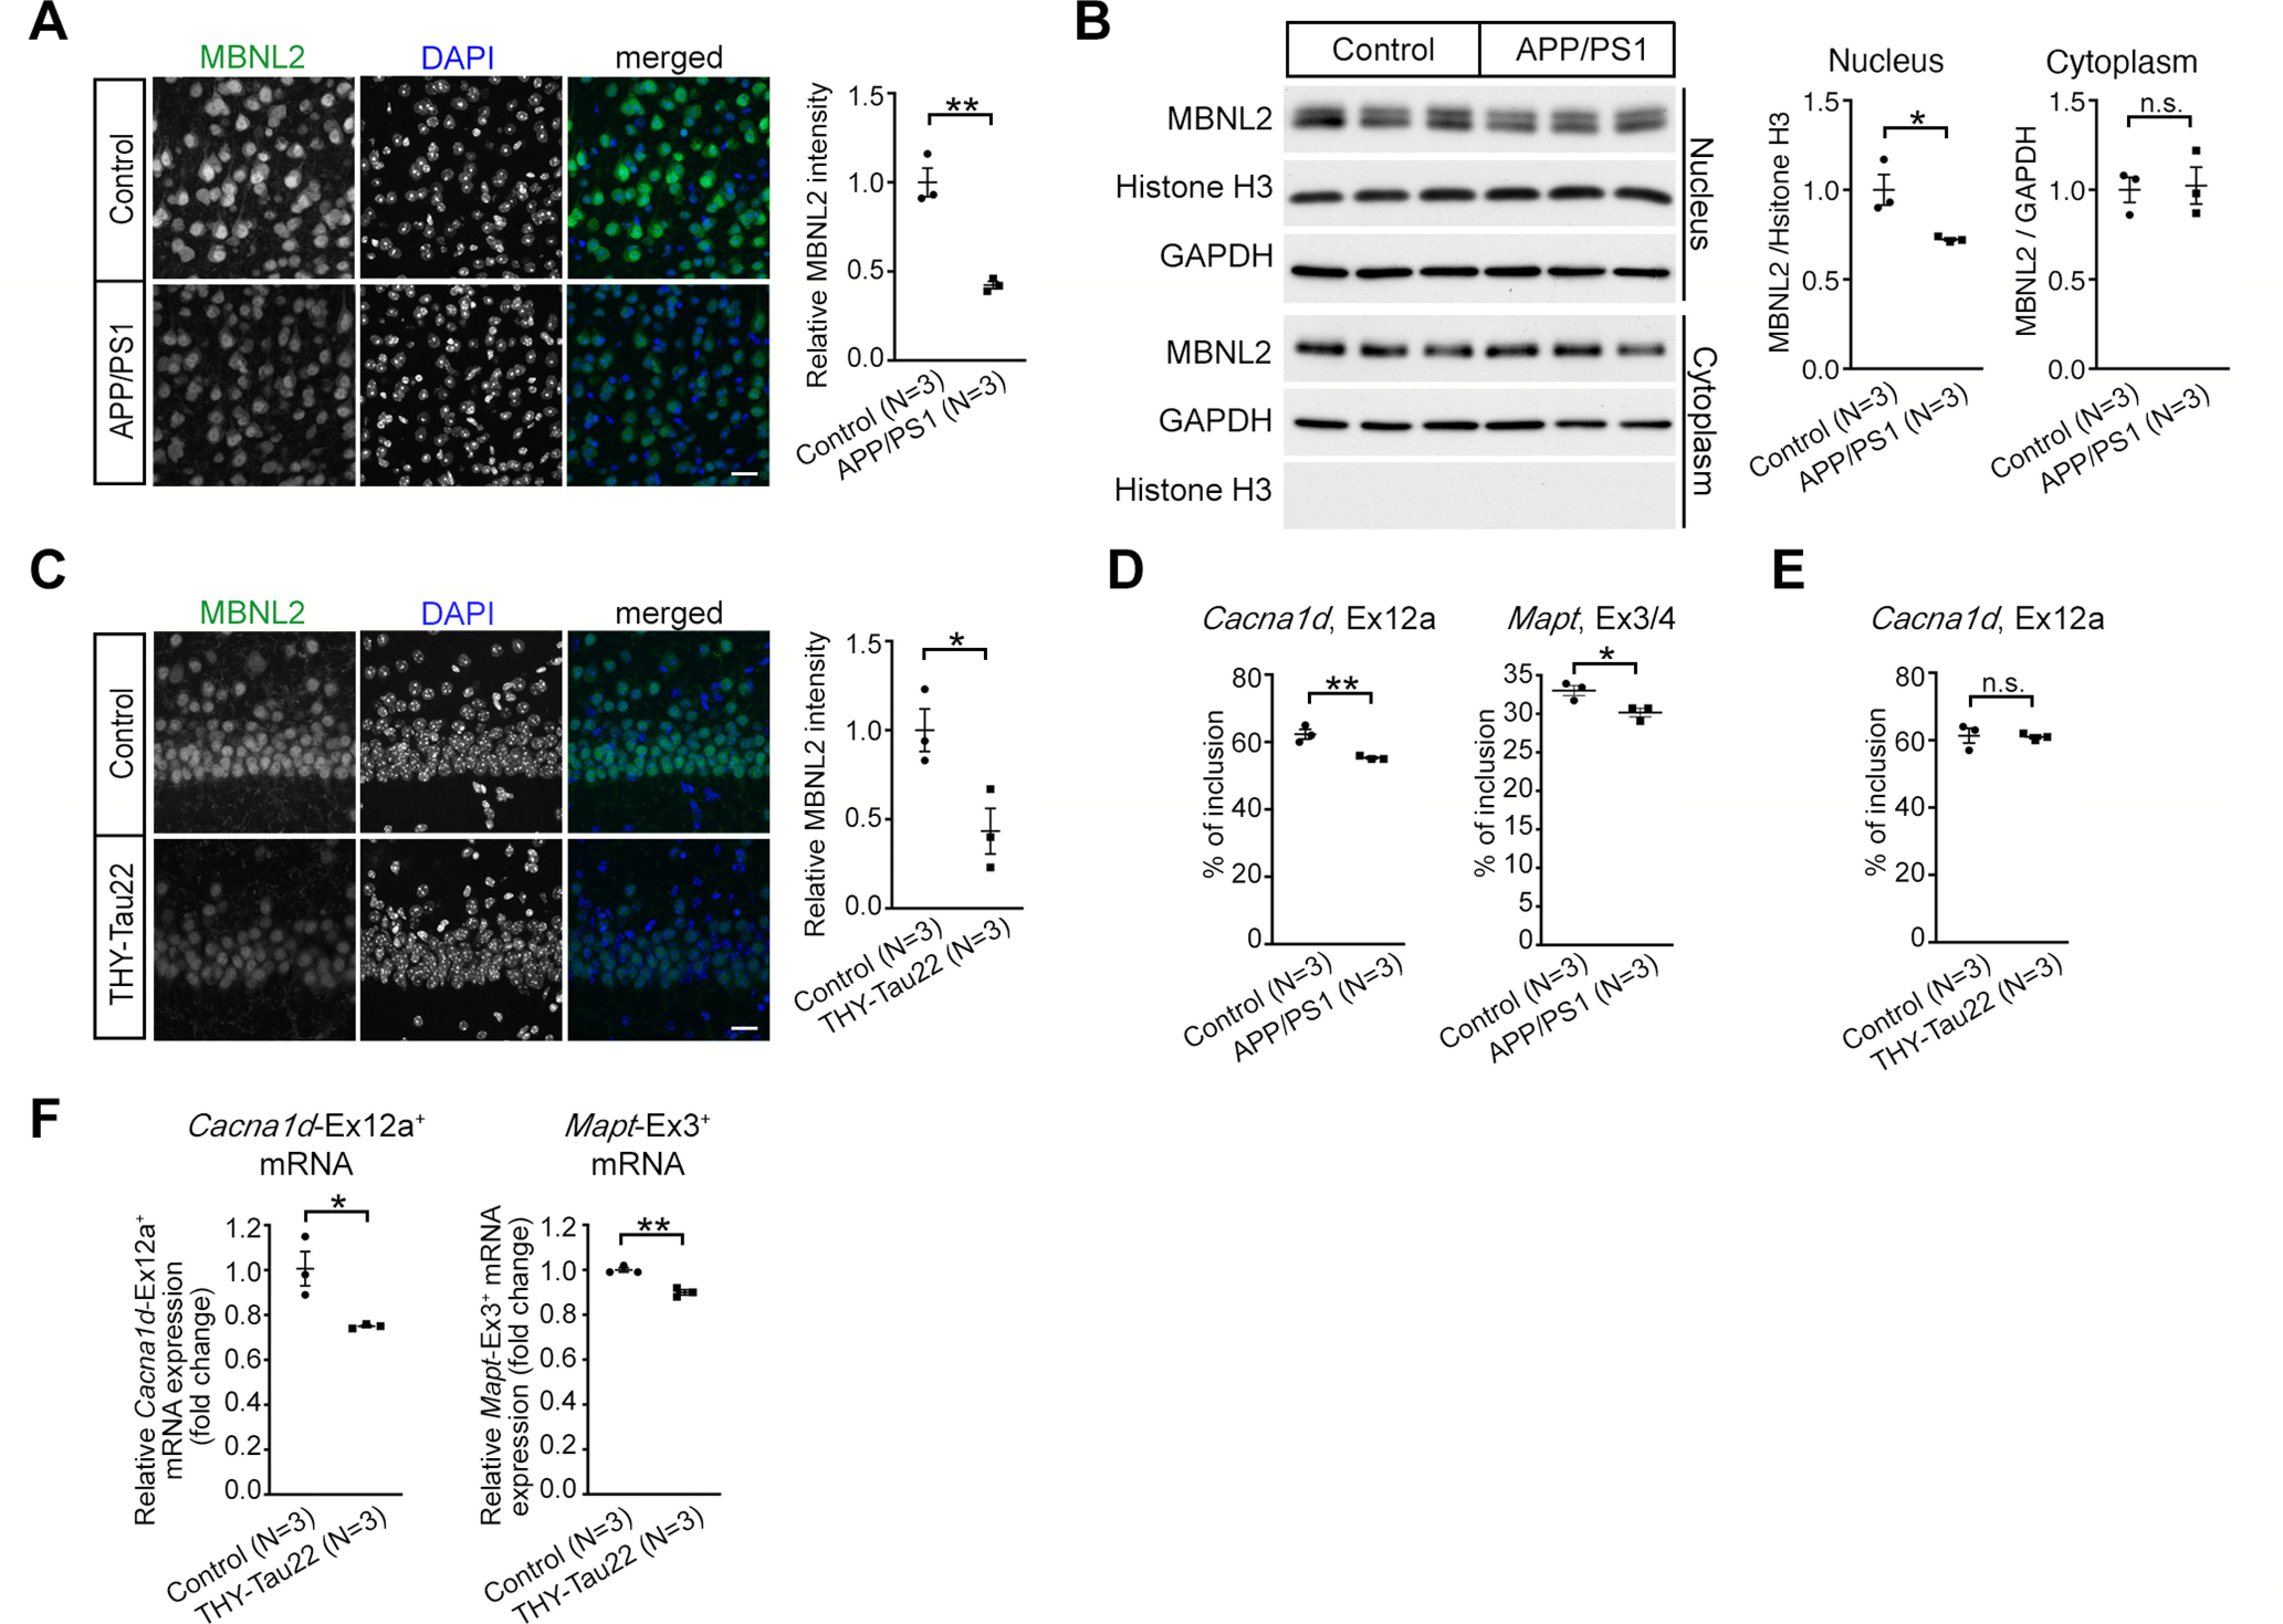
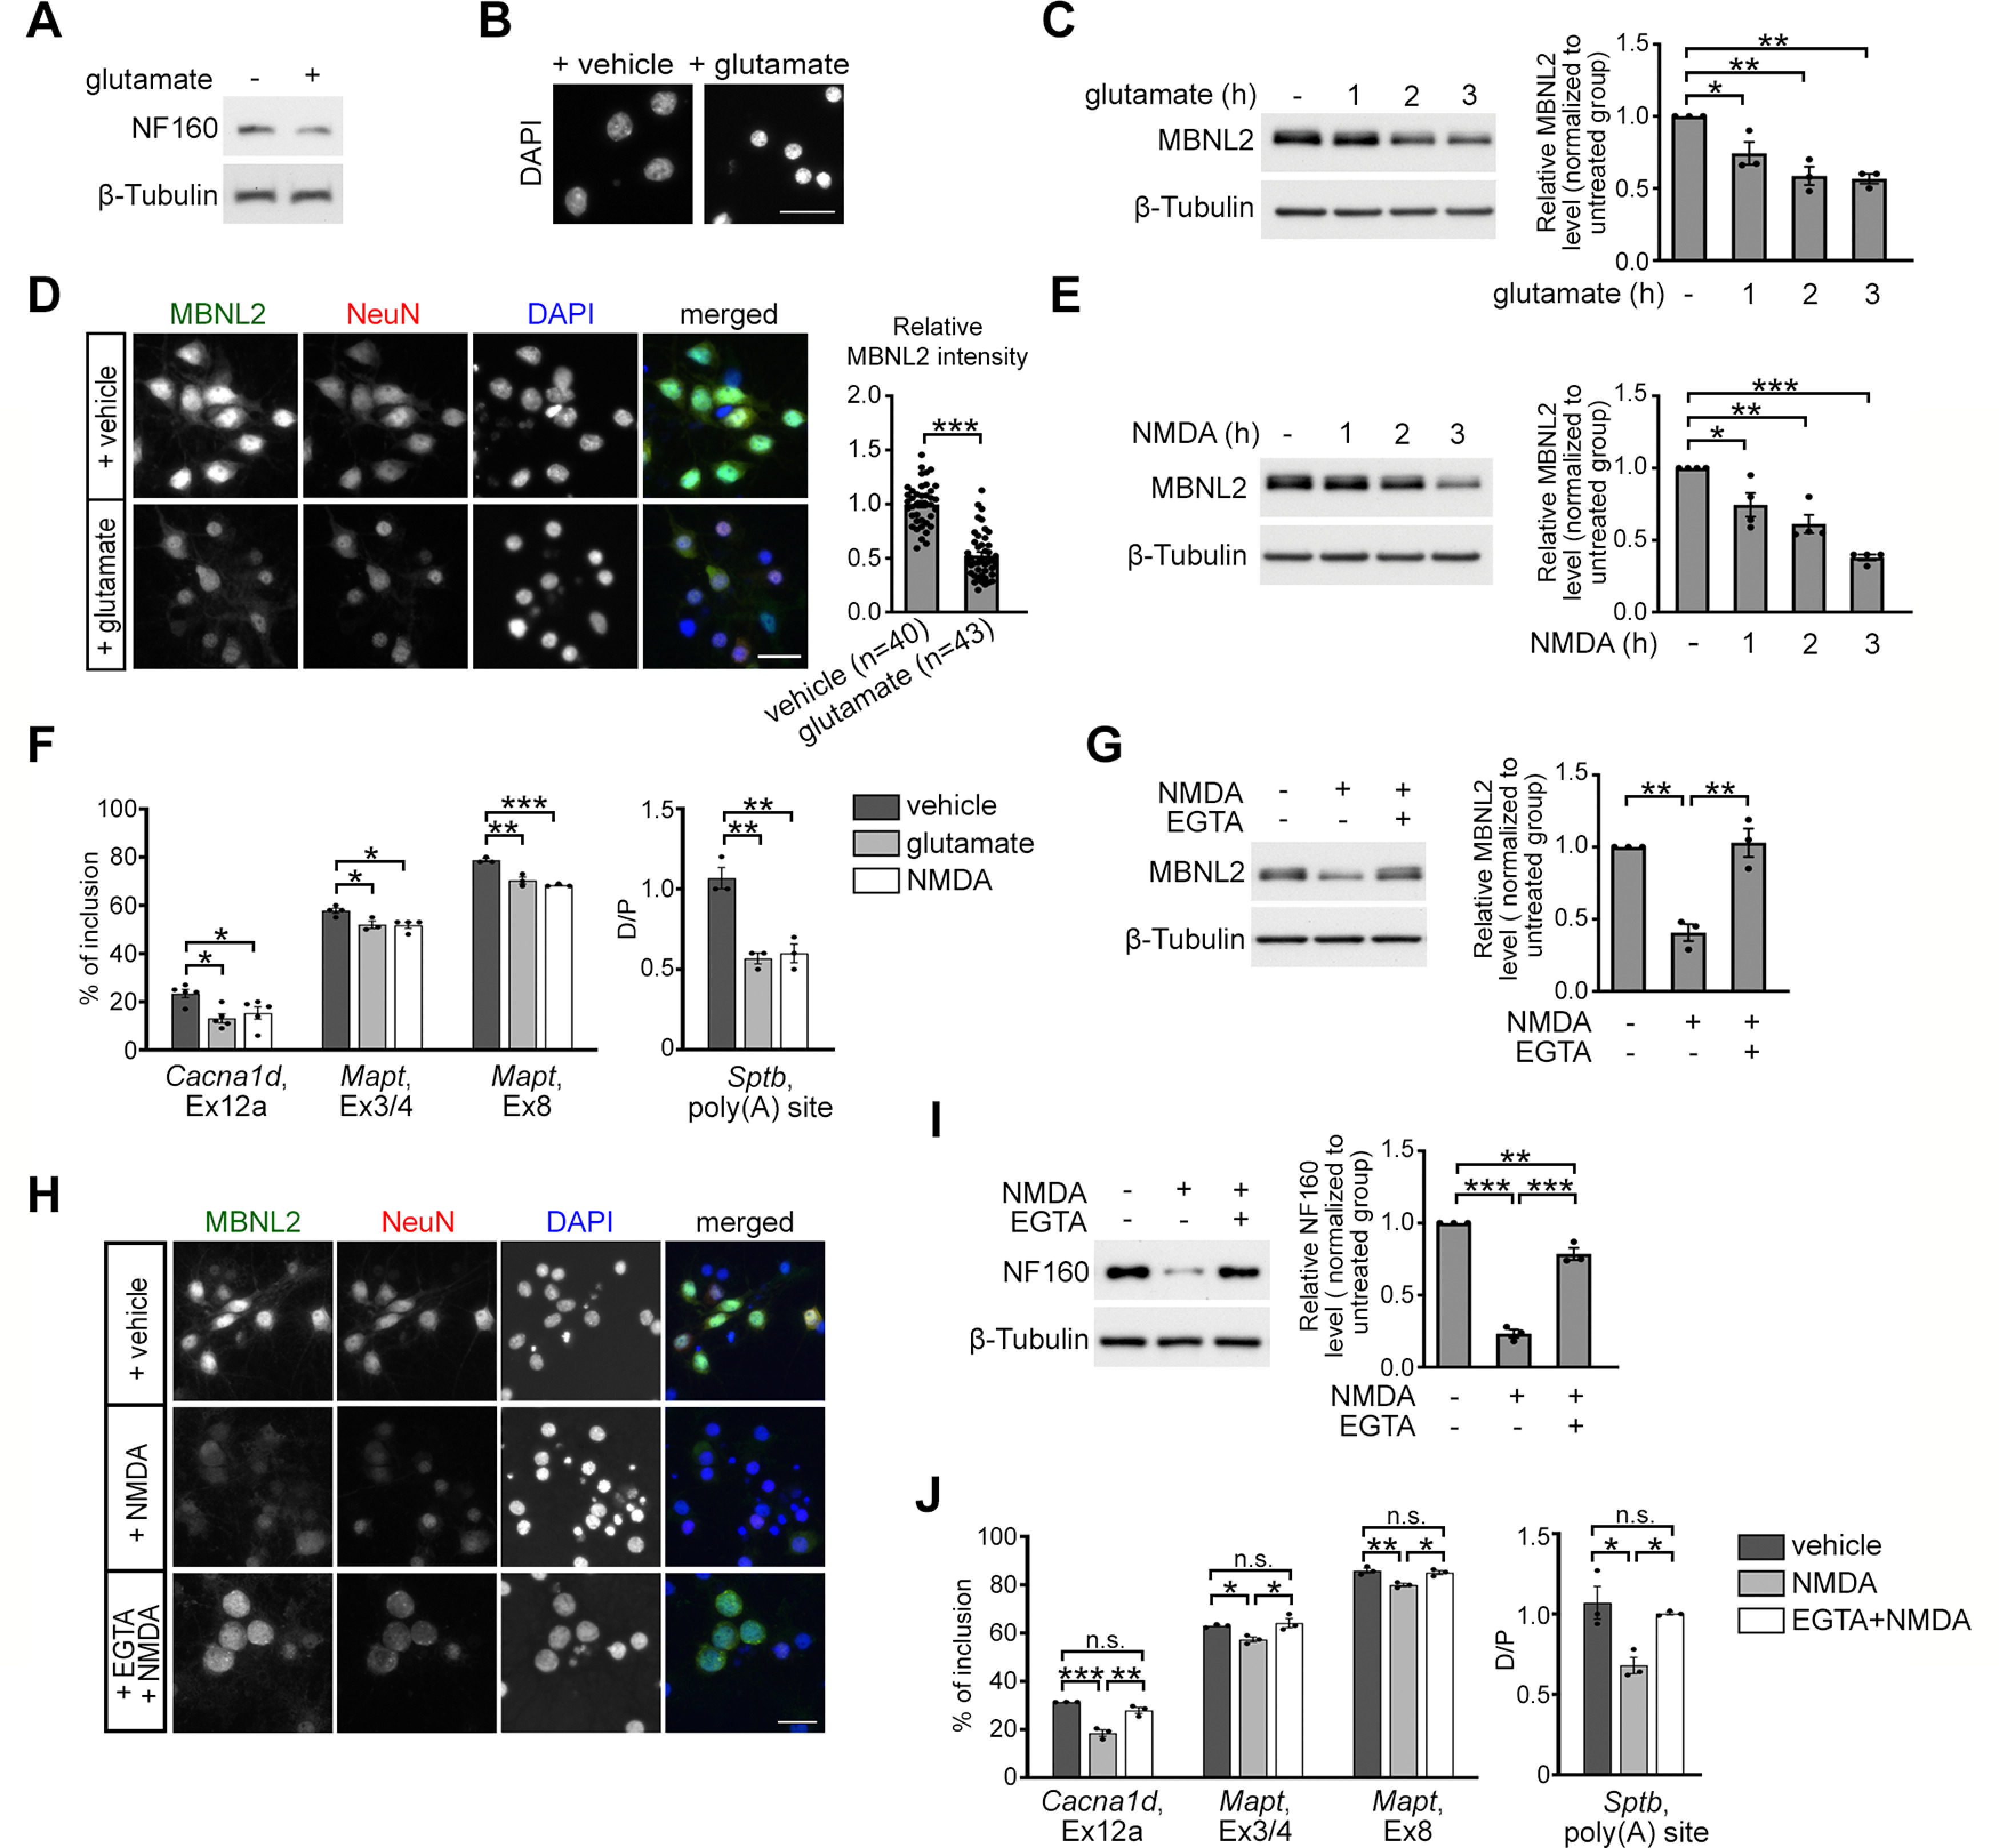
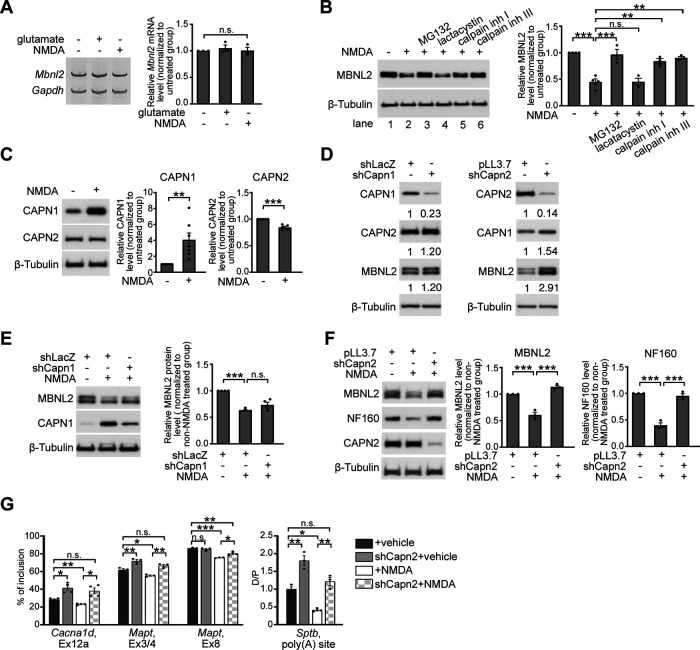
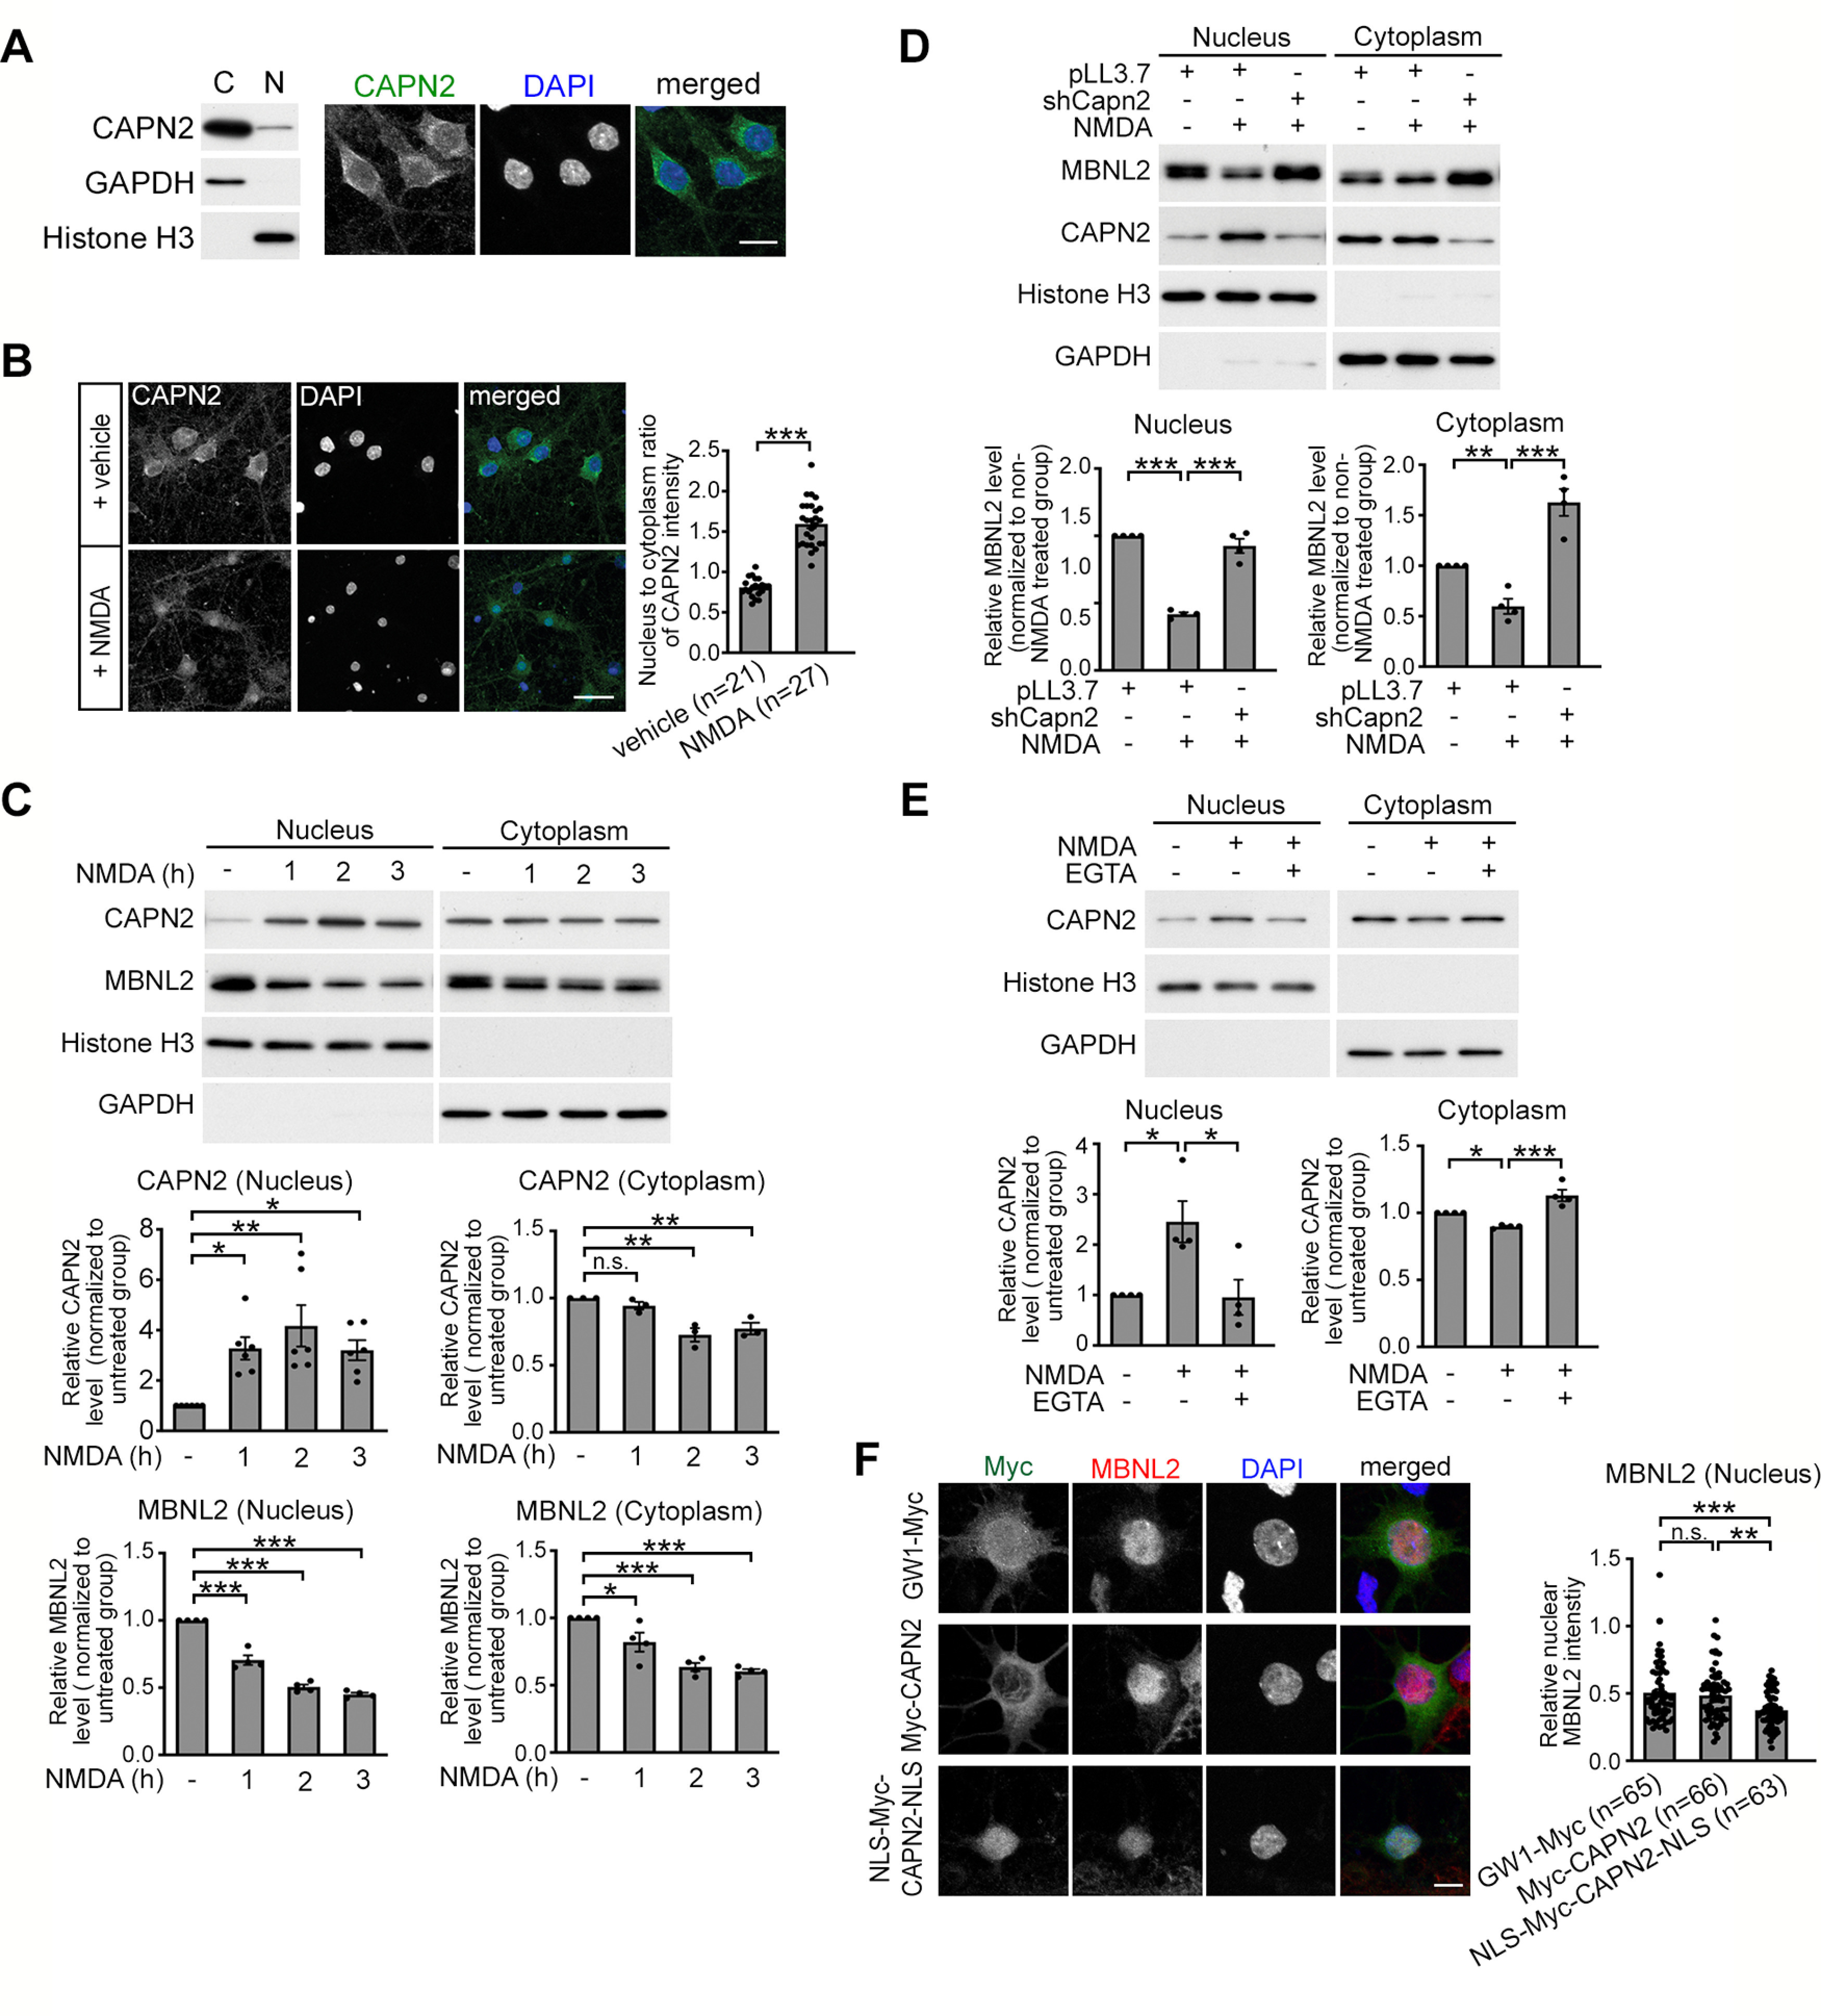
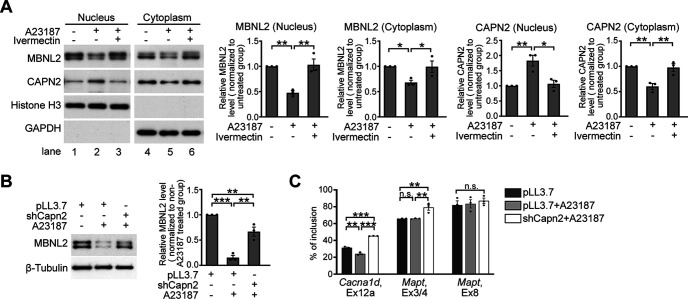
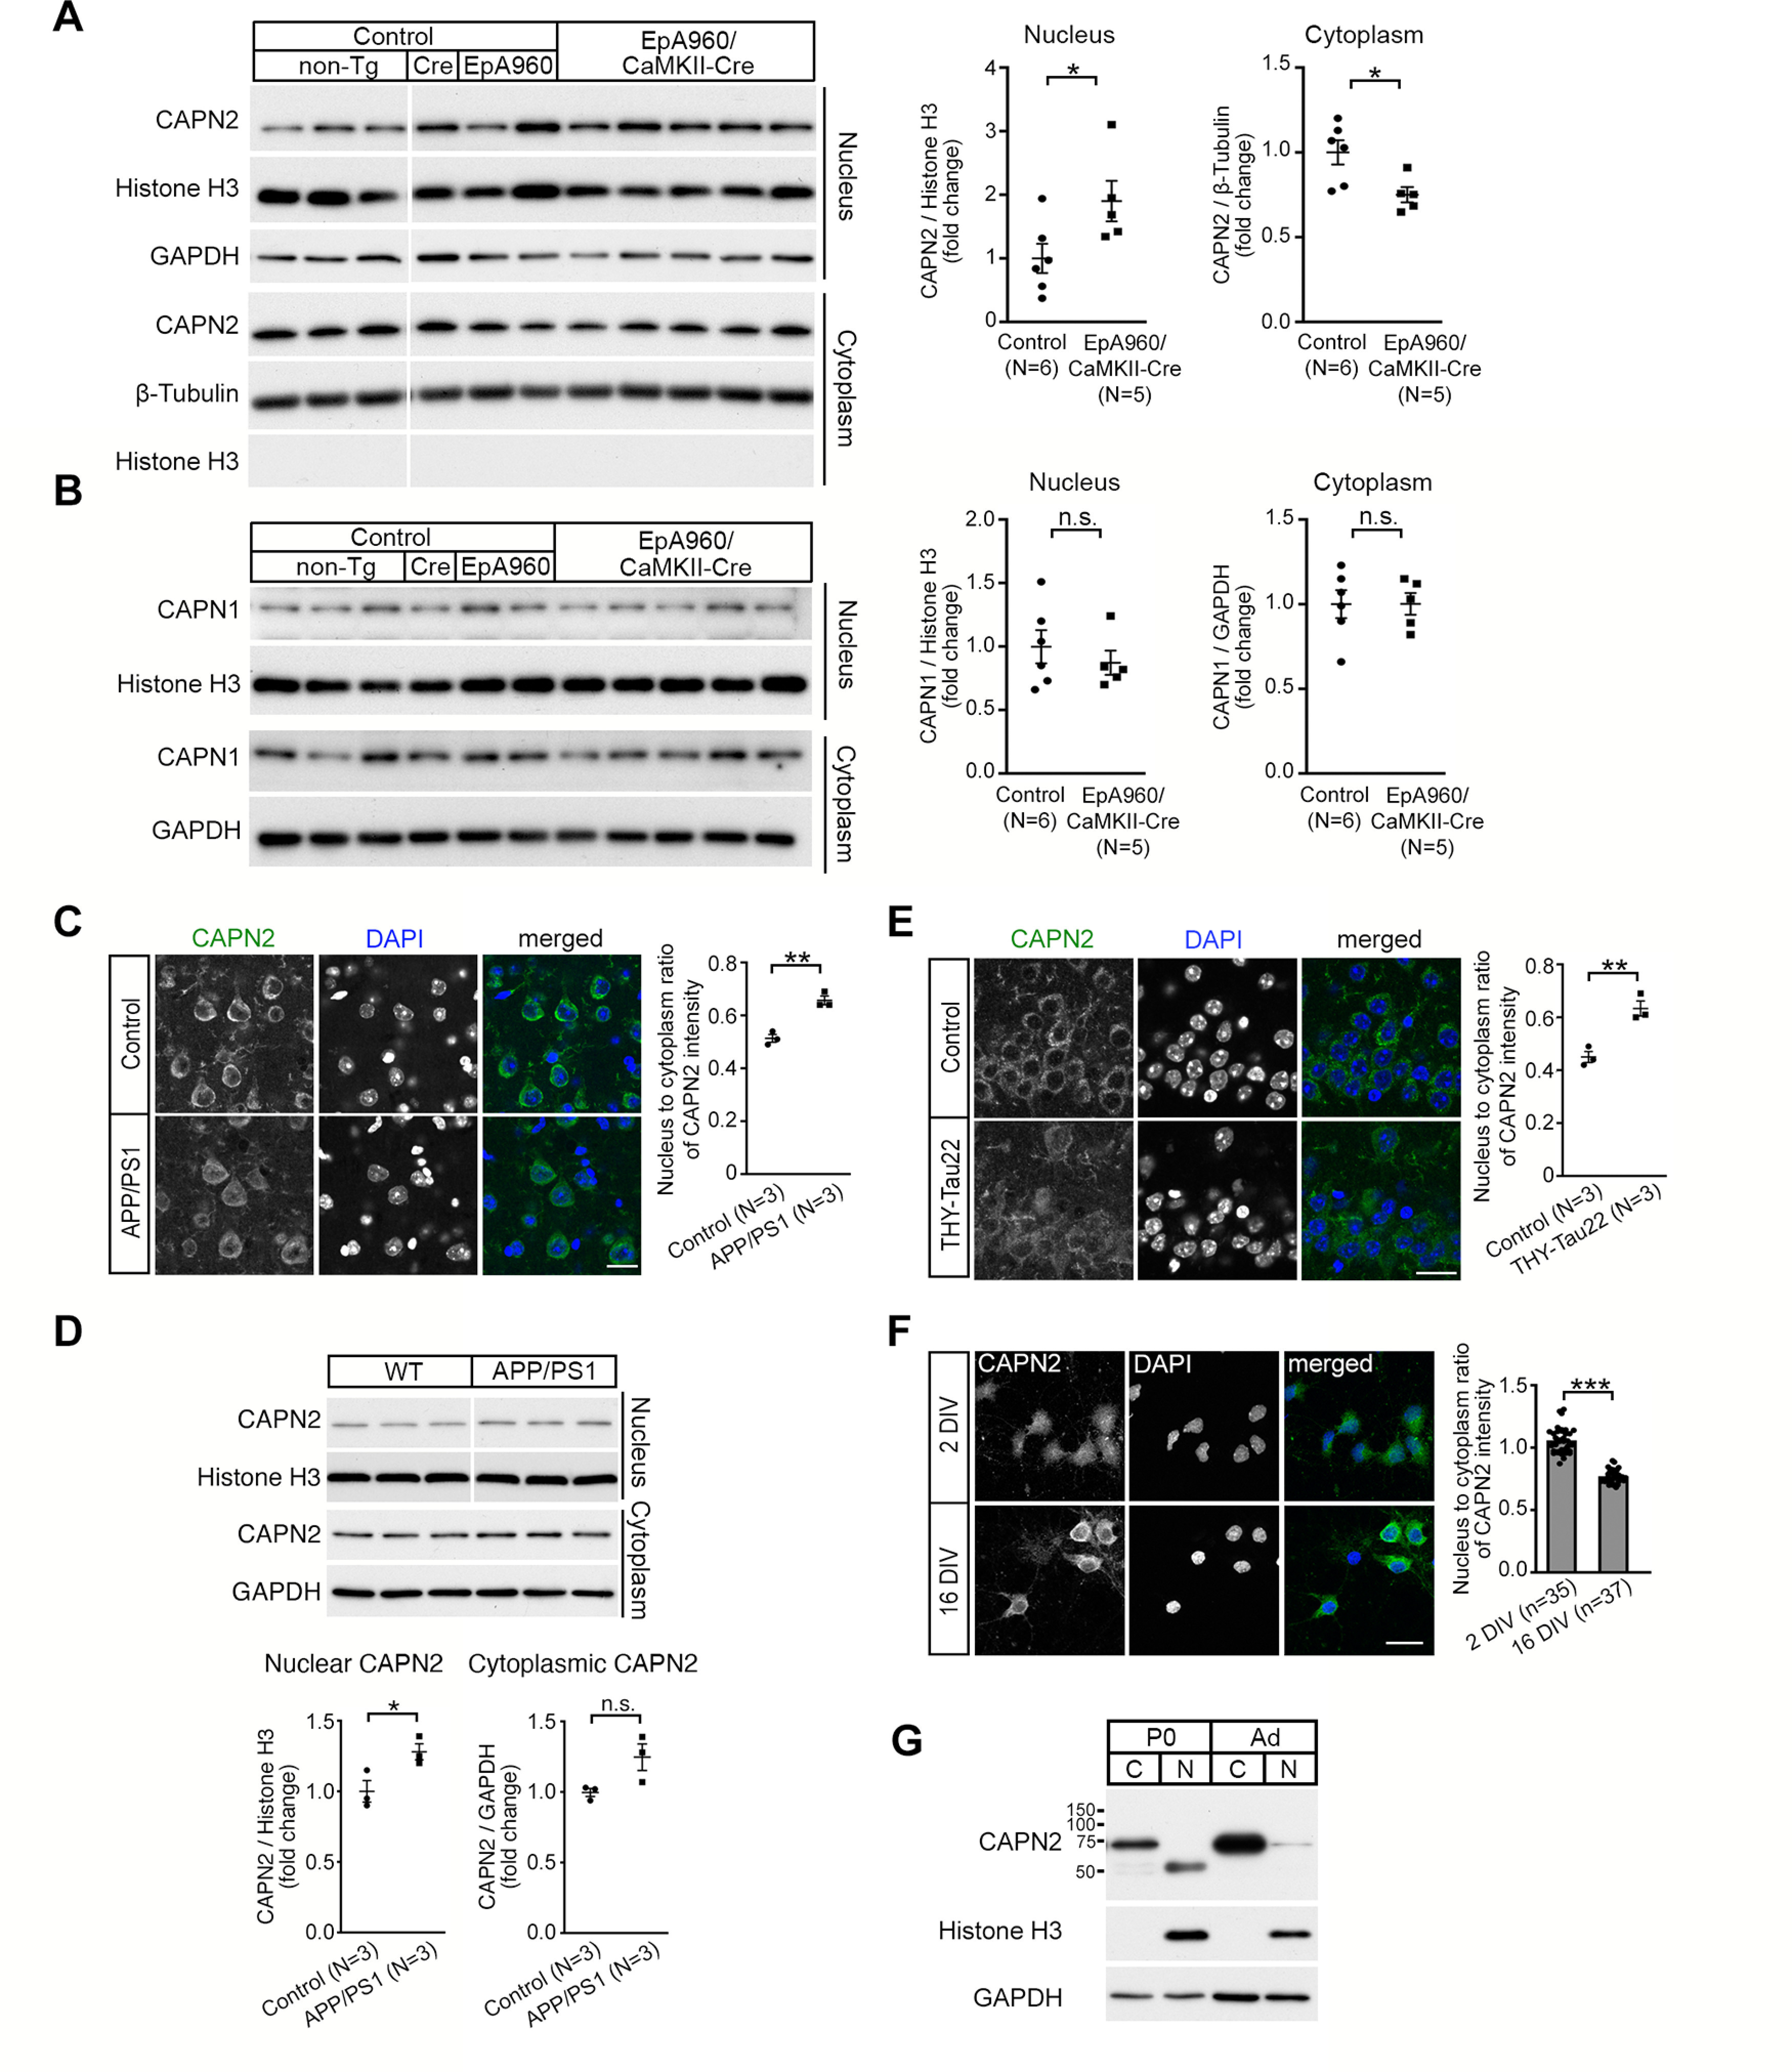
Increasing loss of structure and function of neurons and decline in cognitive function is commonly seen during the progression of neurologic diseases, although the causes and initial symptoms of individual diseases are distinct. This observation suggests a convergence of common degenerative features. In myotonic dystrophy type 1 (DM1), the expression of expanded CUG RNA induces neurotransmission dysfunction before axon and dendrite degeneration and reduced MBNL2 expression associated with aberrant alternative splicing. The role of loss of function of MBNL2 in the pathogenesis of neurodegeneration and the causal mechanism of neurodegeneration-reduced expression of MBNL2 remain elusive. Here, we show that increased MBNL2 expression is associated with neuronal maturation and required for neuronal morphogenesis and the fetal to adult developmental transition of RNA processing. Neurodegenerative conditions including NMDA receptor (NMDAR)-mediated excitotoxicity and dysregulated calcium homeostasis triggered nuclear translocation of calpain-2, thus resulting in MBNL2 degradation and reversal of MBNL2-regulated RNA processing to developmental patterns. Nuclear expression of calpain-2 resembled its developmental pattern and was associated with MBNL2 degradation. Knock-down of calpain-2 expression or inhibition of calpain-2 nuclear translocation prevented neurodegeneration-reduced MBNL2 expression and dysregulated RNA processing. Increased calpain-2 nuclear translocation associated with reduced MBNL2 expression and aberrant RNA processing occurred in models for DM1 and Alzheimer's disease (AD) including EpA960/CaMKII-Cre mice of either sex and female APP/PS1 and THY-Tau22 mice. Our results identify a regulatory mechanism for MBNL2 downregulation and suggest that calpain-2-mediated MBNL2 degradation accompanied by re-induction of a developmental RNA processing program may be a converging pathway to neurodegeneration.SIGNIFICANCE STATEMENT Neurologic diseases share many features during disease progression, such as cognitive decline and brain atrophy, which suggests a common pathway for developing degenerative features. Here, we show that the neurodegenerative conditions glutamate-induced excitotoxicity and dysregulated calcium homeostasis induced translocation of the cysteine protease calpain-2 into the nucleus, resulting in MBNL2 degradation and reversal of MBNL2-regulated RNA processing to an embryonic pattern. Knock-down or inhibition of nuclear translocation of calpain-2 prevented MBNL2 degradation and maintained MBNL2-regulated RNA processing in the adult pattern. Models of myotonic dystrophy and Alzheimer's disease (AD) also showed calpain-2-mediated MBNL2 degradation and a developmental RNA processing program. Our studies suggest MBNL2 function disrupted by calpain-2 as a common pathway, thus providing an alternative therapeutic strategy for neurodegeneration.

Keywords: Alzheimer's disease; MBNL2; RNA-processing; calpain-2; excitotoxicity; myotonic dystrophy.


Figures

Figure 1.
Figure 1.
MBNL2 is required for regulating neuronal morphogenesis and the developmental transition of RNA processing. A, Temporal expression of MBNL2 in the mouse forebrain. Protein lysates were prepared from mice at different ages including E14.5, P1, P8, P15, and P22 and two months (Ad). B, MBNL2 immunoreactivity with nuclear fast red used for nuclei labeling in the dentate gyrus of the P8 and P15 hippocampus. C, MBNL2 immunoreactivity in the cultured hippocampal neurons at 1, 8, 20 DIV. DAPI was used for nuclear staining. D, Knock-down of MBNL2 by specific shRNAs in the neurons. Cultured hippocampal neurons were infected with lentivirus carrying plasmids expressing MBNL2 shRNA (shMbnl2-1 or shMbnl2-2) or control shRNA (shLacZ). Quantification of the knock-down efficiency of MBNL2 (p < 0.0001 for both). E, MBNL2 knock-down impairs dendrite development. Neurons were transfected with plasmids expressing MBNL2 shRNA (shMbnl2-1 or shMbnl2-2) or control shRNA (pLAS.void). Plasmid expressing GFP was co-transfected to label neuronal morphology. Quantification of total dendrite length and primary dendrite number (p < 0.0001 for all). Number of neurons (n, from 3 independent cultured neuron preparations and transfections) used for quantification is indicated. F, Pattern of MBNL2-regulated RNA processing events including the Cacna1d exon 12a, Mapt exon 3/4 and 8 and distal (D) to proximal (P) poly(A) utilization of Sptb in neurons at 2 and 22 DIV. G, Temporal expression of Cacna1d-Ex12a+ (left) and Mapt-Ex3+ (right) mRNAs during development in the mouse forebrains. Total RNA was prepared from mice at different ages including E11.5, P1, P8, P15, and P22. Numbers shown represent relative quantification of Cacna1d-Ex12a+ and Mapt-Ex3+ mRNA levels to that in P8 after normalization to Gapdh level. H, Aberrant MBNL2-regulated RNA processing in Mbnl2-knock-down neurons. Representative gel images and the quantification of the inclusion of Cacna1d exon 12a (shMbnl2-1: p = 0.0082; shMbnl2-2: p = 0.0049), Mapt exons 3/4 (shMbnl2-1: p = 0.0072; shMbnl2-2: p = 0.0001) and 8 (shMbnl2-1: p = 0.0495; shMbnl2-2: p = 0.0232), and distal (D) to proximal (P) poly(A) utilization of Sptb (shMbnl2-1: p = 0.0012; shMbnl2-2: p = 0.0009). Three to five independent experiments were used for quantification. Data are mean ± SEM; *p < 0.05, **p < 0.01, ***p < 0.001, by one-way ANOVA with Tuckey's test (D, E, H). ML, molecular layer; GCL, granule cell layer; H, hilus. Scale bar: 200 µm (B), 50 µm (C), and 100 µm (E).
Figure 2.
Figure 2.
Neurodegeneration-reduced MBNL2 expression and aberrant MBNL2-reuglated splicing are detected in the mouse brains for AD. A, The intensity of MBNL2 immunoreactivity was reduced in cortical Layer V neurons of female APP/PS1 mice at age 12 months (p = 0.0022). Non-Tg animals at the same age were used as controls. B, Western blot analysis of MBNL2 expression in the nuclear and cytoplasmic fraction from the cortical region of the control (non-Tg) and APP/PS1 mice at age 10 months. Relative MBNL2 level in the nuclear and cytoplasmic fraction, normalized with Histone H3 and GAPDH, respectively, was quantified (Nucleus: p = 0.0322; Cytoplasm: p = 0.8609). C, Immunofluorescent staining of MBNL2 expression in the caudal CA1 neurons of female non-Tg (Control) and THY-Tau22 mice at age 15 months (p = 0.0318). D, The percentage of inclusion of Cacna1d exon 12a (p = 0.0093) and Mapt exons 3/4 (p = 0.0295) in the cortical tissues of APP/PS1 mice. E, The percentage of inclusion of Cacna1d exon 12a using RNA collected from the entire hippocampal tissues of THY-Tau22 mice (p = 0.8899). F, Quantification of the levels of exon 12a-containing Cacna1d (Cacna1d-Ex12a+) and exon 3-containing Mapt (Mapt-Ex3+) mRNA by RT-qPCR after normalization to Gapdh level using RNA collected from the CA1-enriched tissues of THY-Tau22 mice (Cacna1d-Ex12a+: p = 0.0284; Mapt-Ex3+: p = 0.0028). Number of animals (N) in each group is indicated. Data are mean ± SEM; *p < 0.05, **p < 0.01, by Student t test. n.s., not significant. Scale bar: 20 µm (A and C).
Figure 3.
Figure 3.
Glutamate-induced excitotoxicity reduces MBNL2 expression. A, B, Glutamate treatment for 3 h in neurons caused degeneration features including reduced level of NF160 (A) and condensed nuclei (B). C, MBNL2 level was reduced in mature cultured hippocampal neurons treated with glutamate for the indicated times. β-Tubulin was a loading control. Relative amount of MBNL2 for treatments was compared by normalization with β-tubulin (1 h: p = 0.0371; 2 h: p = 0.0026; 3 h: p = 0.0019). D, Representative images of MBNL2 immunoreactivity in neurons treated with vehicle or glutamate. NeuN staining was a neuronal marker. Quantification of overall MBNL2 intensity is shown at the right (p < 0.0001). Number of neurons (n, from 1 cultured neuron preparation) used for quantification is indicated. E, MBNL2 level was reduced in neurons treated with NMDA for the indicated times (1 h: p = 0.0220; 2 h: p = 0.0011; 3 h: p < 0.0001). F, Aberrant MBNL2-regulated RNA processing events in glutamate-treated or NMDA-treated neurons (for Cacna1d, Ex12a, glutamate: p = 0.0119; NMDA: p = 0.0455, for Mapt, Ex3/4, glutamate: p = 0.0323; NMDA: p = 0.0181, for Mapt, Ex8, glutamate: p = 0.0019; NMDA: p = 0.0006, for Sptb, poly(A) site, glutamate: p = 0.0015; NMDA: p = 0.0022). G, Pretreatment with calcium chelator EGTA preserved MBNL2 level in NMDA-treated neurons (NMDA: p = 0.0018; NMDA+EGTA: p = 0.0014). H, Immunofluorescent staining of MBNL2 expression and DAPI used for examining the nuclear morphology in the NeuN+ neurons. I, Effect of EGTA pretreatment on NF160 expression in the NMDA-treated neurons. Relative amount of NF160 was compared by normalization with β-tubulin (untreated vs NMDA: p < 0.0001; NMDA vs NMDA+EGTA: p < 0.0001; untreated vs NMDA+EGTA: p = 0.0052). J, Effect of EGTA pretreatment before NMDA stimulation on the splicing pattern of MBNL2-regulated RNA processing events (for Cacna1d, Ex12a, vehicle vs NMDA: p = 0.0004; NMDA vs NMDA+EGTA: p = 0.0020; vehicle vs NMDA+EGTA: p = 0.1301, for Mapt, Ex3/4, vehicle vs NMDA: p = 0.0433; NMDA vs NMDA+EGTA: p = 0.0204; vehicle vs NMDA+EGTA: p = 0.8062, for Mapt, Ex8, vehicle vs NMDA: p = 0.0055; NMDA vs NMDA+EGTA: p = 0.0109; vehicle vs NMDA+EGTA: p = 0.7879, for Sptb, poly(A) site, vehicle vs NMDA: p = 0.0132; NMDA vs NMDA+EGTA: p = 0.0302; vehicle vs NMDA+EGTA: p = 0.7621). Three to four independent experiments were used for quantification. Data are mean ± SEM; *p < 0.05, **p < 0.01, ***p < 0.001, by one-way ANOVA with Tuckey's test (C, EG, I, J) or Student t test (D). n.s., not significant. Scale bar: 20 µm (B), 50 µm (D), and 25 µm (H).
Figure 4.
Figure 4.
Calpain-2 is required for NMDAR-mediated MBNL2 degradation. A, RT-PCR detection of Mbnl2 mRNA in neurons treated with glutamate or NMDA. Gapdh was a loading control. Relative Mbnl2 mRNA level after normalization to Gapdh was shown at right (p = 0.4428, one-way ANOVA). B, MBNL2 level detected by immunoblotting in neurons treated with combinations of drugs as indicated (NMDA– vs NMDA+: p < 0.0001; NMDA+ vs MG132: p = 0.0001; NMDA+ vs lactacystin: p > 0.9999; NMDA+ vs calpain inh I: p = 0.0017; NMDA+ vs calpain inh III: p = 0.0004). C, Change in CAPN1 and CAPN2 protein levels in NMDA-treated neurons. Quantitative results of relative CAPN1 or CAPN2 level normalized to β-Tubulin were shown at right (CAPN1: p = 0.0037, N = 7; CAPN2: p < 0.0001, N = 5). D, The efficiency and specificity of CAPN1 and CAPN2 knock-down in cultured hippocampal neurons. Lentivirus expressing specific shRNAs to knock down Capn1 (shCapn1) or Capn2 (shCapn2) was introduced into cultured hippocampal neurons. Virus that expressed shLacZ or pLL3.7 was used as a control. β-Tubulin was used as a loading control. Relative CAPN1 and CAPN2 level normalized to β-tubulin is shown as indicated numbers. E, CAPN1 knock-down failed to prevent the reduction of MBNL2 level in NMDA-treated neurons (shLacZ vs shLacZ+NMDA: p < 0.0001; shLacZ+NMDA vs shCapn1+NMDA: p = 0.1259). F, CAPN2 knock-down preserved levels of MBNL2 and NF160 in NMDA-treated neurons (for MBNL2, pLL3.7 vs pLL3.7+NMDA: p = 0.0005; pLL3.7+NMDA vs shCapn2+NMDA: p < 0.0001, for NF160, p < 0.0001 for both). G, Knock-down of CAPN2 preserved the developmental RNA processing transition in NMDA-treated neurons (Cacna1d, Ex12a: vehicle vs shCapn2: p = 0.0249; vehicle vs NMDA: p = 0.0051; NMDA vs shCapn2+NMDA: p = 0.0444; vehicle vs shCapn2+NMDA: p = 0.0973; Mapt, Ex3/4, vehicle vs shCapn2: p = 0.0448; vehicle vs NMDA: p = 0.0448; NMDA vs shCapn2+NMDA: p = 0.0023; vehicle vs shCapn2+NMDA: p = 0.1749; Mapt, Ex8: vehicle vs shCapn2: p = 0.7697; vehicle vs NMDA: p = 0.0001; NMDA vs shCapn2+NMDA: p = 0.0217; vehicle vs shCapn2+NMDA: p = 0.0056; Sptb, poly(A) site, vehicle vs shCapn2: p = 0.0017; vehicle vs NMDA: p = 0.0110; NMDA vs shCapn2+NMDA: p = 0.0017; vehicle vs shCapn2+NMDA: p = 0.4494). Three to four independent experiments were used for quantification. Data are mean ± SEM; *p < 0.05, **p < 0.01, ***p < 0.001, by one-way ANOVA with Tuckey's test (B, E–G) or student t test (C). n.s., not significant.
Figure 5.
Figure 5.
Nuclear translocation of calpain-2 is calcium-dependent and required for MBNL2 degradation. A, Subcellular distribution of endogenous CAPN2 in mature hippocampal neurons by biochemical fractionation (left) and immunofluorescence staining (right). B, NMDA treatment increased the nuclear fraction of CAPN2. Quantification of nucleus-to-cytoplasm ratio of CAPN2 immunoreactivity at right (p < 0.0001). Number of neurons (n, from 1 cultured neuron preparation) used for quantification is indicated. C, Nuclear and cytoplasmic distribution of CAPN2 and MBNL2 in neurons treated with NMDA for the indicated times (for CAPN2 nucleus, 1 h: p = 0.0233; 2 h: p = 0.0014; 3 h: p = 0.0288, for CAPN2 cytoplasm, 1 h: p = 0.6990; 2 h: p = 0.0032; 3 h: p = 0.0098, for MBNL2 nucleus, p < 0.0001 for all, for MBNL2 cytoplasm, 1 h: p = 0.0311; 2 h: p = 0.0001; 3 h: p < 0.0001). D, CAPN2 knock-down preserved MBNL2 expression in both nuclear and cytoplasmic fractions of NMDA-treated neurons (for nucleus, pLL3.7 vs pLL3.7+NMDA: p < 0.0001; pLL3.7+NMDA vs shCapn2+NMDA: p = 0.0001, for cytoplasm, pLL3.7 vs pLL3.7+NMDA: p = 0.0013; pLL3.7+NMDA vs shCapn2+NMDA: p < 0.0001). E, Pretreatment with EGTA inhibits the nuclear translocation of CAPN2 in NMDA-treated neurons (for nucleus, untreated vs NMDA: p = 0.0225; NMDA vs NMDA+EGTA: p = 0.0192, for cytoplasm, untreated vs NMDA: p = 0.0414; NMDA vs NMDA+EGTA: p = 0.0003). F, Representative images of Myc and MBNL2 immunoreactivity in neurons transfected with GW1-myc (top), Myc-CAPN2 (middle), or NLS-Myc-CAPN2-NLS (bottom). Quantification of intensity of nuclear MBNL2 immunoreactivity in neurons transfected with the indicated constructs was shown at right (GW1-Myc vs Myc-CAPN2: p = 0.8074; Myc-CAPN2 vs NLS-Myc-CAPN2-NLS: p = 0.0027; GW1-Myc vs NLS-Myc-CAPN2-NLS: p = 0.0003). Number of neurons (n, from 3 independent cultured neuron preparations and transfections) used for quantification is indicated. Histone H3 and GAPDH were loading controls for nuclear and cytoplasmic fractions, respectively (A, CE). Quantification of cytoplasmic and nuclear fractions of CAPN2 and MBNL2 relative to loading controls is shown (C–E). Three to five independent experiments were used for quantification. Data are mean ± SEM; *p < 0.05, **p < 0.01, ***p < 0.001, by one-way ANOVA with Tuckey's test (C–F) or Student t test (B). n.s., not significant. Scale bar: 25 µm (A), 20 µm (B), and 5 µm (F).
Figure 6.
Figure 6.
Dysregulated calcium homeostasis causes calpain-2 nuclear translocation and reduces MBNL2 expression. A, Detection of MBNL2 and CAPN2 levels in the nuclear and cytoplasmic fractions of A23187-treated neurons with or without pretreatment of ivermectin. For nuclear and cytoplasmic fractions, Histone H3 and GAPDH were used as loading controls, respectively. Quantification of cytoplasmic and nuclear fractions of CAPN2 and MBNL2 relative to loading controls is shown (for MBNL2 nucleus, untreated vs A23187: p = 0.0047; A23187 vs A23187+Ivermectin: p = 0.0035, for MBNL2 cytoplasm, untreated vs A23187: p = 0.0417; A23187 vs A23187+Ivermectin: p = 0.0452, for CAPN2 nucleus, untreated vs A23187: p = 0.0079; A23187 vs A23187+Ivermectin: p = 0.0118, for CAPN2 cytoplasm, untreated vs A23187: p = 0.0051; A23187 vs A23187+Ivermectin: p = 0.0069). B, CAPN2 knock-down prevented MBNL2 reduction in A23187-treated neurons (pLL3.7 vs pLL3.7+NMDA: p = 0.0001; pLL3.7+NMDA vs shCapn2+NMDA: p = 0.0018; pLL3.7 vs shCapn2+NMDA: p = 0.0154). C, Effect of CAPN2 knock-down on MBNL2-regulated splicing events in the A23187-treated neurons. Quantification of relative percentage of inclusion (Cacna1d, Ex12a: vehicle vs A23187: p = 0.0009; A23187 vs shCapn2+A23187: p ≤ 0.0001; vehicle vs shCapn2+A23187: p ≤ 0.0001; Mapt, Ex3/4, vehicle vs A23187: p = 0.9988; A23187 vs shCapn2+A23187: p = 0.0065; vehicle vs shCapn2+A23187: p = 0.0068; Mapt, Ex8: p = 0.7251). Three independent experiments were used for quantification. Data are mean ± SEM; *p < 0.05, **p < 0.01, ***p < 0.001, by one-way ANOVA with Tuckey' test (A–C). n.s., not significant.
Figure 7.
Figure 7.
Increased level of nuclear CAPN2 is observed in the DM1 and AD mouse brains. A, B, CAPN2 (A, nucleus: p = 0.0303; cytoplasm: p = 0.0173) and CAPN1 (B, nucleus: p = 0.4716; cytoplasm: p = 0.9857) content in nuclear and cytoplasmic fractions of lysates from the cortical regions of control and EpA960/CaMKII-Cre brains at age 12–16 months. Brains from animals with different genotypes including non-Tg, CaMKII-Cre (Cre) and EpA960 brains were controls. Same lysates were used for detecting CAPN2 (A) and CAPN1 (B). GAPDH and histone H3 were used as loading controls for the cytoplasmic and nuclear fraction, respectively. C, Representative images of CAPN2 immunostaining in the cortical Layer V of brain sections from non-Tg control and APP/PS1 mice at age 12 months (p = 0.0029). D, The level of nuclear and cytoplasmic CAPN2 in the cortex of non-Tg control and APP/PS1 mice at age 10 months. Quantification of relative CAPN2 expression in the nuclear (p = 0.0424) and cytoplasmic (p = 0.0634) fractions, normalized with Histone H3 and GAPDH, respectively. Same lysates were used for detecting MBNL2 (Fig. 2B) and CAPN2. E, Representative images of CAPN2 immunostaining in the CA1 region of sections from non-Tg control and THY-Tau22 mice at age 15 months (p = 0.0065). F, Representative images of CAPN2 immunoreactivity in neurons at 2 and 16 DIV (p < 0.0001). G, CAPN2 expression in the cytoplasmic (C) and nuclear (N) fraction from the cortex of neonatal (P0) and adult (Ad) wild-type mice. Nucleus-to-cytoplasm ratio of CAPN2 immunoreactivity is quantified and shown at right (C, E, F). Number of animals (N) or neurons (n, from 1 cultured neuron preparation) used for quantification is indicated. Data are mean ± SEM; *p < 0.05, **p < 0.01, ***p < 0.001, by Student t test. n.s., not significant. Scale bar: 20 µm (C, E, F).

Similar articles

Cited by

References

    1. Bangru S, Arif W, Seimetz J, Bhate A, Chen J, Rashan EH, Carstens RP, Anakk S, Kalsotra A (2018) Alternative splicing rewires Hippo signaling pathway in hepatocytes to promote liver regeneration. Nat Struct Mol Biol 25:928–939. 10.1038/s41594-018-0129-2 - DOI - PMC - PubMed
    1. Bartlett WP, Banker GA (1984) An electron microscopic study of the development of axons and dendrites by hippocampal neurons in culture. I. Cells which develop without intercellular contacts. J Neurosci 4:1944–1953. - PMC - PubMed
    1. Batra R, Charizanis K, Manchanda M, Mohan A, Li M, Finn DJ, Goodwin M, Zhang C, Sobczak K, Thornton CA, Swanson MS (2014) Loss of MBNL leads to disruption of developmentally regulated alternative polyadenylation in RNA-mediated disease. Mol Cell 56:311–322. 10.1016/j.molcel.2014.08.027 - DOI - PMC - PubMed
    1. Baudry M, Bi X (2016) Calpain-1 and calpain-2: the yin and yang of synaptic plasticity and neurodegeneration. Trends Neurosci 39:235–245. 10.1016/j.tins.2016.01.007 - DOI - PMC - PubMed
    1. Bayer SA (1980) Development of the hippocampal region in the rat. I. Neurogenesis examined with 3H-thymidine autoradiography. J Comp Neurol 190:87–114. 10.1002/cne.901900107 - DOI - PubMed

Publication types