. 2022 May 23;13(1):2862.
doi: 10.1038/s41467-022-30405-5.

Origins of direction selectivity in the primate retina

Affiliations

Origins of direction selectivity in the primate retina

Yeon Jin Kim et al. Nat Commun. .

Abstract

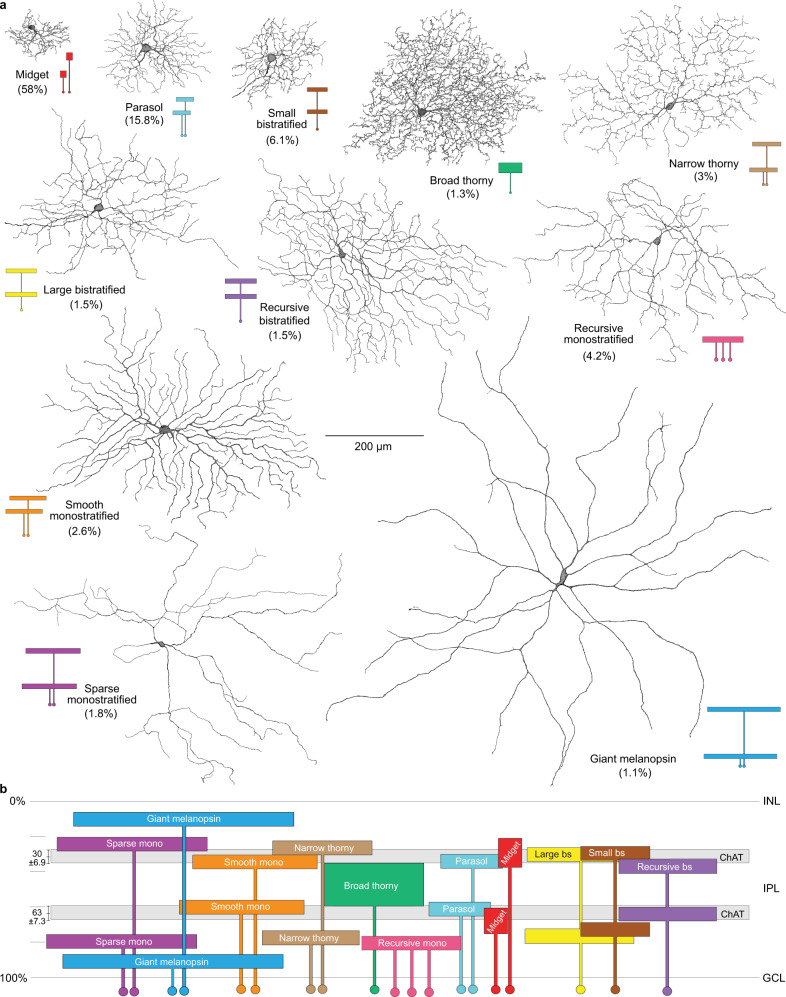
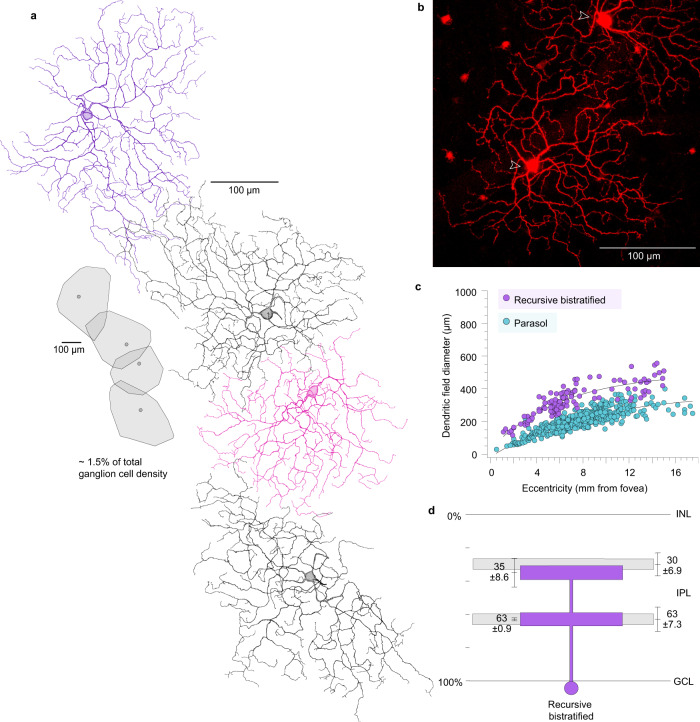
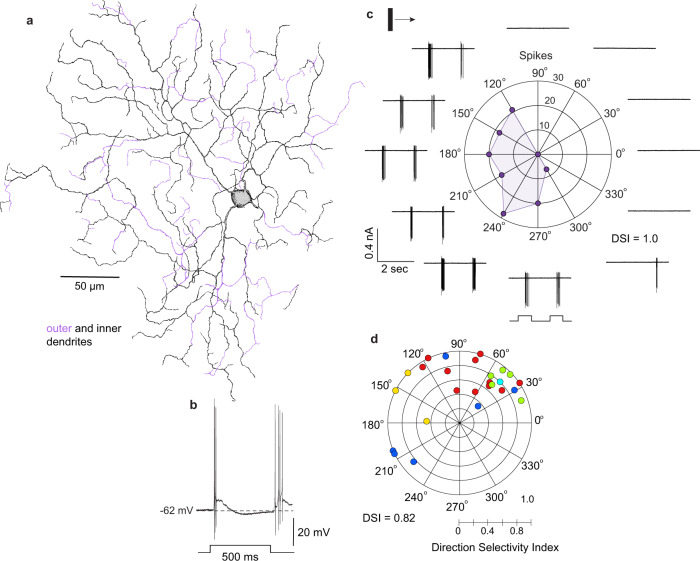
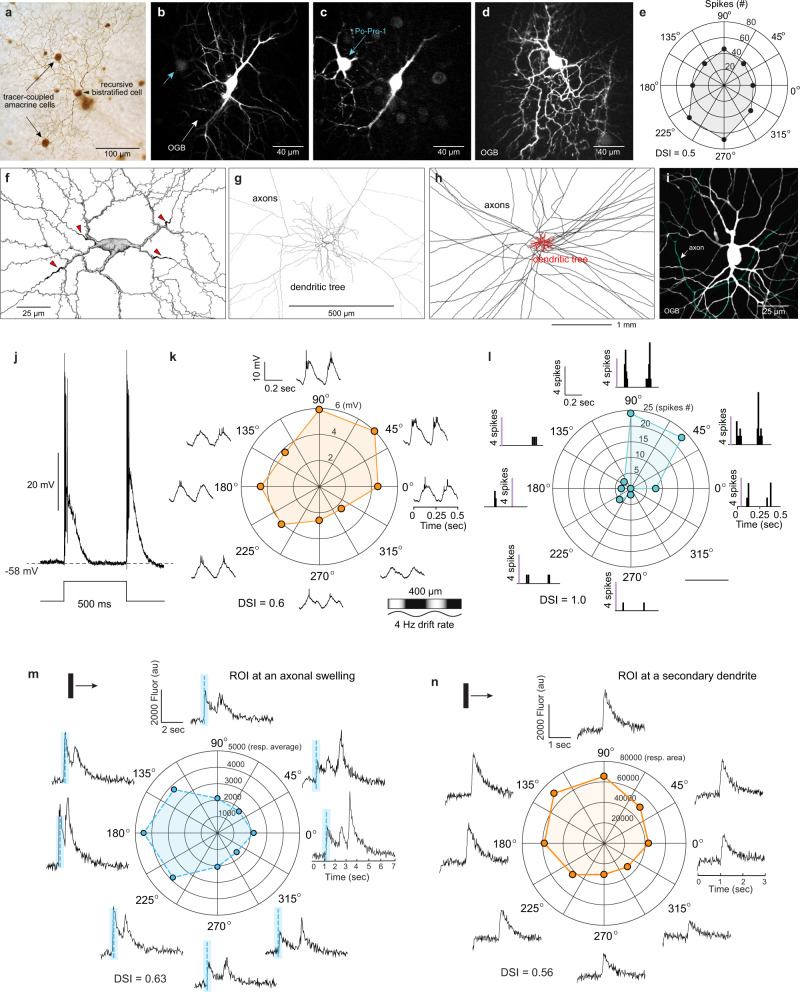
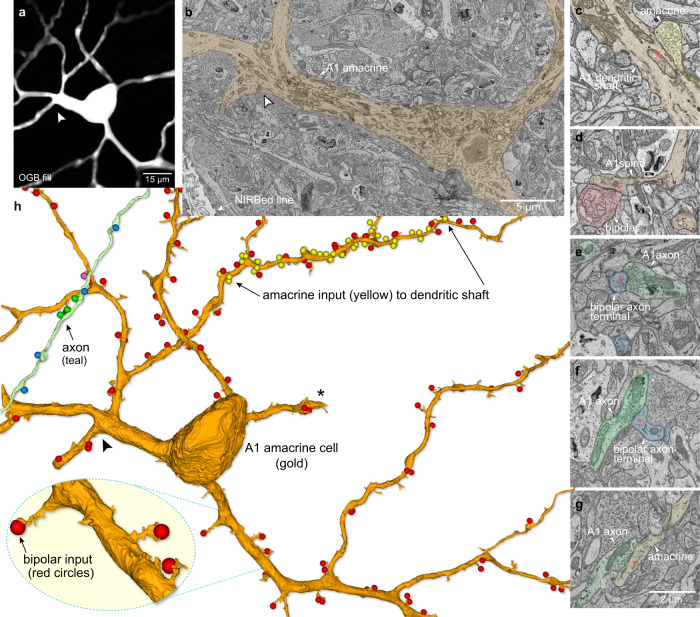
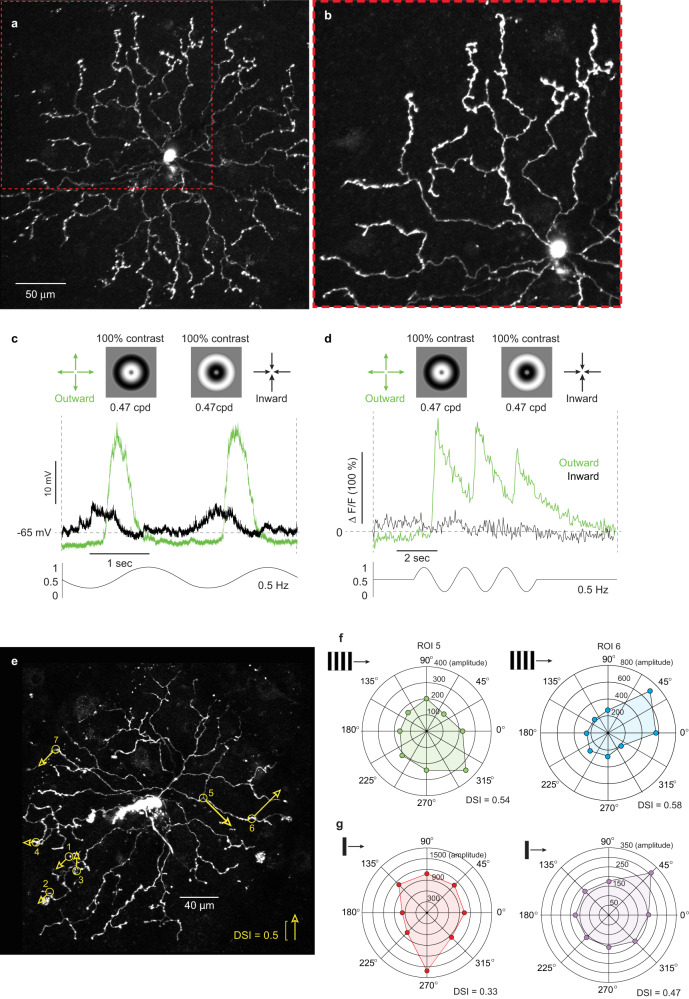
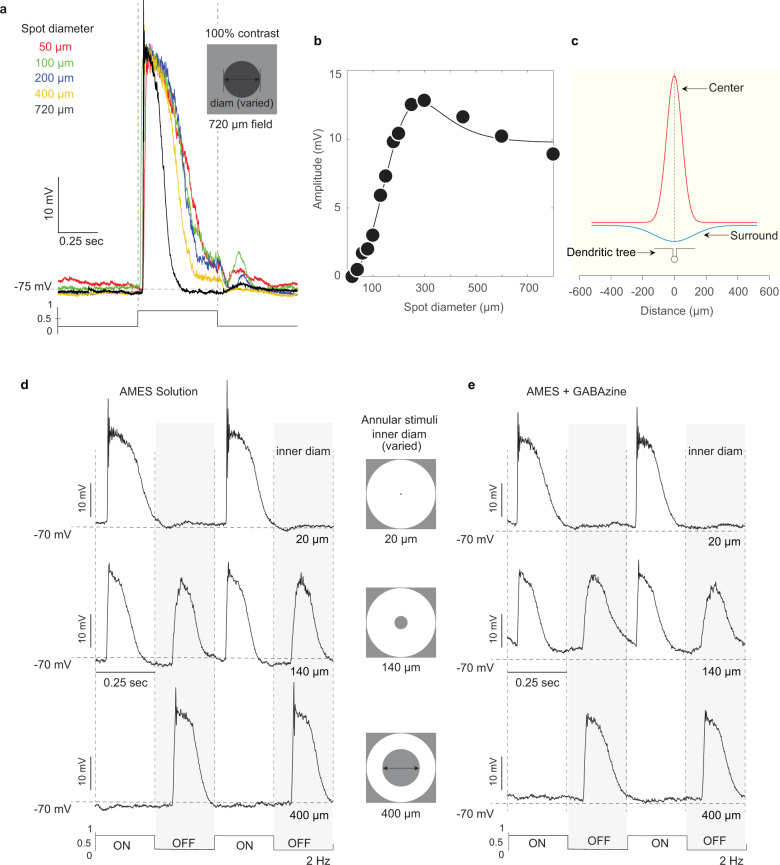
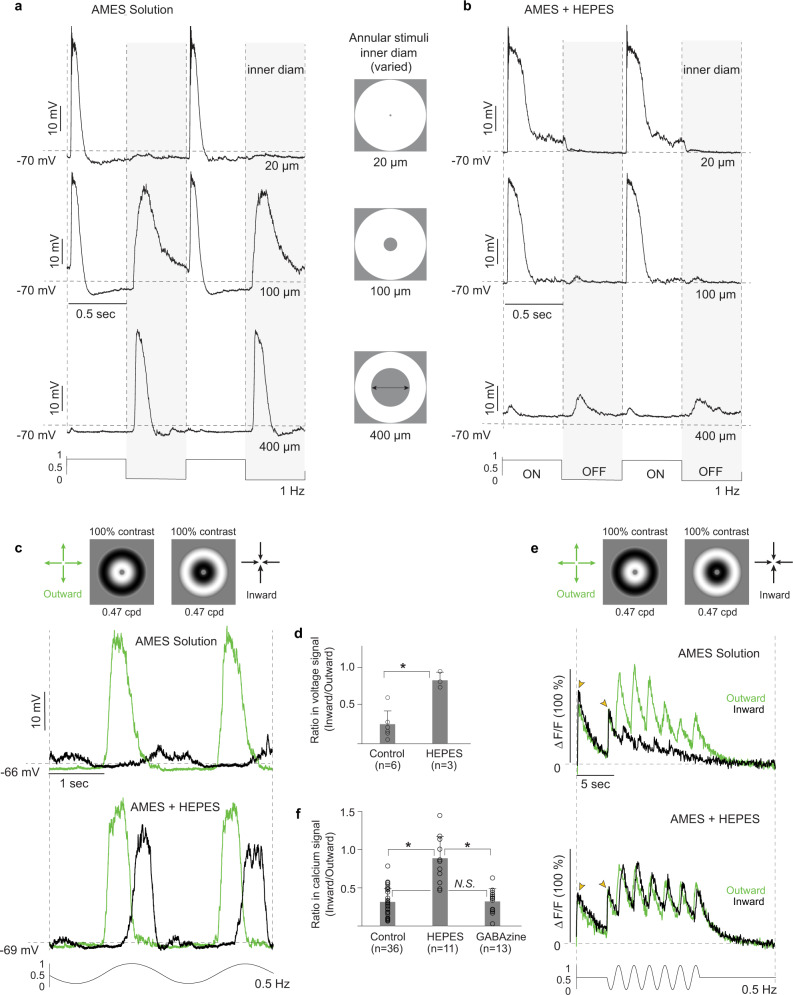
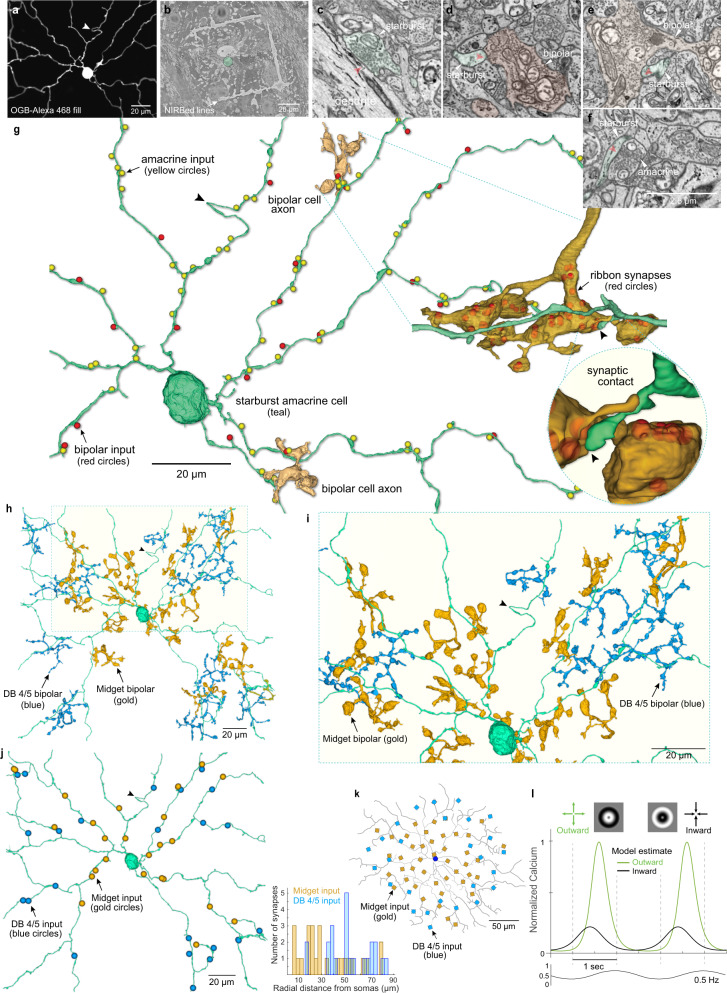
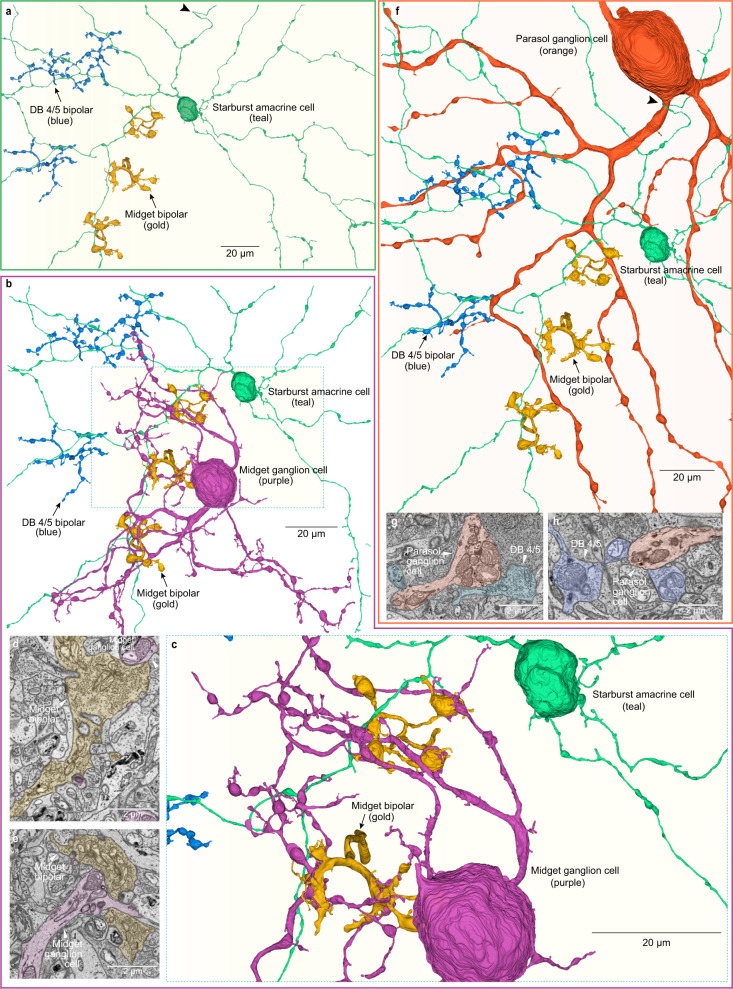
From mouse to primate, there is a striking discontinuity in our current understanding of the neural coding of motion direction. In non-primate mammals, directionally selective cell types and circuits are a signature feature of the retina, situated at the earliest stage of the visual process. In primates, by contrast, direction selectivity is a hallmark of motion processing areas in visual cortex, but has not been found in the retina, despite significant effort. Here we combined functional recordings of light-evoked responses and connectomic reconstruction to identify diverse direction-selective cell types in the macaque monkey retina with distinctive physiological properties and synaptic motifs. This circuitry includes an ON-OFF ganglion cell type, a spiking, ON-OFF polyaxonal amacrine cell and the starburst amacrine cell, all of which show direction selectivity. Moreover, we discovered that macaque starburst cells possess a strong, non-GABAergic, antagonistic surround mediated by input from excitatory bipolar cells that is critical for the generation of radial motion sensitivity in these cells. Our findings open a door to investigation of a precortical circuitry that computes motion direction in the primate visual system.


Conflict of interest statement

The authors declare no competing interests.

Figures

Fig. 1
Fig. 1. Summary of the morphology, stratification and relative spatial densities 19 ganglion cell populations in macaque retina.
a Macaque ganglion cells divided into 11 distinctive morphological groups by dendritic structure, dendritic tree diameter, and mosaic tiling (see Supplementary Fig. 1 for details). These morphological groups bear names that arose historically (midget, parasol) or more recently, and related to specific morphological features of newly identified types (e.g., broad thorny ganglion cells show a unique broad dendritic stratification and fine, thorn-covered dendrites. The color inserts show schematically the cell body (small circle) and dendritic arbor of each cell type indicating how some groups (e.g., midget and parasol) have been further subdivided into types based on stratification within the inner plexiform layer (IPL). Percentages indicate estimated % of total ganglion cell density for that group. The number of types within each named morphological group are indicated by the number of cell bodies associated either with dendrites that stratify at different depths in the IPL (or in the single case of the recursive monostratified cells the same depth). This results in a total of 19 ganglion cell populations that together comprise ~97% of the total ganglion cell population in the peripheral retina (see also Supplementary Fig. 1 and Supplementary Table 1). b Stratification depth in the IPL summarized schematically for all cell types in relationship to the outer and inner choline acetyltransferase (Chat) immunolabeled strata formed by the dendrites of starburst amacrine cells (gray bands) as indicated (see Supplementary Figs. 1 and 3 for details).
Fig. 2
Fig. 2. Dendritic morphology and field size, spatial density, and stratification depth of recursive bistratified ganglion cells in the macaque monkey retina.
Recursive bistratified cells comprise ~1.5% of total ganglion cells in the retinal periphery (dendritic field coverage = 1.3; see Supplementary Fig. 1 for details) and were retrogradely labeled and photostained in vitro from injections of rhodamine dextran made into the Lateral Geniculate Nucleus (LGN) and Superior Colliculus (SC). a Camera Lucida tracings of four photostained cells at ~7 mm retinal eccentricity from tracer injections in the superior colliculus; inset, outlines around dendritic perimeters for each of the four cells indicates regular spacing and little dendritic field overlap. b Photomicrograph of a recursive bistratified cell photostained in the in vitro retina after retrograde transport of rhodamine dextran permits precise targeting of this cell type for physiological study. c Dendritic field diameter of low-density recursive bistratified ganglion cells (purple circles) plotted as a function of retinal eccentricity (n = 122; mean ± s.d. = 327 ± 93; range = 117–557 µm); is large relative to a sample of LGN-projecting parasol ganglion cells, shown for comparison (blue circles). d Stratification depth of inner and outer recursive bistratified cell dendrites indicates costratification with the choline acetyltransferase immunolabeled strata (n = 3; see also Supplementary Fig. 1f). Data are shown as mean ± s.d.; n number of cells.
Fig. 3
Fig. 3. The recursive bistratified ganglion cell is an ON–OFF direction-selective type.
a Dendritic morphology of a recursive bistratified ganglion cell in macaque retina retrogradely labeled and photostained in vitro after rhodamine dextran tracer injections in the LGN. b ON–OFF response evoked by a 500 ms light step in a recursive bistratified cell targeted for whole-cell current-clamp recording identified by tracer coupling from an A1 amacrine cell (see Fig. 4 for details). c Polar plot of extracellularly recorded spike activity evoked by a bar of light (100 µm width, 600 µm height) moving (2000 µm/s) across the cell’s receptive field. Spikes were summed from separate bursts of spikes evoked by 2 sweeps of the bar stimulus. d Plot showing Direction Selectivity Index (DSI) and preferred direction of spike activity evoked by a moving bar in 26 recursive bistratified ganglion cells extracellularly recorded from 5 different (color coded) retrogradely labeled retinas. The mean DSI ± s.d. of this data set was 0.82 ± 0.20 (n = 26). The stimulus parameters (bar dimensions, velocity, and contrast) were not standardized across all experiments, which may contribute to the cell-to-cell differences in DSI.
Fig. 4
Fig. 4. The recursive bistratified ON–OFF direction-selective ganglion cell is tracer coupled to the A1 amacrine cell, a polyaxonal, ON–OFF spiking cell type that also shows direction selectivity.
a A recursive bistratified ganglion cell (arrowhead; Neurobiotin fill) shows tracer coupling to the A1 amacrine-cell (arrows). b A1 amacrine cell (dye fill with OGB and Po-Pro-1) showing excitation of the OGB (488 nm). c Po-Pro-1 excitation (420 nm) a tracer-coupled ganglion cell is evident in the same field (blue-arrow). d OGB filling of a ganglion cell tracer coupled to another A1 amacrine corresponds to the recursive bistratified type. e Direction-selective response (intracellularly recorded spikes, DSI = 0.5) of cell shown in (d). f Drawing of an A1 amacrine cell shows the origin of four axon-like processes from proximal dendrites (red arrowheads). g The axon-like processes extend widely beyond the dendritic tree. h At lower magnification the full extent of the axon-like arbor (black) relative to the dendritic tree (red) is shown (Neurobiotin fills; f, g drawings modified from previously published anatomical descriptions of the A1 cell,). i OGB fill of an A1 cell in vitro illustrates how the axonal component (pseudo-colored blue–green) is distinguished from the main dendrites for functional calcium imaging. j The A1 cell responds transiently at light ONset and OFFset with large, ~60 mV spikes. Direction-selective changes in membrane voltage (peak to peak amplitude, mV) (k) and spike count (l) in the same cell in response to a sinusoidal drifting grating (4 Hz drift rate, 200 µm cycle period; 100% contrast). Peak to peak amplitude (mean DSI ± s.d. = 0.7 ± 0.21; n = 5) and total spike count (mean DSI ± s.d. = 0.47 ± 0.34; n = 12). Direction-selective calcium responses evoked by moving bar stimuli from A1 axon (m) and dendrite (n). For m (axonal swelling), the stimulus was a bright bar (500w × 1000 h; velocity 1000 µm/s; contrast 100%, (DSI = 0.63); 0.47 ± 0.10 (range = 0.28– 0.63), n = 11 axon ROIs). For n (dendrite), the stimulus was a faster moving, lower contrast bar (100w × 700 h, velocity 8000 µm/s contrast 60%, (DSI = 0.56); 0.41 ± 0.15, (range = 0.22–0.63, n = 9 dendrite ROIs).
Fig. 5
Fig. 5. The spiking ON–OFF A1 cell shows complete polarization of synaptic inputs and outputs.
a Proximal dendritic morphology of a physiologically identified A1 amacrine cell, dye-filled (OGB + Alexa 468); 2P-confocal image; arrowhead points to the same dendritic location in a, b, h. b Ultrastructure of primary dendrites of A1 cell (tan fill) shown in a, with cell body protruding into the inner plexiform layer (IPL) confirms identification of this cell in EM tissue volume; partial view of NIRBed line at lower left (arrow). c A1 cell dendritic shaft (tan) receiving an inhibitory synapse (yellow, red arrowhead). d A1 cell dendritic spine (tan) receives a ribbon synapse (red arrowhead) from a bipolar-cell axon terminal (pink). e, f A1 cell axon-like process (teal) synapses on a bipolar-cell axon terminal (blue, red arrowheads) at 2 different locations; synapses from bipolar cells to A1 amacrine-cell axon-like processes were not observed. g A1 cell axon-like process synapses (teal, red arrowhead) on an amacrine cell process (yellow). The scale bar applies cf. h Reconstruction of proximal dendrites and axon segment for A1 cell shown in a, illustrates that synaptic inputs from bipolar-cell ribbon contacts (red balls) were made primarily to the dendritic spines that arose from dendritic shafts (see inset lower left). By contrast, dense inhibitory synaptic inputs from other amacrine cells were made directly upon the dendritic shafts. Location of amacrine inputs to one segment of a secondary dendrite (between arrows) is indicated by the yellow ball structures. Reconstruction of a segment from the axon-like arbor (teal process at upper left) reveals synaptic output from varicosities primarily to bipolar-cell axon terminals (blue balls) but also to amacrine-cell processes (green balls) and to a ganglion cell dendrite (magenta ball). See also Supplementary Fig. 4.
Fig. 6
Fig. 6. Morphological identification and direction selectivity of macaque starburst amacrine cells.
a Starburst amacrine cell targeted for patch-clamp recording in the in vitro retina and filled with the calcium indicator Oregon Green Bapta-488 (OGB). The thin primary and secondary dendrites and distinct varicose dendritic terminals create a radially symmetric, nearly circular dendritic tree, a feature common to starburst cells of other non-primate mammals (max intensity z-projection from 2P-confocal image stack). b Magnified view of boxed area (red dotted line) illustrates the characteristic extremely thin primary and secondary dendrites and the thicker, complex varicose terminal dendrites. c Somatic intracellular voltage recording of another starburst cell shows selectivity to radial outward motion using an expanding (green trace) or contracting (black trace) radial-grating stimulus; 2 stimulus cycles shown (100% contrast; 0.24 cycles/degree of visual angle; 0.5 Hz temporal frequency; n = 6; inward/outward = 0.26 ± 0.17). d Calcium response, 2 P optically imaged ROIs at the terminal dendrites of another starburst cell also show selectivity to radial outward motion; 3 stimulus cycles shown (n = 36 ROIs; inward/outward = 0.32 ± 0.18). Macaque starburst cell dendrites also showed direction selectivity to both moving bars and drifting square wave gratings. e Max intensity z-projection of OGB-488 filled starburst in vitro; locations of 7 dendritic ROIs are indicated by the yellow circles; arrows indicate preferred direction and arrow length indicates direction-selective strength (peak amplitude, mean of 3 stimulus cycles to drifting square-wave gratings (0.47 cycles/deg, 0.5 Hz) at 8 orientations; n = 7 ROIs; 0.29 ± 0.20; range = 0.15–0.58 DSI). f Polar plots of the optically imaged calcium response of 2 ROIs (5 and 6) from the cell shown in (e). g Examples of two additional polar plots for dendritic ROIs for two additional cells using drifting bars (bar w x h = 200 × 700 µm, 4000 µm/s) to measure directional tuning (n = 12 ROIs from 7 cells; mean ± s.d. = 0.37 ± 0.17, range = 0.12–0.76 DSI).
Fig. 7
Fig. 7. Macaque starburst amacrine cells show center-surround receptive-field structure that is insensitive to GABAa receptor antagonists.
a Starburst whole-cell current-clamp recording (cell imaged in Supplementary Fig. 5e) shows a resting membrane potential ~75 mV on a high photopic background (~ 105 photoisomerizations/cone/sec) and large amplitude depolarizing response (~40 mV) to 0.5 s, 100% contrast, square wave pulse stimulus. With increasing spot diameter (inset at top; 50–720 µm diameter; color coded) the response becomes more transient (black trace, 720 µm diam spot) and the sustained response component is lost. A characteristic feature of the starburst response to this stimulus is a large, spike-like transient that appears as the stimulus is enlarged to fill the receptive-field center. b, c Starburst spatial tuning (100% sinusoidal contrast modulation of spots of varied diameter at 2 Hz), fit with a center-surround Difference-of-Gaussians receptive-field model (line fit to data; n = 27 cells; center diam, 208 ± 76; surround diam, 360 ± 156); 2D profile of model fit is shown in c; small icon shows starburst soma and dendritic tree at same scale as model. d Surround response isolated by annular stimuli; increasing the inner diameter of the annulus from 20 to 400 µm (icons at center; top to bottom panels; 2 Hz square wave modulation) eliminates the ON-center depolarization (top panel) and isolates a pure OFF-surround depolarization (bottom panel). e Surround OFF depolarization is not eliminated by bath application of GABAa receptor antagonist (SR 95331(GABAzine); 10 µM; n = 4; 8 ± 3% reduction).
Fig. 8
Fig. 8. The starburst amacrine surround is attenuated by HEPES buffer.
a The same annulus stimulus protocol as shown in Fig. 7d (except that temporal modulation is 1 Hz) was used to isolate the surround mediated OFF response (top vs bottom traces; OFF response shaded). b HEPES buffer enrichment of Ames’ medium greatly attenuates the surround OFF depolarization (top vs bottom traces, OFF response shaded) (20 mM HEPES; pH 7.3; n = 6; 83 ± 41 % reduction); c Top trace; somatic voltage response to radial motion (same protocol as Fig. 6c) in AMES solution shows strong preference for outward motion. Bottom trace, voltage response to radial motion in AMES with HEPES buffer enrichment (20 mM HEPES; pH 7.3). HEPES attenuates the preference for outward motion of radial-grating stimuli by increasing the response to inward motion. d Histogram plots inward/outward response ratio for control (n = 6) and HEPES (n = 3) application (unpaired t-test: t(8) = −3.3884, *p = 0.0095, Cohen’s d = 3.76). Data are shown as mean ± s.d.; n, number of cells; N.S., no significant difference (p > 0.05). e Top trace, dendritic calcium response to radial motion stimulus; ROI at terminal dendrite; stimulus protocol as in c (see also Fig. 6d); 6 stimulus cycles are shown. Bottom trace, HEPES application again increases response to inward motion and eliminates outward motion preference. f Histogram plots inward/outward response ratio for control (n = 36), HEPES (n = 11) and GABAzine (n = 13) application. HEPES (Games-Howell post hoc test: *p = 0.000285, Hedges’ g = 2.54) but not GABAzine (Games-Howell post hoc test: p = 0.984, Hedges’ g = 0.05) eliminates the outward directional preference for radial-grating stimuli. Games-Howell post hoc tests were used to reveal statistical significancy for three comparisons. Data are shown as mean ± s.d.; n, number of cells; N.S., no significant difference (p > 0.05).
Fig. 9
Fig. 9. Connectomic reconstruction reveals spatial layout of distinct bipolar-cell types for an identified macaque starburst amacrine cell.
a Dendritic morphology of a physiologically identified starburst cell (OGB + Alexa 468 fill; arrowhead indicates hairpin loop in a dendrite (see also g). b NIRBing (see Methods) was used to burn fiducial marks in the optic fiber layer around the starburst cell (teal dot). c Starburst synaptic output from peripheral dendrite (teal fill; red arrowhead) to ganglion cell dendrite. d, e Bipolar cell (tan fill) ribbon synaptic input to short spines (teal fill, red arrowhead) arising from main dendrites. f, Inhibitory synaptic input to a proximal starburst dendrite (teal fill; red arrowhead; scale applies to ce). g Inhibitory synaptic inputs (yellow balls) and bipolar-cell ribbon excitatory synaptic inputs (red balls) to a portion of the starburst dendritic tree (arrowhead indicates dendritic hairpin shown in a). The axon terminals of two presynaptic bipolar cells are shown (gold fills); one of these terminals is enlarged and rotated (dotted lines) with ribbon synapses indicated by red balls within the axon terminal. Inset shows how a starburst spine receives a single ribbon synapse from this axon terminal. h Two distinct bipolar-cell types synapse with the starburst tree; smaller axon terminals (gold) are midget bipolar cells and larger blue terminals are identified as diffuse bipolar type 4/5 (DB4/5) (see Fig. 10). i Zoomed view of all bipolar synaptic contacts on a portion (light yellow boxed area in h) of the dendritic tree. j Left, locations of all midgets (gold balls) and DB4/5 synapses (blue balls) on the starburst tree. Histogram plots distance of bipolar-cell axon terminal from the starburst cell body (midget bipolar, n = 25, mean ± s.d. distance from starburst soma = 34.5 ± 23.6 µm, DB4/5, n = 23, mean ± s.d. distance from starburst soma = 54.3 ± 19.6 µm; these mean spatial distributions differ significantly, unpaired t-test: t(46) = −3.1433, *p = 0.0029, Cohen’s d = 0.91). k Distribution of bipolar inputs based on anatomical data (gold – midget bipolars; blue – DB4/5 bipolars) used in a starburst cell model (see “Methods”) in which the cell received only excitatory input from simulated bipolar cells (5–15 pS/synapse; n = 70). l Distal dendritic calcium responses in the model showing robust directional difference to radial motion (see “Methods”).
Fig. 10
Fig. 10. Connectomic reconstruction identifies midget and DB4/5 cone bipolar types as presynaptic to the starburst amacrine.
a Reconstructed starburst amacrine cell (teal; see Fig. 9) showing 3 cone bipolar cells with large axon terminals (blue) and three cone bipolars with small axon terminals (gold). The three large blue bipolar terminals are all presynaptic to the starburst. The two most proximal small gold bipolar terminals are also presynaptic to the starburst cell; the distal small bipolar overlaps but does not synapse with the starburst. Hairpin turn in starburst dendrite denoted by black arrowhead (see Fig. 9a, g also). b Complete reconstruction of a midget ganglion cell within the starburst dendritic field (midget cell identified by its uniquely small dendritic field size at this retinal eccentricity). The small gold bipolar-cell axon terminals are enmeshed by the ganglion cell dendrite and provide profuse synaptic input to this midget ganglion cell (25, 34, 27 ribbons synapses each from the three midget bipolar cells shown; this midget ganglion cell received a total of 405 ribbon synaptic inputs; the vast majority, ~90% were derived from midget bipolar cells) identifying them as midget bipolar cells. c Zoomed view of boxed area in b illustrates the close association of midget bipolar and midget ganglion cell for the two bipolars that also contact the starburst amacrine. d, e Two examples of ribbon synapses from midget bipolar (gold) to midget ganglion cell dendrites (purple). f partial reconstruction of an inner (ON center) parasol ganglion cell (orange; identified by uniquely large soma diameter) receives synaptic input from the 3 large (blue) bipolar terminals (~5 synapses/bipolar, 16 ribbon synapses total). Since inner parasol cells receive their major synaptic input from diffuse bipolar (DB) cell types 4 and 5 we identify this bipolar type as DB4/5 (these two types are not easily distinguishable (see main text). Hairpin loop in starburst amacrine (teal, black arrowhead) is created by wrapping around the primary dendrite of this parasol cell. g, h Two examples of ribbon synapses from the DB4/5 bipolars onto the dendrites of the parasol cell shown in (f).

References

    1. Hubel DH, Wiesel TN. Receptive fields, binocular interaction and functional architecture in the cat’s visual cortex. J. Physiol. 1962;160:106–154. doi: 10.1113/jphysiol.1962.sp006837. - DOI - PMC - PubMed
    1. Hubel DH, Wiesel TN. Receptive fields of single neurones in the cat’s striate cortex. J. Physiol. 1959;148:574–591. doi: 10.1113/jphysiol.1959.sp006308. - DOI - PMC - PubMed
    1. Barlow HB, Hill RM. Selective sensitivity to direction of movement in ganglion cells of the rabbit retina. Science. 1963;139:412–414. doi: 10.1126/science.139.3553.412. - DOI - PubMed
    1. Barlow HB, Hill RM, Levick WR. Retinal ganglion cells responding selectively to direction and speed of image motion in the rabbit. J. Physiol. 1964;173:377–407. doi: 10.1113/jphysiol.1964.sp007463. - DOI - PMC - PubMed
    1. Born R, Bradley D. Structure and function of visual area MT. Annu. Rev. Neurosci. 2005;28:157–189. doi: 10.1146/annurev.neuro.26.041002.131052. - DOI - PubMed

Publication types