. 2022 May 23;13(1):2866.
doi: 10.1038/s41467-022-30382-9.

p53 wild-type colorectal cancer cells that express a fetal gene signature are associated with metastasis and poor prognosis

Affiliations

p53 wild-type colorectal cancer cells that express a fetal gene signature are associated with metastasis and poor prognosis

Laura Solé et al. Nat Commun. .

Abstract

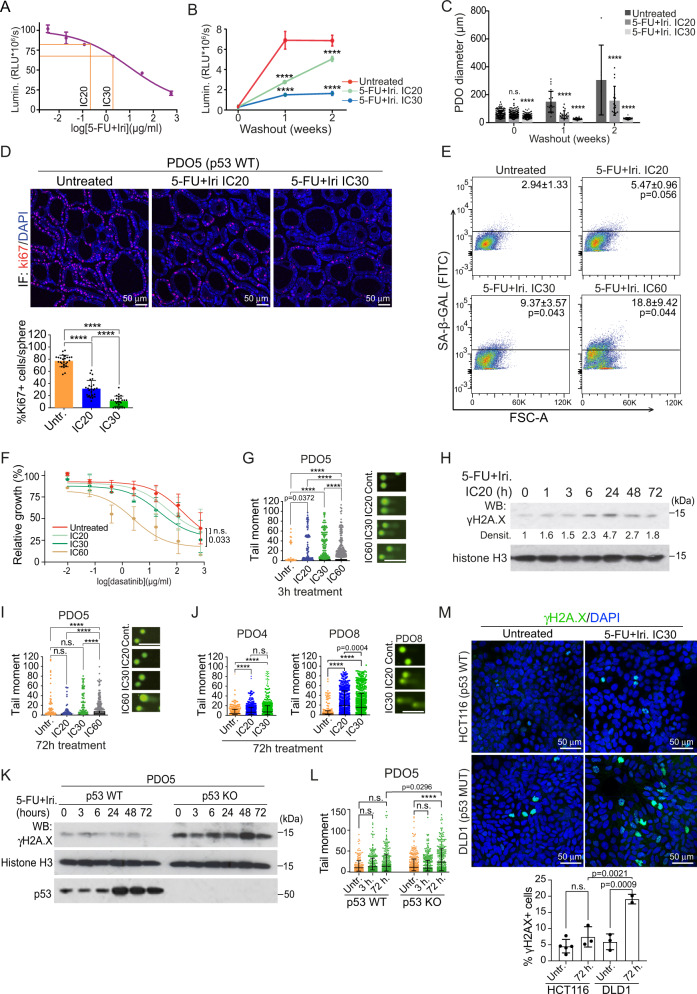
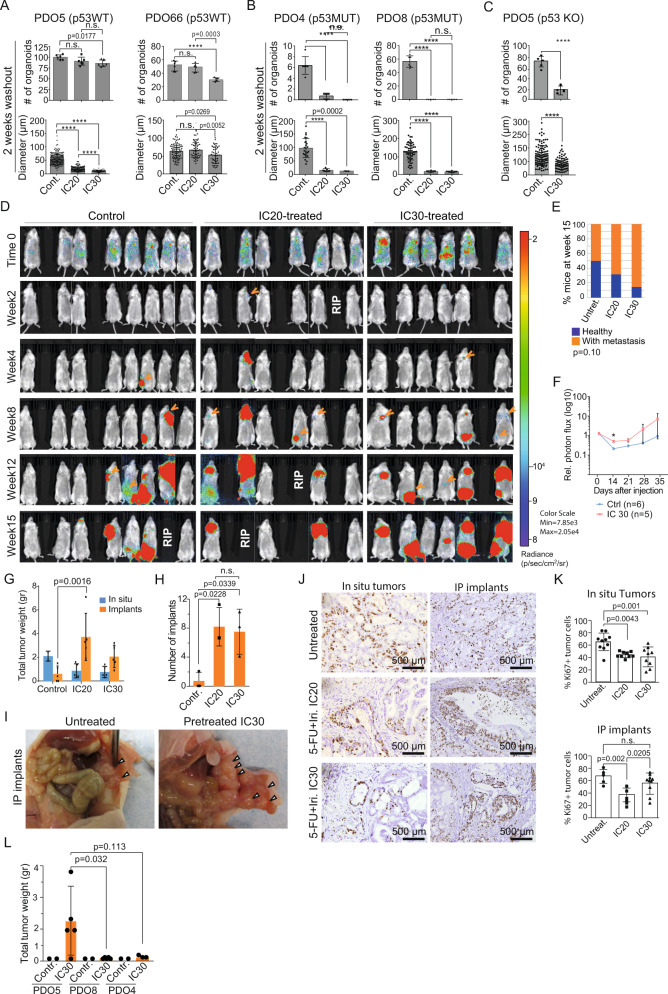
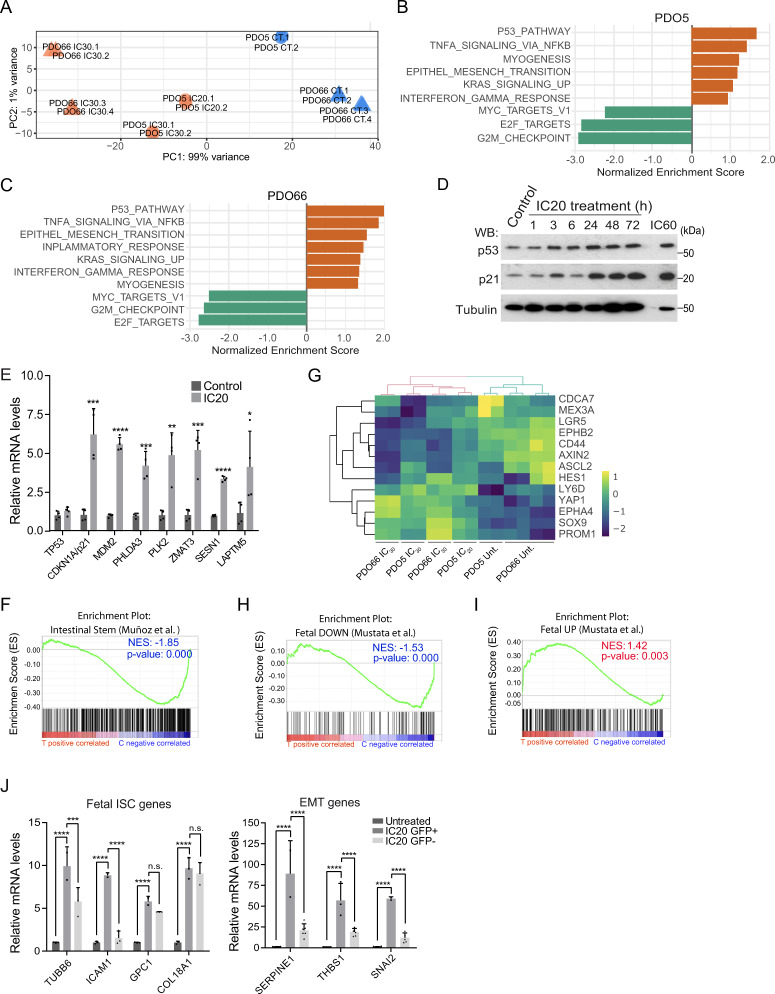
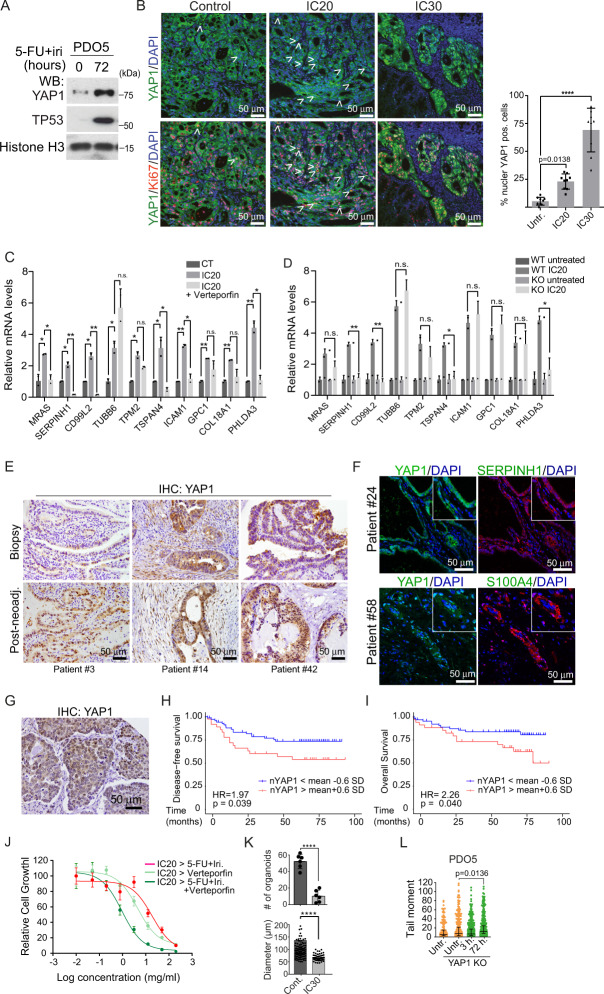
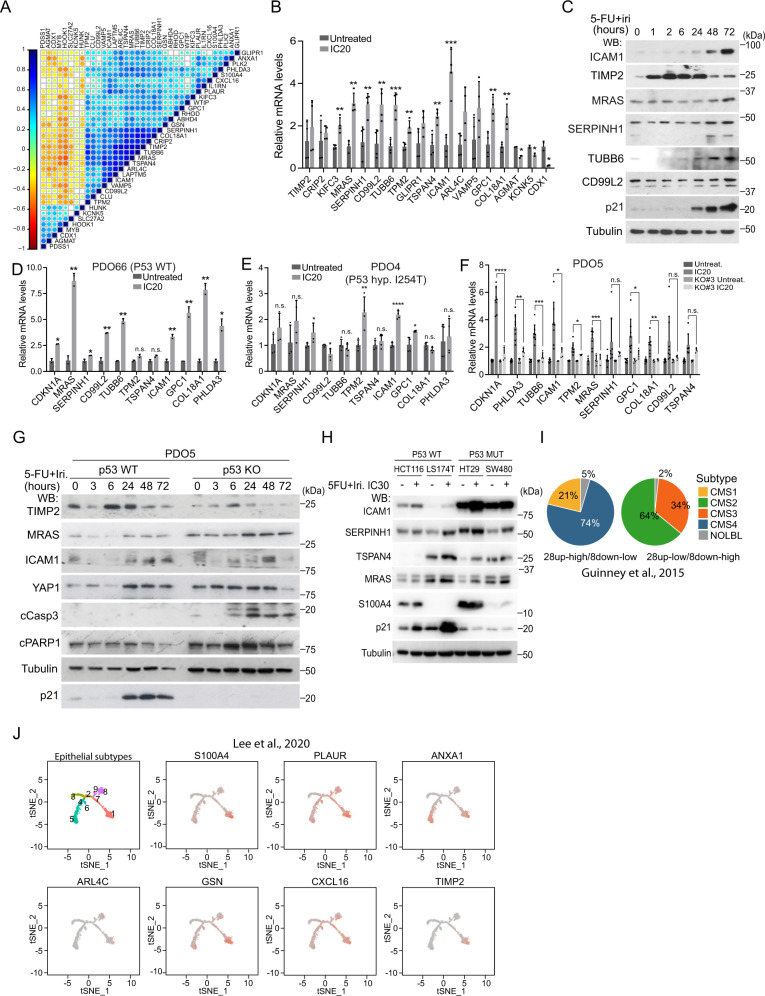
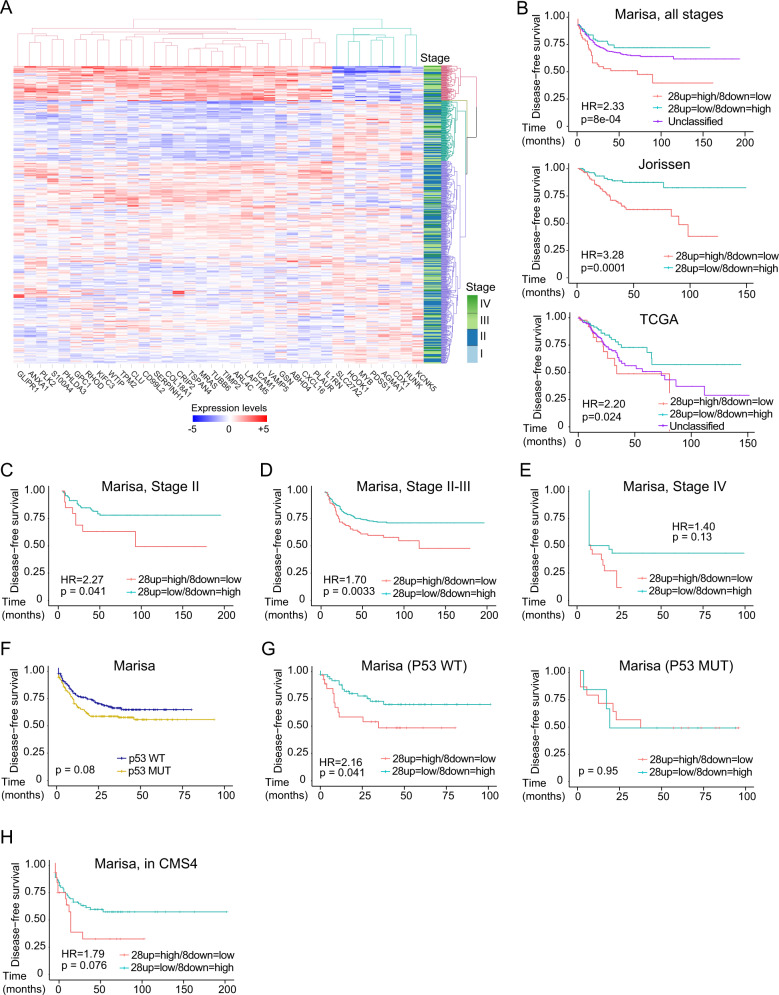
Current therapy against colorectal cancer (CRC) is based on DNA-damaging agents that remain ineffective in a proportion of patients. Whether and how non-curative DNA damage-based treatment affects tumor cell behavior and patient outcome is primarily unstudied. Using CRC patient-derived organoids (PDO)s, we show that sublethal doses of chemotherapy (CT) does not select previously resistant tumor populations but induces a quiescent state specifically to TP53 wildtype (WT) cancer cells, which is linked to the acquisition of a YAP1-dependent fetal phenotype. Cells displaying this phenotype exhibit high tumor-initiating and metastatic activity. Nuclear YAP1 and fetal traits are present in a proportion of tumors at diagnosis and predict poor prognosis in patients carrying TP53 WT CRC tumors. We provide data indicating the higher efficacy of CT together with YAP1 inhibitors for eradication of therapy resistant TP53 WT cancer cells. Together these results identify fetal conversion as a useful biomarker for patient prognosis and therapy prescription.


Conflict of interest statement

Laura Solé, Teresa Lobo-Jarne, Marta Guix, Beatriz Bellosillo, Mar Iglesias, Anna Bigas, and Lluís Espinosa have a pending patent application entitled Genomic predictor of outcome in cancer with number PCT/EP2022/058503, related to the fetal signature as a prognostic biomarker in colorectal cancer. The authors have no additional financial interests and the remaining authors declare no competing interests.

Figures

Fig. 1
Fig. 1. Low-dose CT treatment induces a non-senescent quiescent-like state to CRC PDO in the absence of persistent DNA damage.
A Dose-response assay of PDO5 treated with 5-FU + Iri. for 72 h, indicating the IC20 and IC30 doses (n = 3 replicates examined, from one out of four biologically independent experiments). B, C Quantification of PDO5 B viability (n = 3 replicates examined, from 1 out of 4 biologically independent experiments) and C diameter (n = at least 15 spheres examined whenever possible over four biologically independent experiments), after 72 h of 5-FU + Iri. treatment and 1–2 weeks of washout. D Representative ki67 stainings of PDO5 treated for 72 h as indicated, and quantification of ki67+ cells/sphere (n = 25 spheres examined over 3 biologically independent experiments). E Flow cytometry analysis of SA-β-Gal activity in PDO5 treated as in D. F Dose–response curves of PDO5 treated with dasatinib for 3 days after 5-FU + Iri. pre-treatment, as indicated (n = 2–3 biologically independent experiments). G Comet assay in PDO5 treated for 3 h as indicated (n = more than 700 cells examined over three independent experiments). H WB analysis of the DNA damage sensor γH2A.X in PDO5 cells collected at the indicated time points after 5-FU + Iri treatment (from one out of three biologically independent experiments). I, J Comet assay in 53 WT PDO5 I and p53 mutants PDO4 and PDO8 J, treated for 72 h as indicated (n = >800 cells examined over 3 independent experiments). K, L WB analysis K (from one out of three biologically independent experiments) and comet assay L of PDO5 CT and TP53 KO untreated or treated with 5-FU + Iri. at the same concentration at the indicated time points (n = more than 490 cells examined over 3 independent experiments). M Representative γH2A.X staining and quantification of HCT116 and DLD1 cell lines treated for 72 h with 5-FU + Iri. at the same concentration (5-FU 0.1 µg/mL and Iri. 0.04 µg/mL) (n = more than 50 cells examined over 2-3 biologically independent experiments). For all applicable figure panels, data are mean ± SD, except for G, I, J, and L (Tukey method for box plots), where boxes represent the central 50% of the data (from the lower 25th percentile to the upper 75th percentile), lines inside boxes represent the median (50th percentile), and whiskers are extended to the largest value less than the sum of the 75th percentile plus 1.5 IQR (the difference between the 25th and 75th percentile) or greater than the 25th percentile minus 1.5 IQR, and plot any values that are greater or lower than this as individual points. Significance (p) was calculated with one-way ANOVA test, except for B and C (two-way ANOVA) and F (two-sided logistic regression trend test). For G, I, and J scale bar represents 50 μm. ****p < 0.0001; n.s., no significant. 5-FU, 5-fluorouracil; Iri, irinotecan; SA-β-Gal, SA-β-Galactosidase; IC20, IC30, and IC60 indicate 5-FU + Iri. treatment leading to 20, 30, and 60% cell death, respectively. Source data are provided as a Source Data file.
Fig. 2
Fig. 2. TP53 WT PQL cells retain tumor-initiating capacity in vitro and in vivo.
AC Number of PDOs (upper panels) and diameter (lower panels) of TP53 WT PDO5 and PDO66 A, TP53 mutant PDO4 and PDO8 B, and TP53 KO PDO5 C treated with 5-FU + Iri. as indicated, and left for 2 weeks with fresh medium. 300 cells/well were seeded (n = 6 wells examined for TICs and n = more than 50 spheres examined whenever possible for diameters, from three biologically independent experiments). D Bioluminescence images of NGS mice after intracardiac injection of 40,000 luciferase-PDO5 CT and IC20 or IC30-treated cells (from 1 out of 2 biologically independent experiments). E Percentage of healthy and metastasis-carrying mice at week 15 (n = 14 (Untreat.), 6 (IC20), and 11 (IC30) mice examined over two biologically independent experiments). F Relative photon flux measurement of metastasis initiation in mice injected with PDO5 CT and IC30-treated cells (n = 6 (Untreat.) and 5 (IC30) mice examined from one experiment). GI Total tumor weight of in situ tumors and intraperitoneal implants per animal in the different experimental groups G (n = 5 mice examined over two biologically independent experiments), number of intraperitoneal implants H (n = 3 mice examined from 1 experiment), and photographs of tumors derived from orthotopically implanted CT, IC20 and IC30-pre-treated PDOs in nude mice I. J, K IHC analysis of ki67 in in situ tumors and implants J and percentage of ki67+ cells in the indicated conditions K (n = more than four independent regions examined). L Tumor weight of intraperitoneal implants of tumors derived from orthotopically implanted CT and IC30-pre-treated PDO5, PDO8 and PDO4 in nude mice (n = 2 (Untreat.) and 5 (IC30) mice examined from 1 experiment). For all applicable figure panels, data are mean ± SD. Significance (p) was calculated with one-way ANOVA test, except for C (two-sided Student’s T test), E (two-sided logistic regression trend test) and F and G (two-way ANOVA test). ****p < 0.0001; n.s., no significant. 5-FU, 5-fluorouracil; Iri, irinotecan. Source data are provided as a Source Data file.
Fig. 3
Fig. 3. PQL phenotype is associated with the acquisition of a fetal intestinal stem cell (feISC) signature.
A PCA of the RNA-seq analysis from the indicated replicates performed on PDO5 and PDO66 (untreated; CT) or 5-FU + Iri.-treated either at IC20 or IC30 as indicated. B, C Barplots depicting the normalized enrichment score of statistically significant enriched pathways obtained by GSEA analysis of PDO5 (B) and PDO66 (C) with the Hallmark gene set for treated samples (NOM p val < 0.05). D WB analysis of control and 5-FU + Iri.-treated PDO5 cells collected at the indicated time points (from one out of three biologically independent experiments). E RT-qPCR analysis of selected p53 target genes from control and IC20-treated PDO5 cells (n = 4 biologically independent experiments). F GSEA of an intestinal stem cell (ISC) gene set, according to Muñoz et al., in untreated (C) versus treated (T) PDO5/PDO66 condition. G Heat map showing the expression levels of the indicated ISC genes in untreated, IC20 and IC30-treated PDO5 cells and untreated and IC30-treated PDO66 cells. H, I GSEA of a fetal down (H) and a fetal up (I) stem cell gene set, according to Mustata et al., in control (C) versus treated (T) PDO5/PDO66 condition. J RT-qPCR analysis of selected fetal ISC and EMT genes from untreated and IC20-treated sorted GFPhigh or GFPlow PDO5 cells (from 1 out of 2 biologically independent experiments). For all applicable figure panels, data are mean ± SD. Significance (p) was calculated in E with two-sided Student’s t test and in J with one-way ANOVA test. For F, H, I p.value is nominal p value given by the GSEA program. *p < 0.05; **p < 0.01; ***p < 0.001; ****p < 0.0001; n.s., no significant; CT, control; IC20 and IC30, 5-FU + Iri. are doses imposing 20 and 30% cell death, respectively; GSEA, gene set enrichment analysis; NES, normalized enriched score. Source data are provided as a Source Data file.
Fig. 4
Fig. 4. Acquisition of feISC by CT treatment is dependent on YAP1 activation.
A WB analysis of PDO5 cells was collected after 72 h of 5-FU + Iri. treatment (from one out of three biologically independent experiments). B Representative images and quantification of YAP1 and ki67 staining in tumors derived from control (CT), IC20, and IC30-pre-treated PDOs implanted in nude mice. White arrows indicate cells with nuclear YAP1. DAPI was used as a nuclear marker (n = 9 independent regions examined). C RT-qPCR analysis of randomly selected feISC genes in control and 5-FU + Iri-treated PDO5 alone or plus 0.2 μM verteporfin (n = 2 biologically independent experiments). D RT-qPCR analysis of same genes in control and YAP1 KO PDO5 treated as in C (n = 2 biologically independent experiments). E, F Representative images of YAP1 E and SERPINH1 and S100A4 F in the indicated tumors at diagnosis or after neoadjuvant treatment (from 1 out of 6 biologically independent samples). G Representative image of an untreated human CRC identified as nuclear YAP1 high (done with all TMA samples, described in Supplementary Table S6). H, I Kaplan–Meier representation of disease-free H and overall I survival of CRC patients classified according to the H-score of nuclear YAP1. J Dose–response curves of IC20-pre-treated PDO5 and then treated for 3 days as indicated (n = 3 replicates examined, from one out of three biologically independent experiments). K Number of PDOs (upper panel) and diameter (lower panel) of PDO5 YAP1 KO after 72 hours of 5-FU + Iri. treatment and 2 weeks of washout. 300 cells/well were seeded (n = 6 wells examined for TICs and n = more than 50 spheres examined whenever possible for diameters, from three biologically independent experiments). L Comet assay in PDO5 YAP1 KO treated with 5-FU + iri. for 3 and 72 hours as indicated (n = >790 cells examined over three biologically independent experiments). For all applicable figure panels, data are mean ± SD, except for L (Tukey method for box plots), where boxes represent the central 50% of the data (from the lower 25th percentile to the upper 75th percentile), lines inside boxes represent the median (50th percentile), and whiskers are extended to the largest value less than the sum of the 75th percentile plus 1.5 IQR (the difference between the 25th and 75th percentile) or greater than the 25th percentile minus 1.5 IQR, and plot any values that are greater or lower than this as individual points. Significance (p) was calculated with one-way ANOVA, except for D and K by two-sided Student’s t test and for H and I by log-rank (Mantel–Cox) test. *p < 0.05, **p < 0.01, n.s., no significant. CT, control; IC20 and IC30, 5-FU + Iri. treatment leading to 20 and 30% cell death, respectively. Source data are provided as a Source Data file.
Fig. 5
Fig. 5. CT-induced quiescent cells display a fetal intestinal stem cell signature that is partially dependent on p53.
A Expression correlation matrix from the 28up + 8down-feISC gene signature in Marisa database (n = 566). Size of circles and color intensity are proportional to Pearson correlation coefficient for each gene pair. B RT-qPCR analysis of normalized expression of selected 28up + 8down-feISC genes in untreated and treated PDO5 (n = 2–4 biologically independent experiments). C WB analysis of control and 5-FU + Iri-treated PDO5 cells collected at the indicated time points (from one out of three biologically independent experiments). DF RT-qPCR analysis of normalized relative expression of indicated genes in control and CT-treated TP53 WT PDO66 D, TP53 mutant PDO4 E and PDO5 TP53 KO #3 F (n = 2–4 biologically independent experiments). G WB analysis of PDO5 and PDO5 TP53 KO untreated or treated with 5-FU + Iri. at the same concentration at the indicated time points (from one out of three biologically independent experiments). H WB analysis with indicated antibodies of CRC cells untreated or treated 72 h with 5-FU + Iri. (from one out of three biologically independent experiments). I Pie charts showing the molecular subtype distribution according to Guinney et al., in patients within the feISC signature groups as indicated. J Distribution of selected 28up-fetal-ISC genes in epithelial subtypes cell states 1–9 described by Lee et al.. The t-SNE plots were obtained using the web-based tool URECA (User-friendly InteRface tool to Explore Cell Atlas). For all applicable figure panels, data are mean ± SD. Significance (p) was calculated with a two-sided Student’s t test. *p < 0.05; **p < 0.01; ****p < 0.0001; n.s., no significant. CT, control; IC20 and IC30, 5-FU + Iri. treatment indicates 20 and 30% cell death, respectively. Source data are provided as a Source Data file.
Fig. 6
Fig. 6. Identification of a fetal ISC signature with prognosis value in CRC.
A Unsupervised hierarchical cluster analysis of patients according to 28up + 8down-feISC gene signature leading to the classification of patients into four subsets (colored in red, green, light blue, and purple). Tumor staging is indicated. B Kaplan–Meier representation of disease-free survival (DFS) over time for patients according to 28up + 8down-feISC signature selected according to A for Marisa (28up = high/8down = low n = 66, 28up = low/8down = high n = 114 and unclassified n = 386), Jorissen (28up = high/8down = low n = 114 and 28up = low/8down = high n = 112) and TCGA (28up = high/8down = low n = 39, 28up = low/8down = high n = 96 and unclassified n = 194) colorectal cancer databases. Patients were selected according to cluster analysis of the 28up + 8down-feISC signature. CE Kaplan–Meier curves representing patients DFS classified according to cluster analysis of the 28up + 8down-feISC signature of stage II (n = 149) C, stage II and III (n = 468) D, and stage IV (n = 60) E patients from Marisa database. F Kaplan–Meier representation of patients DFS classified according to TP53 in the Marisa data set (TP53 WT n = 161 and TP53 MUT n = 190). G Kaplan–Meier representation of DFS of patients from the Marisa data set classified according to cluster analysis of the 28up + 8down-feISC signature in TP53 WT (n = 85) and TP53 mutant (n = 20) groups. H Kaplan–Meier representation of DFS in CMS4 patients from Marisa cohort classified based on 28up + 8down-feISC signature (n = 91). Data in A show normalized, centered, and scaled Illumina probe set intensities on a log2 scale. The stage lane represents the subtype corresponding to each patient. We used Cox proportional hazards models for statistical Kaplan–Meier analysis and log-rank two-sided p value (see Supplementary Table S3). HR, hazard ratio.

References

    1. Brenner, H., Kloor, M. & Pox, C. P. Colorectal cancer. Lancet10.1016/S0140-6736(13)61649-9 (2014). - PubMed
    1. Batlle, E. & Clevers, H. Cancer stem cells revisited. Nat. Med.10.1038/nm.4409 (2017). - PubMed
    1. Merlos-Suárez A, et al. The intestinal stemcell signature identifies colorectal cancer stem cells and predicts disease relapse. Cell Stem Cell. 2011;8:511–524. doi: 10.1016/j.stem.2011.02.020. - DOI - PubMed
    1. Galmarini, F. C., Galmarini, C. M., Sarchi, M. I., Abulafia, J. & Galmarini, D. Heterogeneous distribution of tumor blood supply affects the response to chemotherapy in patients with head and neck cancer. Microcirculation7, 405–410 (2000). - PubMed
    1. Azzi, S., Hebda, J. K. & Gavard, J. Vascular permeability and drug delivery in cancers. Front. Oncol. 3, 211 (2013). - PMC - PubMed

Publication types

MeSH terms

Substances