. 2022 May 24;11(1):27.
doi: 10.1038/s41389-022-00403-9.

The interferon-β/STAT1 axis drives the collective invasion of skin squamous cell carcinoma with sealed intercellular spaces

Affiliations

The interferon-β/STAT1 axis drives the collective invasion of skin squamous cell carcinoma with sealed intercellular spaces

Yuji Kumagai et al. Oncogenesis. .

Abstract

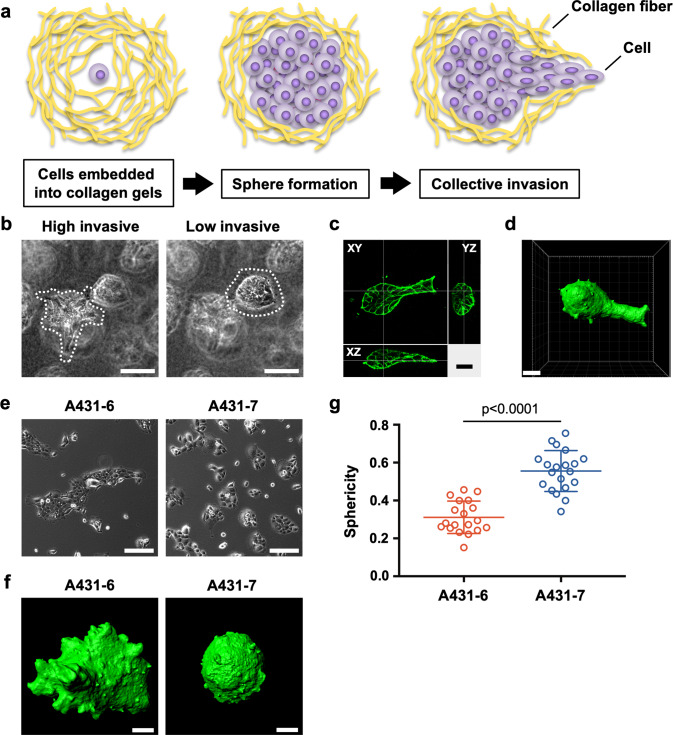
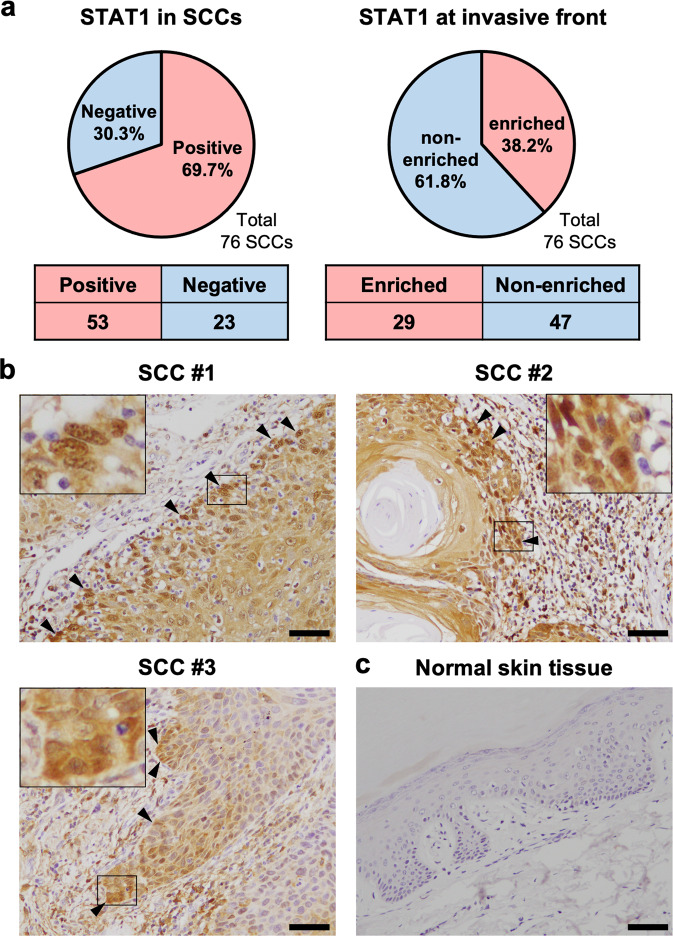
The process by which cancer cells invade as a cell cluster, known as collective invasion, is associated with metastasis and worse prognosis of cancer patients; therefore, inhibition of collective invasion is considered to improve cancer treatment. However, the cellular characteristics responsible for collective invasion remain largely unknown. Here, we successfully established subclones with various invasive potentials derived from human skin squamous carcinoma cells. The cell cluster of the highly invasive subclone had a hermetically sealed and narrow intercellular space. Interferon-β was localized to the sealed intercellular spaces, leading to collective invasion via the activation of signal transducer and activator of transcription 1 (STAT1). On the other hand, interferon-β was not localized to non-sealed and wide intercellular spaces of the cell cluster of low-invasive subclone with deficient STAT1 activity. In the mixed cell cluster of high- and low-invasive subclones, the high-invasive sub-clonal cells were located at the invasive front of the invasive protrusion, leading to collective invasion by the low-invasive sub-clonal cells. Tissue microarray analysis of human skin squamous cell carcinoma (SCC) also showed enrichment of STAT1 in the invasive front of SCCs. These findings indicate that the intercellular structure controls the potential for collective invasion via STAT1 regulation in SCC.


Conflict of interest statement

The authors declare no competing interests.

Figures

Fig. 1
Fig. 1. Establishment of subclones with high- or low-invasive potentials from A431 cells consisted of heterogeneous cells.
a Schematic illustration of the experimental system to assess collective invasion. b Representative phase-contrast images of the invasive cell cluster (left) and non-invasive cell cluster (right) in A431-WT cells cultured in a three-dimensional collagen gel culture system; both were captured in the same field. The dotted lines show the contours of the cell clusters. Scale bars represent 100 µm. c F-actin staining of the invasive cell cluster in A431-WT cells cultured in three-dimensional collagen gel culture with XY, YZ, and XZ sectional views. Scale bar represents 25 µm. d Three-dimensional constructed image of (c) using the Imaris software. Scale bar represents 30 µm. e Phase contrast images of the high-invasive A431-6 and low-invasive A431-7 subclones. Scale bars represent 200 µm. f Representative three-dimensional constructed images of A431-6 and A431-7 cell clusters cultured in a three-dimensional collagen gel culture system. The sphericity of A431-6: 0.221 and A431-7: 0.715. Scale bars represent 30 µm. g Quantification of sphericity in (f). Lines show the mean with standard deviation (SD) for n = 19 (A431-6) and n = 19 (A431-7) clusters by two independent experiments.
Fig. 2
Fig. 2. STAT1 plays a crucial role in collective invasion of high-invasive A431-6 cells.
a The DNA microarray result comparing the A431-6 and A431-7 subclones. Genes with more than a 4-fold increase in A431-6 are shown. b GSEA showing increased response to type-I interferon in A431-6 cells. c Representative western blotting images for pSTAT1 (Y701), pSTAT1 (S727), STAT1, and β-actin in A431-6 and A431-7 cells. This experiment was repeated three times, and similar results were obtained in all experiments. d Representative three-dimensional constructed images of siControl-, siSTAT1 #1- or STAT1 #2-treated A431-6 cell clusters cultured in a three-dimensional collagen gel culture system. The sphericity of siControl: 0.263, siSTAT1#1: 0.638, and siSTAT1#2: 0.633. Scale bars represent 30 µm. e Quantification of sphericity in (d). Lines show the mean with SD for n = 20 (siControl), n = 18 (siSTAT1#1), and n = 20 (siSTAT1#2) clusters by two independent experiments.
Fig. 3
Fig. 3. JAK and IFNAR are upstream molecules responsible for phosphorylation of STAT1, increasing collective invasive potential.
a Representative western blotting images for pJAK1 and β-actin in A431-6 and A431-7 cells. b Quantification of (a). Bars represent the mean ± standard error of the mean (SEM) of three independent experiments. c Representative western blotting images for pSTAT1 (Y701), STAT1, and β-actin in DMSO or JAK inhibitor I (15 nM)-treated A431-6 cells. d Quantification of (c). Bars represent the mean ± standard error of the mean (SEM) of three independent experiments. e Representative three-dimensional constructed images of DMSO or JAK inhibitor I (15 nM)-treated A431-6 cell clusters cultured in a three-dimensional collagen gel culture system. The sphericity of DMSO: 0.247, JAK inhibitor I: 0.671. Scale bars represent 30 µm. f Quantification of sphericity in (d). Lines show the mean with SD for n = 17 (DMSO) and n = 16 (JAK inhibitor I) clusters by two independent experiments. g Representative western blotting images for pSTAT1 (Y701), STAT1, and β-actin in siControl-, siIFNAR1-, or siIFNAR2-treated A431-6 cells. h Quantification of protein bands in (f). Bars represent the mean ± SEM of four independent experiments. i Representative three-dimensional constructed images of siControl, siIFNAR1, or siIFNAR2-treated A431-6 cell clusters cultured a in three-dimensional collagen gel culture system. The sphericity of siControl: 0.176, siIFNAR1: 0.688, and siIFNAR2: 0.712. Scale bars represent 30 µm. j Quantification of sphericity in (h). Lines show the mean with SD for n = 22 (siControl), n = 20 (siIFNAR1), and n = 23 (siIFNAR2) clusters by two independent experiments.
Fig. 4
Fig. 4. Interferon-β promotes the collective invasion of cancer cells with sealed intercellular spaces.
a Representative western blotting images for pSTAT1 (Y701), STAT1, and β-actin in siControl- or siIFNB1 -treated A431-6 cells. b Quantification of protein bands in (a). Bars represent the mean ± SEM of three independent experiments. c Representative three-dimensional constructed images of siControl- or siIFNB1-treated A431-6 cell clusters cultured in a three-dimensional collagen gel culture system. The sphericity of siControl: 0.147 and siIFNB1: 0.558. Scale bars represent 30 µm. d Quantification of sphericity in (c). Lines show the mean with SD for n = 23 (siControl) and n = 24 (siIFNB1) clusters by two independent experiments. e Immunofluorescence images for interferon-β (INFB; green) with F-actin (magenta) and nucleus (blue) in A431-6 and A431-7 cell clusters in a three-dimensional collagen gel culture system. Arrowheads show immunoreactivity for IFNB in the intercellular spaces. Scale bars represent 25 µm. f Transmission electron microscopy of A431-6 and A431-7 cell clusters cultured in a three-dimensional collagen gel culture system. The regions surrounded by the white dotted squares are magnified on the right. The arrow shows the sealed edge of the intercellular space. Arrowheads show intercellular junctions. Scale bars represent 3 µm. g Quantification of intercellular distances in (f). Lines show the mean with SD in five clusters.
Fig. 5
Fig. 5. Direct contact with high-invasive subclone leads invasion of low-invasive subclone.
a Schematic illustration of the culture of A431-6 cells expressing scarlet-histone H2B (6-scarlet, red) and A431-7 cells expressing emerald-histone H2B (7-emerald, green) cell clusters. b Representative three-dimensional constructed images of (a). 6-scarlet and 7-emerald cell clusters were cultured in a three-dimensional collagen gel culture system. The sphericity of 6-scarlet: 0.099 and 7-emerald: 0.596. Scale bars represent 30 µm. c Schematic illustration of the experiment culturing 6-scarlet and 7-emerald cell clusters with non-direct contact. d Representative three-dimensional constructed images of (c). 6-scarlet and 7-emerald cell clusters were cultured in a three-dimensional collagen gel culture system. The sphericity of 6-scarlet: 0.137 and 7-emerald: 0.604. Scale bars represent 30 µm. e Quantification of sphericity in (b, d). Lines show the mean with SD in >16 clusters by two independent experiments. f Schematic illustration of the experiment with mixed spheroids of 6-scarlet and 7-emerald cells in direct contact. g Representative images of a mixed spheroid consisting of 6-scarlet (magenta) and 7-emerald (green) cells cultured in a collagen gel. Arrowheads show invading sub-clonal cells. The merged image is shown by F-actin (blue). Scale bars represent 30 µm. h Time-lapse imaging of a mixed spheroid consisting of 6-scarlet (magenta) and 7-emerald (green) cells cultured in a collagen gel. Arrowheads show 6-scarlet cells leading to polyclonal collective invasion. Scale bars represent 100 µm.
Fig. 6
Fig. 6. STAT1 is highly expressed at the invasive front of skin SCCs.
a The pie charts and tables show the percentage and number of STAT1 positive skin squamous cell carcinoma (SCC) in human tissue microarray (left) and those of SCC with enriched STAT1 at the invasive front (right), respectively. The results were independently assessed by two pathologists. b Representative images showing enrichment of STAT1 in the invasive front of SCC. Arrowheads indicate high STAT1 expression in leading cancer cells at the invasive fronts of SCC cancer cell groups. The regions surrounded by squares were magnified. The scale bars represent 50 µm. c Representative images showing STAT1-negative in normal skin tissues. Scale bars represent 50 µm.

Similar articles

Cited by

References

    1. Howlader N, Noone A, Krapcho M, Miller D, Brest A, Yu M et al. SEER Cancer Statistics Review, 1975–2017 (National Cancer Institute, 2020).
    1. Fidler IJ. Tumor heterogeneity and the biology of cancer invasion and metastasis. Cancer Res. 1978;38:2651–60. - PubMed
    1. Friedl P, Wolf K. Tumour-cell invasion and migration: Diversity and escape mechanisms. Nat Rev Cancer. 2003;3:362–74. doi: 10.1038/nrc1075. - DOI - PubMed
    1. Friedl P, Locker J, Sahai E, Segall JE. Classifying collective cancer cell invasion. Nat Cell Biol. 2012;14:777–83. doi: 10.1038/ncb2548. - DOI - PubMed
    1. Friedl P, Wolf K. Tube travel: The role of proteases in individual and collective cancer cell invasion. Cancer Res. 2008;68:7247–9. doi: 10.1158/0008-5472.CAN-08-0784. - DOI - PubMed