. 2022 Jun;25(6):818-831.
doi: 10.1038/s41593-022-01074-w. Epub 2022 May 23.

Phenotypic and genetic associations of quantitative magnetic susceptibility in UK Biobank brain imaging

Affiliations

Phenotypic and genetic associations of quantitative magnetic susceptibility in UK Biobank brain imaging

Chaoyue Wang et al. Nat Neurosci. 2022 Jun.

Abstract

A key aim in epidemiological neuroscience is identification of markers to assess brain health and monitor therapeutic interventions. Quantitative susceptibility mapping (QSM) is an emerging magnetic resonance imaging technique that measures tissue magnetic susceptibility and has been shown to detect pathological changes in tissue iron, myelin and calcification. We present an open resource of QSM-based imaging measures of multiple brain structures in 35,273 individuals from the UK Biobank prospective epidemiological study. We identify statistically significant associations of 251 phenotypes with magnetic susceptibility that include body iron, disease, diet and alcohol consumption. Genome-wide associations relate magnetic susceptibility to 76 replicating clusters of genetic variants with biological functions involving iron, calcium, myelin and extracellular matrix. These patterns of associations include relationships that are unique to QSM, in particular being complementary to T2* signal decay time measures. These new imaging phenotypes are being integrated into the core UK Biobank measures provided to researchers worldwide, creating the potential to discover new, non-invasive markers of brain health.


Conflict of interest statement

The authors declare no competing interests.

Figures
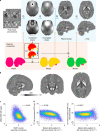
Fig. 1
Fig. 1. QSM processing and IDP analyses.
a, QSM processing pipeline for UK Biobank swMRI data. Blue arrows indicate the main processing steps. Step 1, channel combination using MCPC-3D-S. Step 2, phase unwrapping using a Laplacian-based algorithm. Step 3, background field removal using V-SHARP. Step 4, dipole inversion using iLSQR. Black arrows indicate the brain mask evolution, and orange arrows indicate the brain mask applied at each step. Briefly, the brain mask provided by UK Biobank (Mask1, pink) was first used for the channel combination step. To exclude unreliable voxels in the vicinity of sinus cavities, the mask was subsequently refined using a ‘phase reliability’ map (PR, black box; Mask2, yellow). After background field removal, the output mask from V-SHARP was further refined using the phase reliability map, with the resulting mask (Mask3, green) used for dipole inversion. Full details about the pipeline are provided in Methods. b, QSM atlas generated by averaging χ maps (non-linearly registered to MNI space) from 35,273 individuals; ppb, parts per billion. c, Association between QSM WMH IDP and WMH volume IDP (r = –0.446). d, Example association between T2* left accumbens IDP and median field gradient measured in the left accumbens before (r = –0.506) and after (r = 0.0612) deconfounding based on a physical model (details in Supplementary Information, section 2); n = 35,273 individuals were used to compute Pearson correlation r values shown in c and d.
Fig. 2
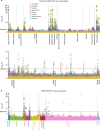
Fig. 2. Visualization of univariate (two-sided) cross-participant association tests between 18 QSM IDPs and the 17,485 phenotypes in UK Biobank using n = 35,273 participants.
The significance threshold was adjusted to account for multiple comparisons, and unadjusted –log10 (P) values are reported. Each circle represents a single IDP–phenotype association. The dashed horizontal line indicates the –log10 (P) Bonferroni-corrected threshold of 7.10. All associations above this line are considered significant. Dashed vertical lines are used to distinguish between different phenotype categories. a, Manhattan plots showing associations between 16 subcortical QSM IDPs and phenotypes in 17 categories. b, Manhattan plot showing associations between the QSM WMH IDPs and all phenotypes (separated into nine major categories). Shown behind (gray) are the associations without regressing out WMH volume.
Fig. 3
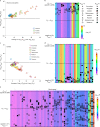
Fig. 3. Example comparisons of (two-sided) phenotypic associations with QSM and T2* subcortical IDPs (region/phenotype pair shown if unadjusted PQSM or PT2* passed the Bonferroni-corrected threshold) using n = 35,273 participants.
ae, Here, we display results for alcohol consumption (a and b), cardiac (c and d) and blood assays (e) categories. a,c, Bland–Altman plot showing comparisons of –log10 (P) values for QSM and T2* associations with alcohol consumption (a) and cardiac (c) categories. b,d,e, Transformed Bland–Altman plot that aims to emphasize whether a given association is specific to QSM or T2* or is common to both. Each column represents one unique phenotype from the corresponding Bland–Altman plot, ordered from left to right by the number of associated regions. The vertical axis is given by the angle of each point in a Bland–Altman plot with respect to the y = 0 line. Hence, datapoints at the top (or bottom) of the plot represent an association that is highly specific to QSM (or T2*), and datapoints in the middle are phenotypes that associate with both QSM and T2* in a given brain region. The background color of each column represents the averaged –log10 (P) value for significant associations with that phenotype. Unlike the Bland–Altman plot, this visualization emphasizes the modality specificity over the strength of correlation. For example, it is more apparent in b than in a that thalamus–alcohol associations are highly specific to QSM. Here, the three categories reveal more QSM-specific (a and c), T2*-specific (b and d) and mixed (e) association patterns.
Fig. 4
Fig. 4. Voxel-wise association maps of six example phenotypes with χ maps (aligned in MNI space) from 35,273 participants.
The Pearson correlation r is shown as color overlay (red–yellow for positive r and blue for negative r) on the population average χ map. a, Mean corpuscular hemoglobin identifies all subcortical regions captured by our IDPs as well as the red nucleus and cerebellar regions. Particularly, the putamen, caudate, substantia nigra and red nucleus exhibit homogeneous correlations across the entire region. b, Multiple sclerosis (self-reported) identifies subregions of the thalamus (including the pulvinar nucleus and lateral geniculate nucleus) as well as focal white matter regions, such as the optic radiation. c, Anemia (ICD10) identifies the putamen, caudate, red nucleus and cerebellar regions as well as subregions of the substantia nigra and thalamus. d, Diabetes diagnosed by doctor identifies subregions of the caudate, putamen, pallidum and substantia nigra in addition to white matter regions, including the splenium of the corpus callosum and optic radiations. e, Tea intake identifies subregions of the caudate, pallidum and substantia nigra. f, Frequency of consuming six or more units of alcohol identifies the putamen and subregions of the thalamus, caudate and substantia nigra.
Fig. 5
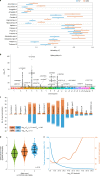
Fig. 5. Heritability and genetic associations of QSM and T2* IDPs.
a, Heritability estimates (h2) using n = 29,579 unrelated participants for subcortical QSM and T2* IDPs grouped according to regions. Circles indicate heritability estimates, and error bars indicate standard error; R, right; L, left. b, Example Manhattan plot of the GWAS for the QSM right pallidum IDP (two-sided, unadjusted –log10 (P) values for the discovery cohort n = 19,720). The lower gray horizontal line indicates the –log10 (P) threshold of 7.5, and the upper line indicates the Bonferroni threshold of 9.06. c, Stacked bar chart showing comparisons of the number of peak associations identified in GWASs (unadjusted –log10 (Pdis) in the discovery cohort passing the threshold of 7.5 and unadjusted Prep in the replication cohort passing the threshold of 0.05) for QSM versus T2* IDPs. d, Scatter plot showing the relationship between QSM right pallidum IDP versus allele count of rs13107325 (the strongest genetic association across all GWASs) using the discovery cohort (n = 19,720 individuals). The center dashed line depicts the group mean χ of each allele count with error bars indicating the standard deviation. e, Distribution of unadjusted –log10 (P) values of all peak associations identified in GWASs. The left y axis (blue line) is showing the total number of peak associations (both QSM and T2* IDPs) with –log10 (P) greater than the thresholds (x axis). The right y axis (orange line) is showing percentage of peak associations identified with QSM IDPs.
Fig. 6
Fig. 6. Voxel-wise association maps of top genetic variants of 10 genetic clusters with χ maps aligned in MNI space.
The Pearson correlation r is shown as color overlay (red–yellow for positive r and blue for negative r) on the population average χ map. a, rs11884632 (SLC40A1) identifies the pallidum, subregions of the substantia nigra and thalamus, red nucleus and cerebellar nuclei. b, rs1800562 (HFE) identifies the putamen, red nucleus, cerebellar regions, subregions of the caudate, substantia nigra and thalamus. c, rs1131488 (HMBS) identifies subregions of the thalamus and dispersed white matter. d, rs13107325 (SLC39A8) identifies the caudate, substantia nigra and subregions of the pallidum. e, rs4348791 (SLC39A12) identifies the caudate and subregions of the putamen and pallidum. f, rs11012783 (CACNB2) identifies the caudate and subregions of the putamen. g, rs73192811 (TPCN1) identifies the putamen and subregions of the substantia nigra. h, rs10842717 (ITPR2) identifies the putamen. i, rs13105682 (BANK1) identifies the caudate, substantia nigra and subregions of the pallidum. j, rs1126642 (GFAP) identifies subregions of the thalamus and widespread white matter regions.

Similar articles

Cited by

References

    1. Miller KL, et al. Multimodal population brain imaging in the UK Biobank prospective epidemiological study. Nat. Neurosci. 2016;19:1523–1536. doi: 10.1038/nn.4393. - DOI - PMC - PubMed
    1. Dekkers IA, Jansen PR, Lamb HJ. Obesity, brain volume, and white matter microstructure at MRI: a cross-sectional UK biobank study. Radiology. 2019;291:763–771. doi: 10.1148/radiol.2019181012. - DOI - PubMed
    1. Cox SR, et al. Associations between vascular risk factors and brain MRI indices in UK Biobank. Eur. Heart J. 2019;40:2290–2300. doi: 10.1093/eurheartj/ehz100. - DOI - PMC - PubMed
    1. Cox SR, et al. Ageing and brain white matter structure in 3,513 UK Biobank participants. Nat. Commun. 2016;7:13629. doi: 10.1038/ncomms13629. - DOI - PMC - PubMed
    1. Elliott LT, et al. Genome-wide association studies of brain imaging phenotypes in UK Biobank. Nature. 2018;562:210–216. doi: 10.1038/s41586-018-0571-7. - DOI - PMC - PubMed

Publication types