. 2022 Jun;21(6):710-720.
doi: 10.1038/s41563-022-01251-z. Epub 2022 May 23.

STING agonist delivery by tumour-penetrating PEG-lipid nanodiscs primes robust anticancer immunity

Affiliations

STING agonist delivery by tumour-penetrating PEG-lipid nanodiscs primes robust anticancer immunity

Eric L Dane et al. Nat Mater. 2022 Jun.

Abstract

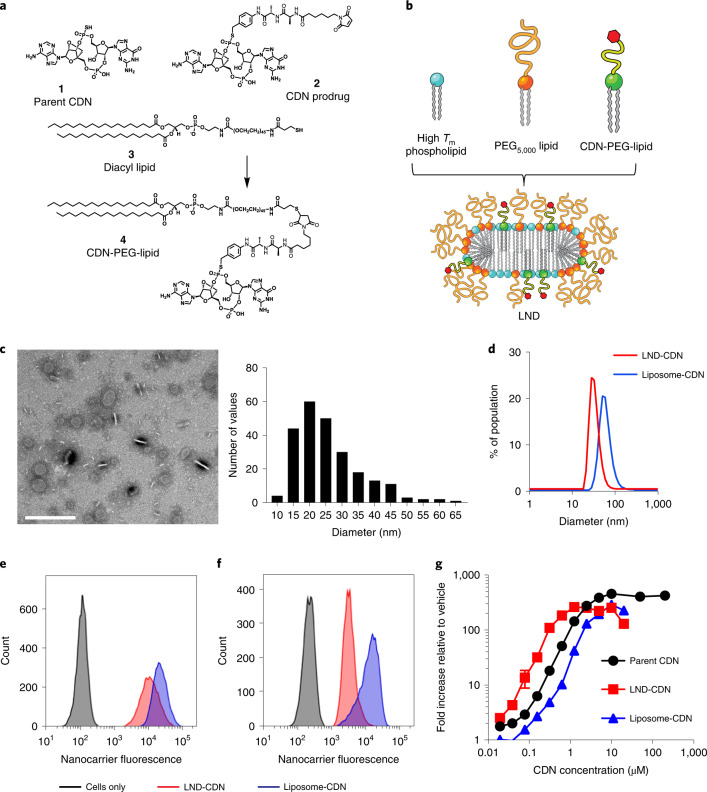
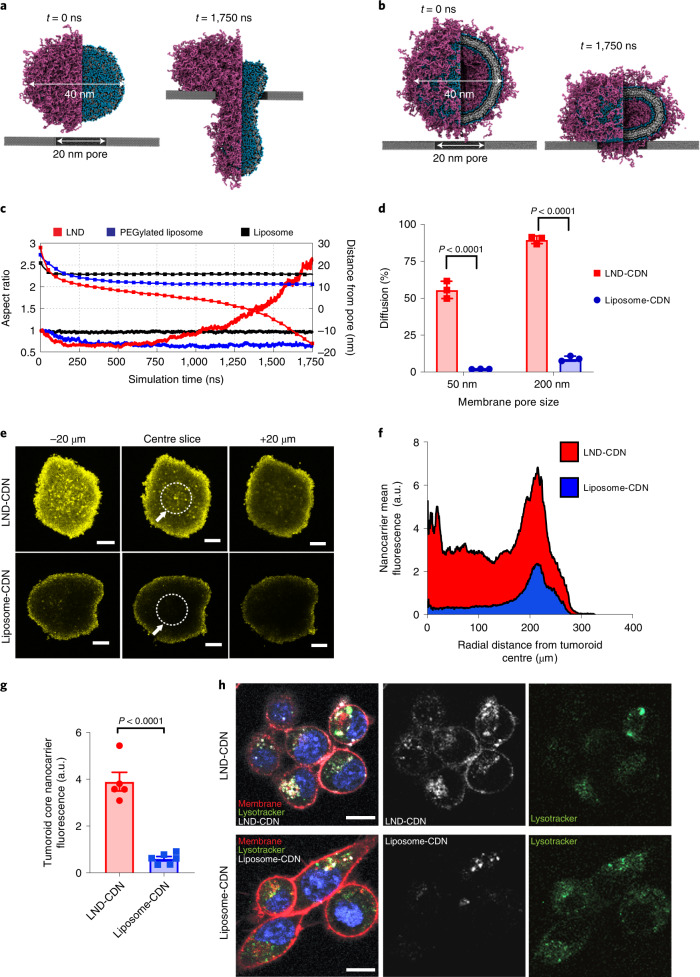
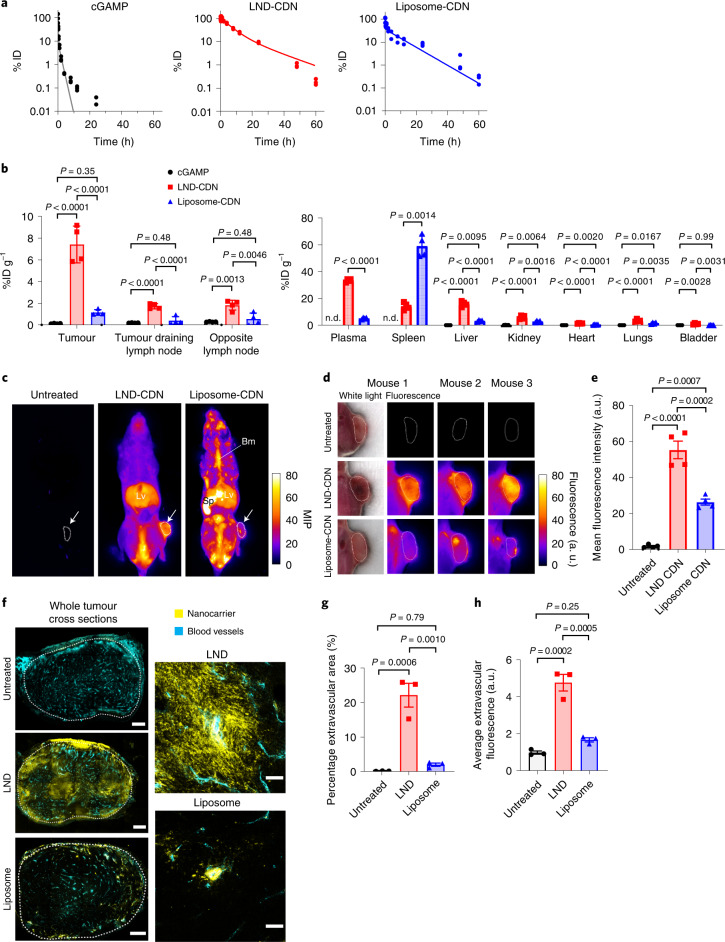
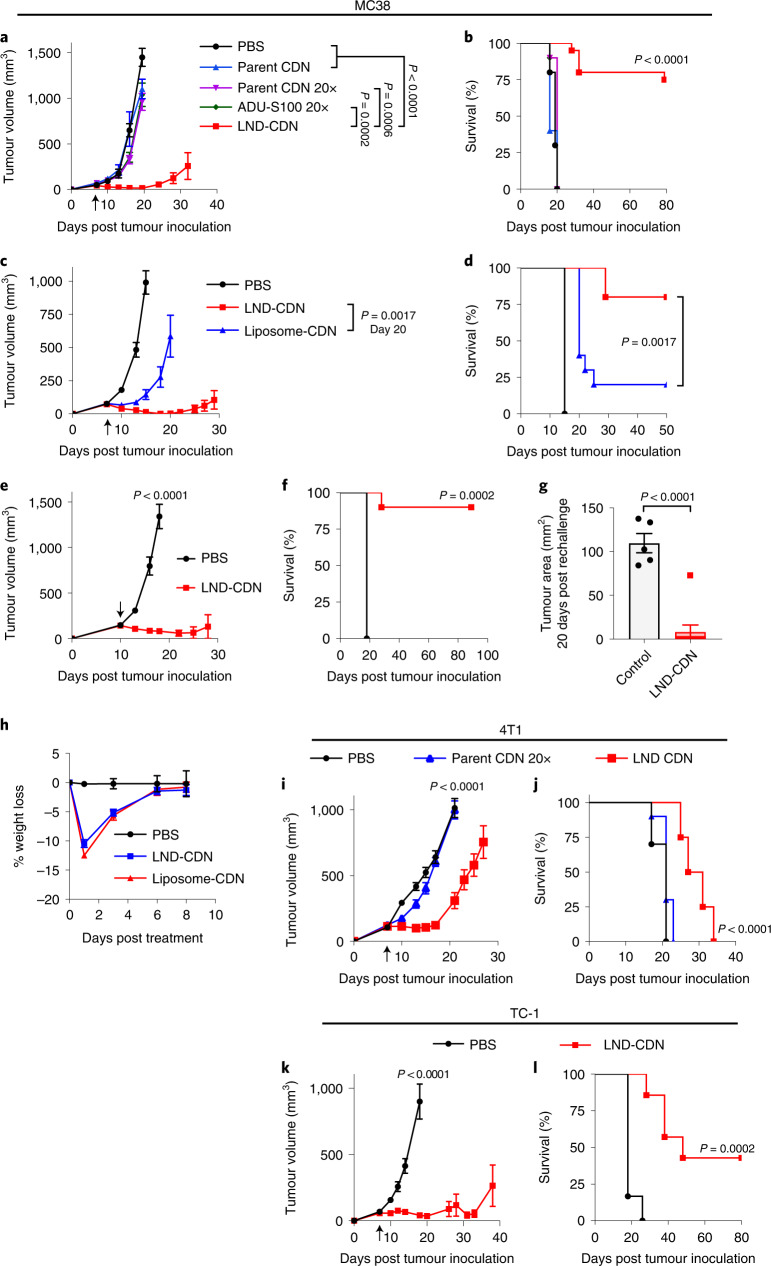
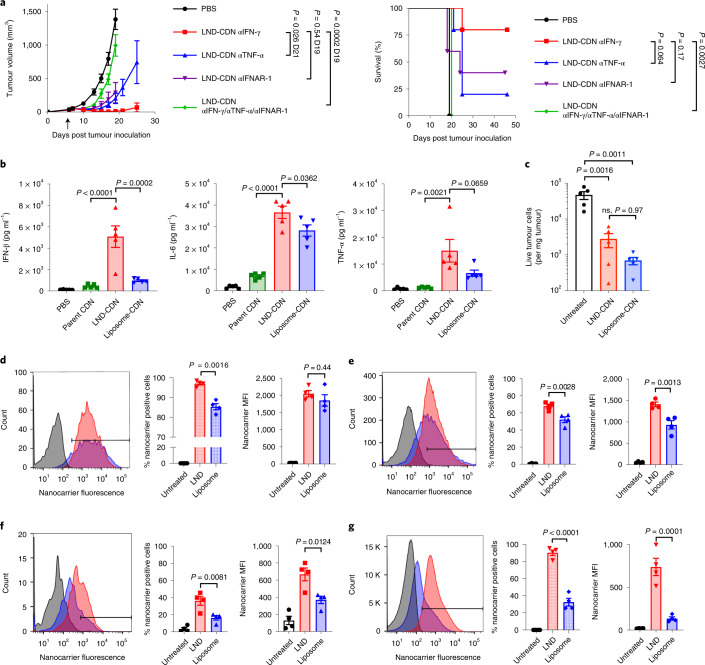
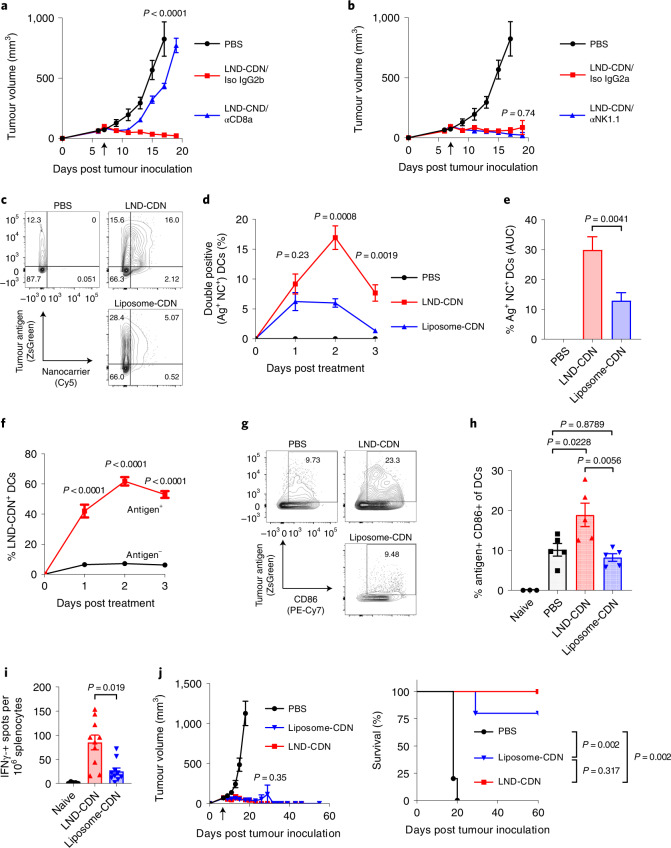
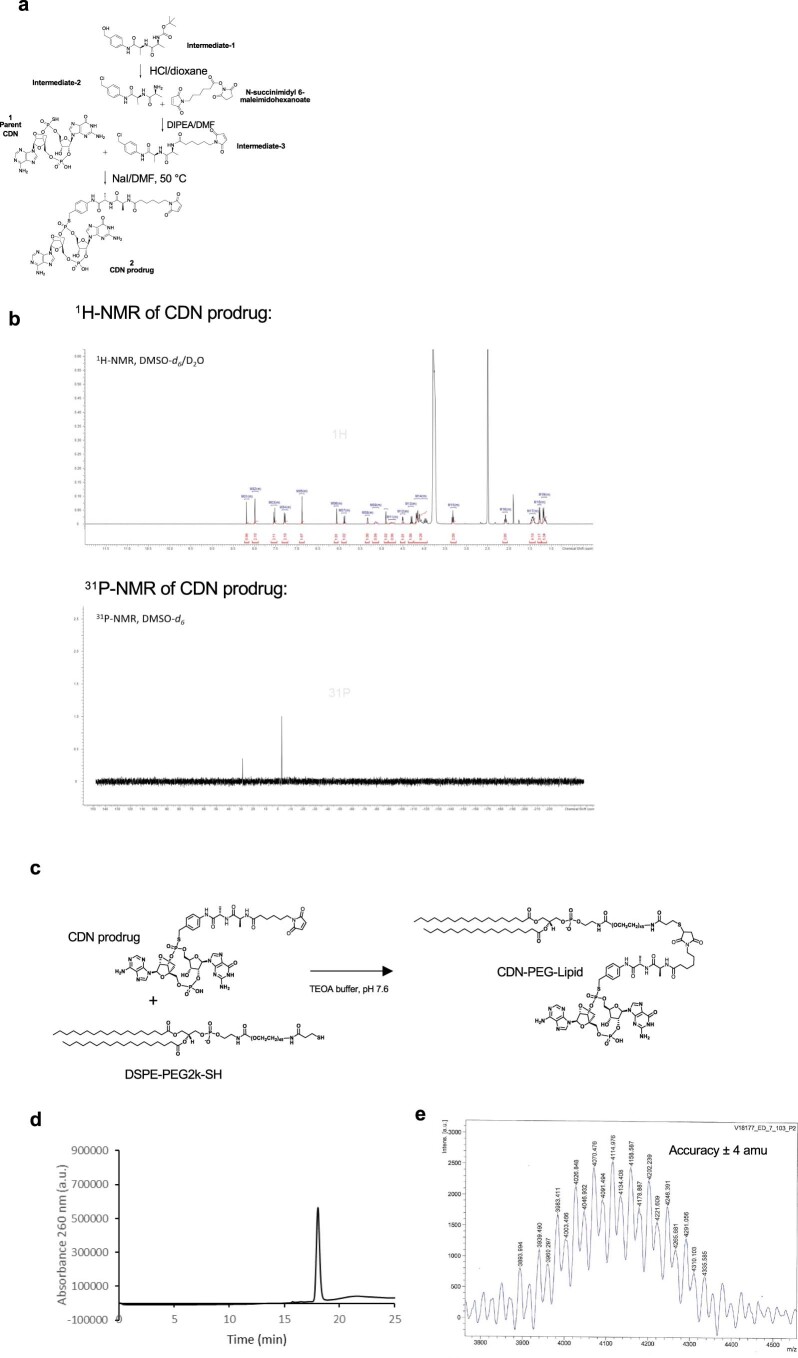
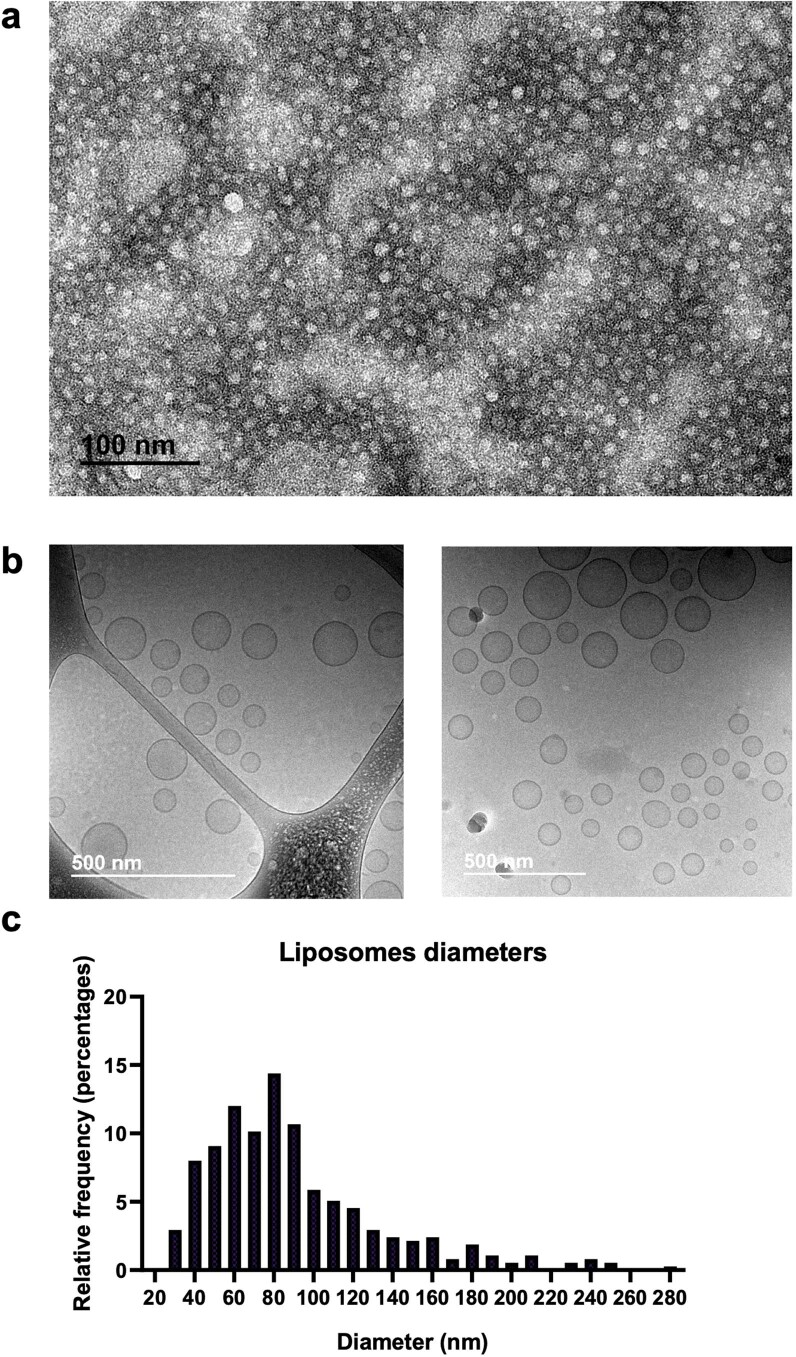
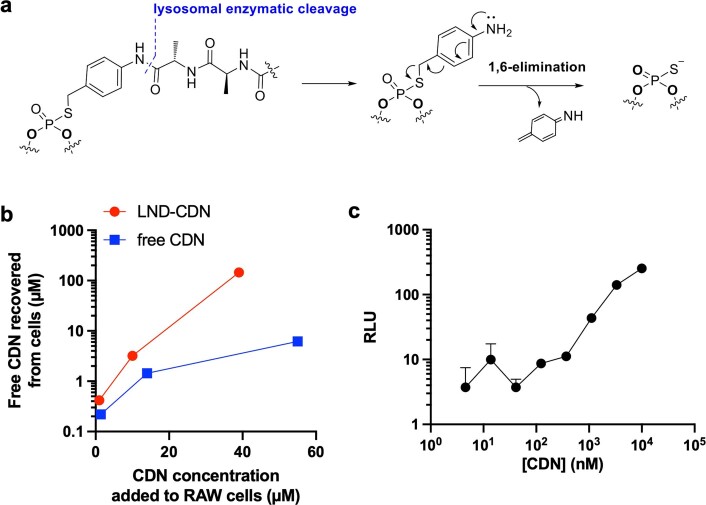
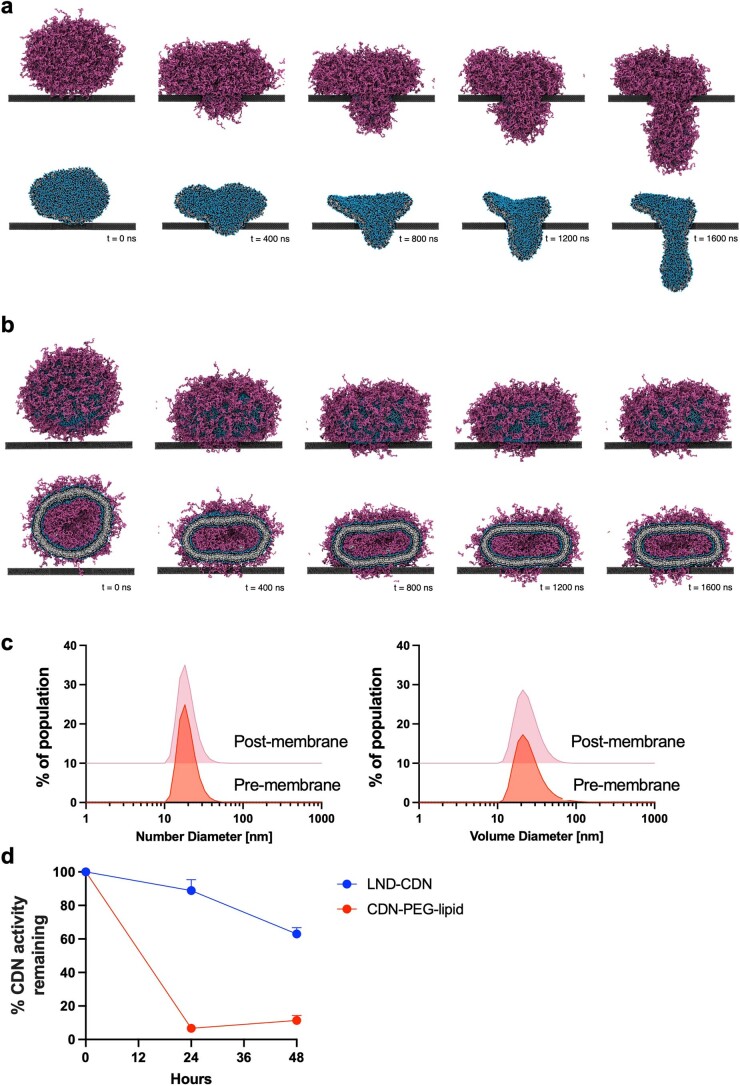
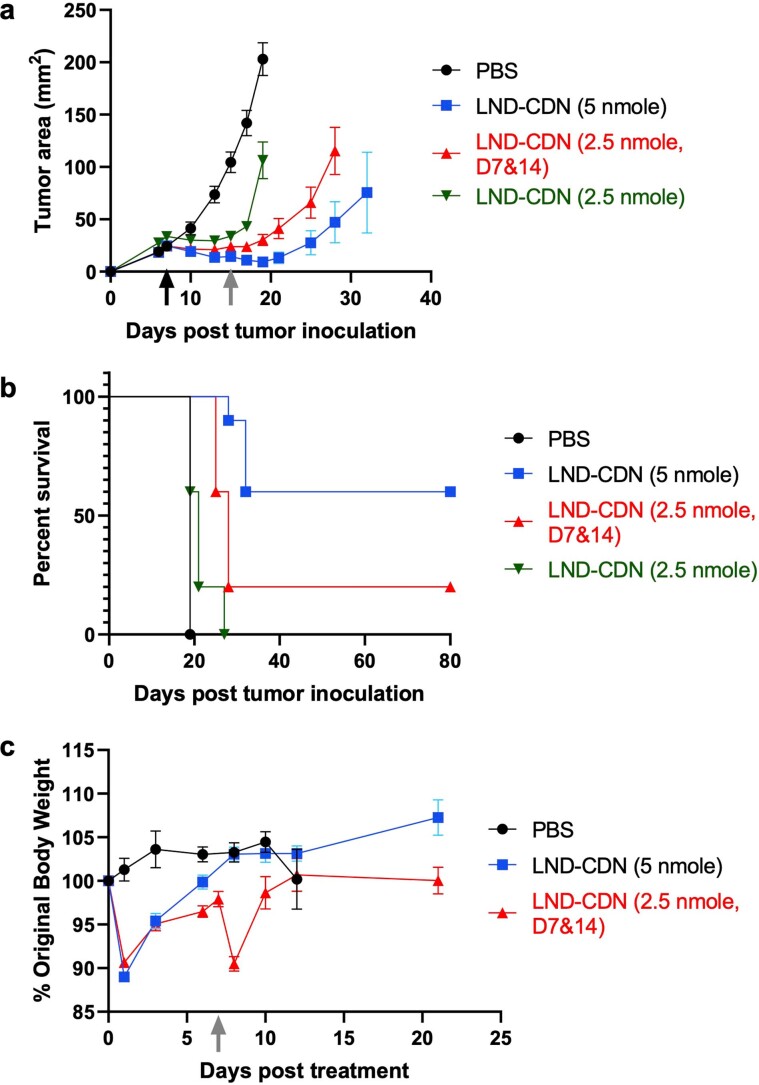
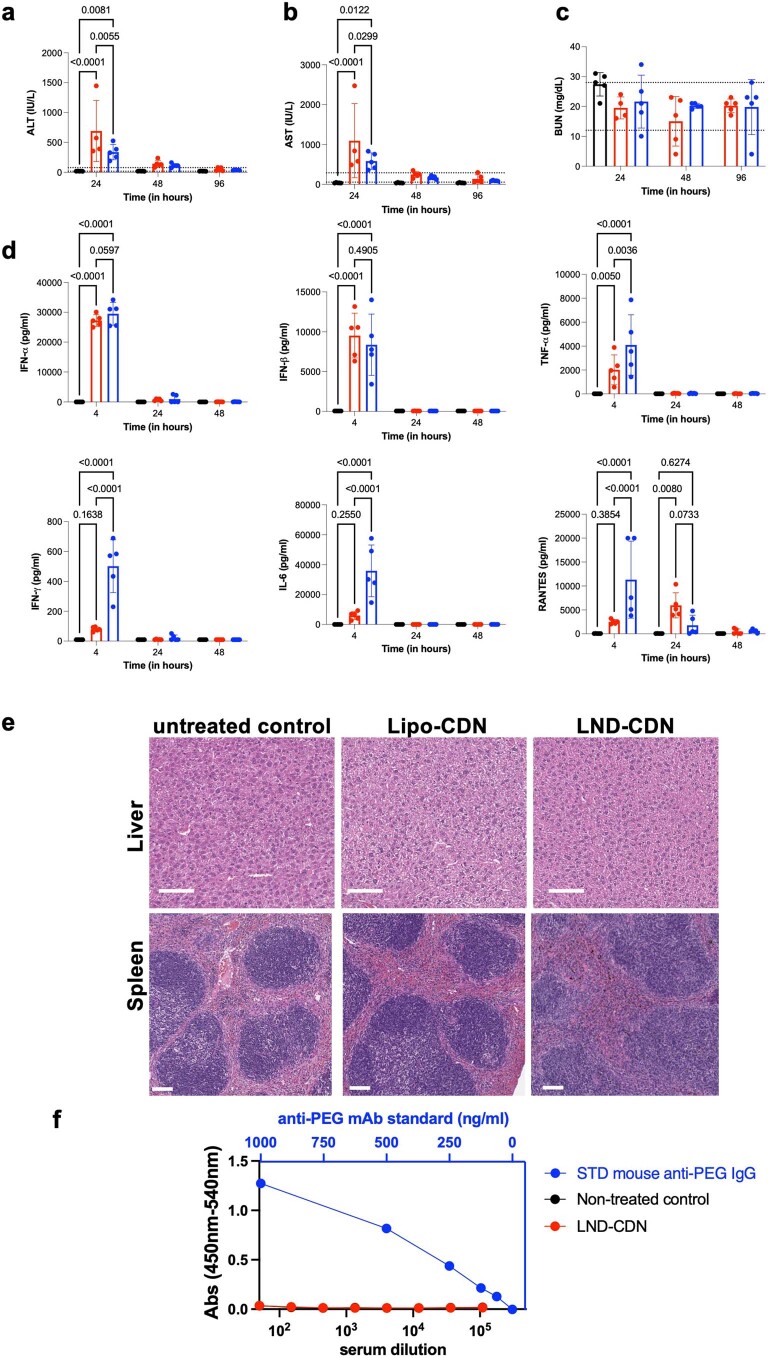
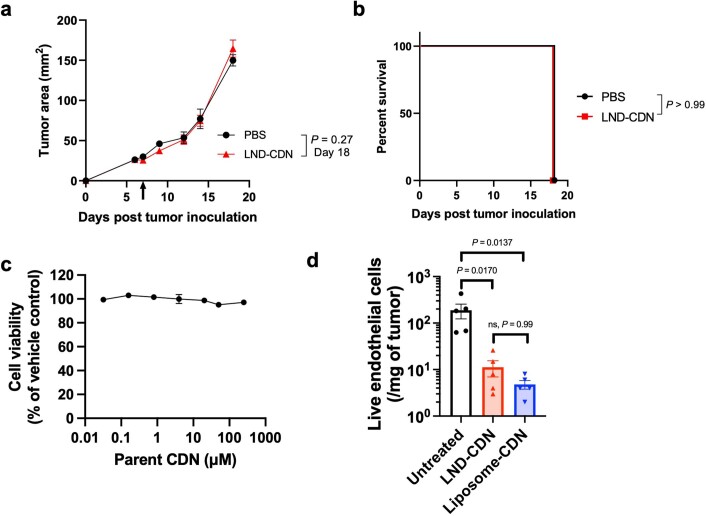
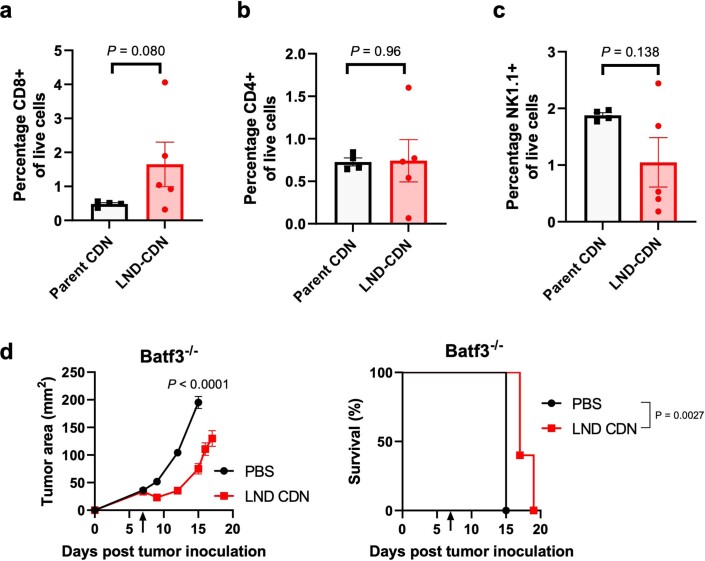
Activation of the innate immune STimulator of INterferon Genes (STING) pathway potentiates antitumour immunity, but systemic delivery of STING agonists to tumours is challenging. We conjugated STING-activating cyclic dinucleotides (CDNs) to PEGylated lipids (CDN-PEG-lipids; PEG, polyethylene glycol) via a cleavable linker and incorporated them into lipid nanodiscs (LNDs), which are discoid nanoparticles formed by self-assembly. Compared to state-of-the-art liposomes, intravenously administered LNDs carrying CDN-PEG-lipid (LND-CDNs) exhibited more efficient penetration of tumours, exposing the majority of tumour cells to STING agonist. A single dose of LND-CDNs induced rejection of established tumours, coincident with immune memory against tumour rechallenge. Although CDNs were not directly tumoricidal, LND-CDN uptake by cancer cells correlated with robust T-cell activation by promoting CDN and tumour antigen co-localization in dendritic cells. LNDs thus appear promising as a vehicle for robust delivery of compounds throughout solid tumours, which can be exploited for enhanced immunotherapy.


Conflict of interest statement

D.J.I., E.L.D. and M.O. are inventors on a patent related to the LND-CDN technology. The remaining authors declare no competing interests.

Figures

Fig. 1
Fig. 1. Design and characterization of nanoparticles for STING agonist delivery.
a, Chemical structures of the parent CDN STING agonist (1), CDN prodrug (2), diacyl lipid (3) and CDN-PEG-lipid (4). b, Schematic of LND containing CDN-PEG-lipid. c, Negative stain transmission electron micrograph of LND-CDNs and histogram of measured LND diameters. Scale bar, 200 nm. This experiment was performed once. d, Dynamic light scattering analysis of LND-CDN (red) and liposome-CDN (blue) particle size distributions. e,f, Representative flow cytometry histograms showing uptake of fluorescent LND-CDN (red) or liposome-CDN (blue) by RAW-ISG cells (STING reporter cell line) (e) or MC38 tumour cells (f) following 24 h incubation at 37 °C with 5 µM CDN in each formulation. g, Dose–response curves showing STING activation in RAW-ISG reporter cells as measured by bioluminescence reporter relative to the vehicle-treated control following 24 h stimulation at 37 °C. Data are presented as mean values ± s.e.m. with n = 4 biologically independent samples for each concentration tested.
Fig. 2
Fig. 2. LND-CDN shows superior passive diffusion and tumour penetration compared with liposome-CDN in vitro.
a,b, Coarse-grained simulation snapshots of an LND (a) and a PEGylated liposome (b), both with a diameter of 40 nm, before (t = 0 ns) and after (t = 1,750 ns) being pulled through a 20 nm pore by a force of 200 kJ mol−1 nm−1. Purple beads represent PEG polymers; blue, black and white beads correspond to lipid headgroups, glycerol groups and hydrophobic tails, respectively. c, Computed aspect ratio (lines) and distance of the particle centroid from the pore (squares) of LND, PEGylated liposome and bare liposome systems as a function of pulling simulation time. d, LND-CDN or liposome-CDN were added to a diffusion chamber at 0.5 µM (CDN concentration) separated from a receiver chamber by a 6 µm thick membrane with the indicated pore size and incubated at 25 °C. Shown is the percentage of particles detected in the receiver chamber after 24 h (mean ± s.e.m.). eg, Fluorescent LND-CDN or liposome-CDN were added to the medium of wells containing MC38 tumour spheroids at 5 μM (CDN concentration) for 24 h, followed by washing to remove particles from the medium and imaging of particle penetration into spheroids by confocal microscopy (n = 5 independent spheroids for LND-CDN and n = 6 independent spheroids for liposome-CDN): representative spheroid z-stack images from the centre focal plane analysed and focal planes 20 µm above and below (e); radial distribution plots of nanocarrier fluorescence (f); and mean particle signal (±s.e.m.) measured in the central 100 µm radius core of spheroids (g, core region denoted by white dotted line and white arrow in e). h, MC38 cells were incubated for 4 h with 5 µM fluorescent liposome-CDNs or LND-CDNs, stained with membrane/nuclear (DAPI)/endosolysosomal (lysotracker) markers, and imaged by confocal microscopy. Shown are representative images from one of two independent experiments. Scale bars, 10 µm. Statistical comparisons in d and g performed using an unpaired, two-tailed Student’s t-test.
Fig. 3
Fig. 3. LND-CDN exhibits efficient tumour penetration in vivo.
a, C57Bl/6 mice (n = 3 animals per group) were injected intravenously with Cy5-labelled cGAMP, Cy5-labelled LND-CDN or liposome-CDN (all at 5 nmol CDN) and plasma levels were quantified by fluorescence measurements over time. Dotted lines show two-phase decay curve fits. b, C57Bl/6 mice (n = 4 animals per group) were inoculated in the flank with 5 × 105 MC38 tumour cells, and 10 days later, 5 nmol Cy5-labelled cGAMP, LND-CDN or liposome-CDN were administered intravenously. Shown is the organ-level biodistribution (mean ± s.e.m.) determined from fluorescence measurements on digested tissues 24 h later. n.d., not detectable. ce, MC38-tumour-bearing mice (n = 4 animals per group) were treated as in b with 5 nmol near-infrared dye-labelled LND-CDN, liposome-CDN or left untreated, and then sacrificed at 4 h. The mice were rapidly frozen and then imaged by cryofluorescence tomography with 50 µm serial sections. c, Representative maximum intensity projections (MIP) of whole mice with tumours identified with a white arrow and outlined with a dotted white line. Lv, liver, Sp, spleen; Bm, bone marrow. d, Enlarged images of a single slice from the middle of representative tumours with the corresponding white-light image shown only for mouse 1. e, Mean fluorescence intensities (±s.e.m.) averaged from three tumour regions of interest per mouse (one at the tumour centre, one 1 mm dorsal and one 1 mm ventral) (n = 4 mice per group). f, MC38-tumour-bearing mice (n = 3 animals per group) were treated with LND or liposomes as in b and tumours were excised 24 h later for histology. High-molecular-weight fluorescein isothiocyanate–dextran (cyan) was injected intravenously 10 min before the mice were sacrificed to label vasculature. Shown are representative whole tumour cross sections and enlarged views of tumour vessels from mice treated with Cy5-labelled LND or liposome (yellow). Scale bars: whole tumour cross sections, 500 µm; enlarged view, 50 µm. g,h, The percentage of the extravascular tumour area with nanoparticle fluorescence (g) and the average fluorescence intensity of the extravascular tumour area (h) was quantified (mean ± s.e.m.). Each point represents one mouse and is the average of two unique tumour cross sections. Statistical comparisons in b, e, g, and h were tested using an ordinary one-way analysis of variance (ANOVA) with Tukey’s multiple-comparisons test.
Fig. 4
Fig. 4. A single dose of LND-CDN shows therapeutic efficacy in multiple syngeneic tumour models.
ad, C57Bl/6 mice were inoculated with 5 × 105 MC38 tumour cells and then treated on day 7 with intravenous administration of PBS vehicle (n = 10), parent CDN (5 nmol per mouse, n = 5), parent CDN (100 nmol per mouse, n = 10), ADU-S100 (100 nmol per mouse, n = 10) or LND-CDN (5 nmol per mouse, n = 20): tumour size (a, mean ± s.e.m) and overall survival (b); or PBS vehicle (n = 9), LND-CDN (5 nmol per mouse, n = 10) or liposome-CDN (5 nmol per mouse, n = 10): tumour size (c, mean ± s.e.m.) and overall survival (d). e,f, Mice with MC38 tumours as in a were treated on day 10 with PBS vehicle (n = 5) or LND-CDN (5 nmol per mouse, n = 10): tumour growth (e) and survival (f). g, Mice (n = 9 animals per group) that rejected their tumour following treatment in e,f were rechallenged with 5 × 105 MC38 tumour cells 90 d following the initial tumour inoculation on the opposite flank and tumour growth was assessed 20 d later (mean ± s.e.m.), compared to naive age-matched control mice (n = 5) given the same tumour challenge. h, C57Bl/6 mice bearing MC38 tumours (n = 5 animals per group) were treated as in c and animal weights were tracked over time. i,j, Tumour growth (i, mean ± s.e.m.) and survival (j) curves of BALB/c mice (n = 10 animals per PBS and parent CDN groups, n = 8 animals per LND-CDN group) implanted orthotopically in the mammary fat pat with 5 × 105 4T1-Luc tumour cells and then treated intravenously on day 7 with PBS vehicle, parent CDN (200 nmol) or LND-CDN (10 nmol). k,l, C57Bl/6 mice were inoculated in the flank with 3 × 105 TC-1 tumour cells and treated intravenously on day 7 with PBS vehicle (n = 6) or LND-CDN (5 nmol, n = 7): shown are tumour growth (k, mean ± s.e.m.) and survival (l). Statistical comparisons among tumour sizes in a, c, e, i and k were tested using an ordinary one-way ANOVA with Tukey’s multiple-comparisons test and in g using an unpaired, two-tailed Student’s t-test. Statistical comparisons between survival curves were performed using a log-rank (Mantel–Cox) test.
Fig. 5
Fig. 5. LND-CDN enhances cytokine production in tumours and delivery of CDN to tumour cells.
a, Tumour growth (mean ± s.e.m.) (left) and survival for mice (n = 5 animals per group) (right) bearing MC38 flank tumours treated with LND-CDN as in Fig. 4a in the presence of neutralizing antibodies against IFN-γ (αIFN-γ), TNF-α (αTNF-α) or IFNAR-1 (αIFNAR-1). b, Mice (n = 5 animals per group) bearing MC38 tumours as in a were treated with 5 nmol parent CDN, LND-CDN or liposome-CDN and cytokine levels (mean ± s.e.m.) in tumour lysates were assessed 4 h later by bead-based ELISA. c, The number of live tumour cells per mg of tumour (mean ± s.e.m.) was quantified by flow cytometry 24 h after treatment with LND-CDN or liposome-CDN, compared with untreated tumours (n = 5 mice per group). dg, MC38-tumour-bearing mice (n = 4 animals per group, mean ± s.e.m. values are shown in bar graphs) as in a were administered Cy5-labelled LND or PEGylated liposomes, and uptake in cells isolated from tumours was assessed 24 h later by flow cytometry: shown are representative histograms, percentage nanoparticle-positive cells and mean fluorescence intensity for tumour endothelial cells (d), CD11b+CD11c- myeloid cells (e), CD11c+CD11b dendritic cells (f) and CD45 non-endothelial cells (g). Statistical comparisons among tumour areas in a and in bg were performed using one-way ANOVA with Tukey’s multiple-comparisons test and survival curves in a were compared using a log-rank (Mantel–Cox) test.
Fig. 6
Fig. 6. Co-localization of tumour antigen and LND-CDN nanoparticles in lymph node dendritic cells leads to effective antitumour T-cell priming.
a,b, Mice with MC38 tumours (n = 5 animals per group) were treated as in Fig. 4a. Depleting antibodies against CD8 (αCD8) (a) or NK1.1 (αNK1.1) (b), or their respective isotype control antibodies (Iso), were administered on days 6, 8, 11 and 15 after tumour inoculation. The graphs show the average tumour growth versus time (error bars, s.e.m.) and the common PBS control group is shown in both graphs for clarity. ch, C57Bl/6 mice (n = 5 animals per group) were inoculated with 5 × 105 MC38-ZsGreen tumour cells in the flank, and 7 d later were left untreated or treated with Cy5-labelled LND-CDN or liposome-CDN (5 nmol CDN). Between 1 to 3 d later, TDLNs were isolated for flow cytometry analysis. Shown are representative flow cytometry plots of tumour antigen and nanoparticle uptake in DCs at day 2 (c), mean ± s.e.m. percentages of tumour antigen ZsGreen+NP+ DCs (d), area-under-the-curve (AUC) of Ag+NP+ DCs over time (e), analysis of mean ± s.e.m. percentages of LND-CDN+ DCs that are Ag+ or Ag- (f), representative flow cytometry plots of tumour antigen uptake and CD86 upregulation in DCs at day 3 (g), and mean ± s.e.m. percentages of tumour antigen ZsGreen+CD86+ DCs (h). i, MC38-tumour-bearing mice (n = 10 animals per group) were treated with LND-CDN or liposome-CDN as in a, and tumour-specific T cells were assayed by IFN-γ ELISPOT 14 d following treatment. j, MC38-tumour-bearing mice (n = 5 animals per group) were treated on day 7 by intratumoral injection of 5 nmol LND-CDN or liposome-CDN. Shown are mean ± s.e.m. tumour area and survival. Statistical analysis of tumour growth in a, b and j was performed using one-way ANOVA with Tukey’s multiple-comparisons test. Statistical comparisons among cell percentages and AUCs in df and h, and tumour growth in j (day 18) were tested using an ordinary one-way ANOVA with Tukey’s multiple-comparisons test. Statistical comparisons among groups in i were tested using Brown–Forsythe and Welch’s ANOVA tests with Dunnett’s T3 multiple-comparisons test. Statistical comparisons between survival curves in j were performed using a log-rank (Mantel–Cox) test.
Extended Data Fig. 1
Extended Data Fig. 1. Characterization of CDN-PEG-lipid prodrug.
a, Synthetic scheme describing the preparation of compound (2) (CDN prodrug) from parent CDN (1) and intermediate-3. b, 1H NMR and 31P-NMR spectra of CDN prodrug. c, Reaction scheme for production of CDN-PEG-lipid. d, HPLC analysis of CDN-PEG-lipid product. e, Mass spectrometry analysis of CDN-PEG-lipid.
Extended Data Fig. 2
Extended Data Fig. 2. Characterization of CDN-liposomes.
a, Representative TEM image of LND-CDN. b, Representative cryoTEM images of liposome-CDN. c, Size histograms of liposomes measured from cryoTEM. TEM results are representative of at least 2 independent experiments.
Extended Data Fig. 3
Extended Data Fig. 3. Release of CDN from the PEG-lipid prodrug in cells.
a, Schematic of the chemistry of enzymatic cleavage of the dipeptide linker and subsequent self-immolative linker reaction. b, RAW macrophages were incubated for 18 hr with parent CDN or LND-CDN at varying concentrations. Cells were washed, then lysed and lysates were probed for quantity of parent CDN recovered by liquid chromatograph MS/MS analysis. c, Human THP-1-ISG reporter cells were incubated with indicated concentrations of LND-CDN for 3 hr, washed into fresh medium, then cultured for an additional 21 hr, followed by measurement of interferon-stimulated gene reporter activation by luciferase expression (n = 2 independent biological samples for each concentration and mean±s.e.m. is plotted; RLU, relative light units).
Extended Data Fig. 4
Extended Data Fig. 4. Stability and pore crossing by LND-CDN vs. liposomes.
a, PEGylated LND with and without PEG molecules represented. b, PEGylated liposome without and with cross-sectional view of liposome interior. c, DLS analysis of LND size distributions before and after diffusion through 50 nm pore diameter membranes. d, LND-CDN or CDN-PEG-lipids were incubated with 10% serum in a dialysis cassette with a 5 KDa MWCO membrane, and STING activation bioactivity remaining in the sample (as assessed by activation of RAW-ISG reporter cells) was measured over time (n = 3 biologically independent samples per timepoint, mean±s.e.m. is plottted).
Extended Data Fig. 5
Extended Data Fig. 5. Lower doses of LND-CDN exhibited similar transient toxicity but substantially reduced efficacy.
Groups of C57Bl/6 mice (n = 10 animals/group) were inoculated with 3 × 105 MC38 tumour cells s.c. in the flank on day 0, then treated on day 7 with a single dose of 5 nmol LND-CDN, a single dose of 2.5 nmol LND-CDN, two doses at days 7 and 14 of 2.5 nmol LND-CDN, or saline control. Shown are tumour growth curves (mean ± s.e.m.) (a), overall survival (b), and weight loss (mean ± s.e.m.) (c) of animals over time.
Extended Data Fig. 6
Extended Data Fig. 6. Systemic responses to LND-CDN and liposome-CDN administration.
a-e, Groups of C57Bl/6 mice (n = 5 animals/group) were treated once by i.v. injection with 5 nmol LND-CDN (red), 5 nmol liposome-CDN (blue), or saline control (black). Shown are serum concentrations of liver enzymes (a) alanine aminotransferase, (b) aspartate aminotransferase, and (c) blood urea nitrogen with the normal ranges indicated by dashed horizontal lines. d, Inflammatory cytokines and chemokines measured by cytokine bead array as a function of time. e, Liver and spleens were collected at 48 hr post dosing for histopathological imaging. Scale bars 100 µm. f, Groups of C57Bl/6 mice (n = 6 (Non-treated control) or 8 (LND-CDN) animals/group) were inoculated with 3 × 105 MC38 tumour cells s.c. in the flank on day 0, then treated on days 7, 14, and 21 with 5 nmol LND-CDN. Serum was collected on day 28 for ELISA analysis of anti-PEG IgG. Shown are raw ELISA absorbances as a function of serum dilution (bottom x-axis) and binding of serial dilutions of a monoclonal anti-PEG antibody standard (‘STD mouse anti-PEG IgG’. top x-axis). Data are shown as mean ± SEM and analysed by two-way ANOVA with Tukey post-test statistical analysis: ns, not significant; *, p < 0.05; **, p < 0.01; ****, p < 0.0001.
Extended Data Fig. 7
Extended Data Fig. 7. LND-CDN treatment of STING-/- mice and CDN response of MC38 cells in vitro.
a,b, Groups of STING-/- mice on the C57Bl/6 background (n = 6 (PBS) or 5 (LND-CDN) animals/group) were inoculated with 5 × 105 MC38 tumour cells in the flank. Seven days later, animals were treated once by i.v. injection with 5 nmol LND-CDN or saline control. Shown are tumour growth (mean ± s.e.m.) (a) and overall survival (b). Statistical comparisons between tumour growth curves were made by an unpaired, two-tailed Student’s t-test; survival curves were statistically compared using a log-rank (Mantel–Cox) test. (c) MC38 tumour cells were incubated with a range of parent CDN concentrations in complete media for 24 hours and, subsequently, cell viability was assessed using a resazurin-based in vitro toxicology assay kit (Millipore Sigma) as per the manufacturer’s instructions. Each point represents the mean of four replicates (±s.e.m.). d, The number of live tumour endothelial cells per milligram of tumour (mean ± s.e.m.) was quantified by flow cytometry 24 h after treatment of MC38 tumours with LND-CDN or liposome-CDN, compared to untreated tumours (n = 5 mice per group). Statistical comparisons were made with a one-way ANOVA with Tukey’s multiple comparisons test.
Extended Data Fig. 8
Extended Data Fig. 8. Flow cytometry gating strategy for identifying tumour endothelial cells, tumour cells, and myeloid cells.
a, Flow cytometry gating strategy to identify tumour endothelial cells (CD45CD31+ CD146+) and non-endothelial tumour cells (all other CD45 cells) is show (see methods for details on tumour digestion and the antibodies used for staining). b, Gating strategy to identify tumour myeloid subsets referred to as CD11b+CD11c cells (CD45+ Ly6G CD11b+ CD11c) and CD11c+ CD11bcells [CD45+ Ly6GDUMP(CD19 CD3e NK1.1)- CD11c+ CD11b] is show (see methods for details on tumour digestion and the antibodies used for staining).
Extended Data Fig. 9
Extended Data Fig. 9. Lymphocyte infiltration in treated tumours and dependence of therapy on Batf3 + dendritic cells.
a-c, Mice (n = 4 (Parent CDN) or 5 (LND-CDN) animals/group) were inoculated with 5 × 105 MC38 tumour cells and treated with 5 nmol of parent CDN or LND-CDN on day 7. Six days later, tumour-infiltrating CD8+ T cells (a), CD4+ T cells (b), and NK cells (c) were assessed by flow cytometry (mean ± s.e.m.). d, Batf3−/− mice bearing MC38 flank tumours (n = 5 animals/group) were treated as in a with LND-CDN or vehicle control and tumour growth (left, showing mean±s.e.m.) and survival (right) were monitored. Statistical comparisons in a-d were made using an unpaired, two-tailed Student’s t-test; statistical comparisons between survival curves in d were performed using a log-rank (Mantel-Cox) test.
Extended Data Fig. 10
Extended Data Fig. 10. Gating strategy for identifying lymph node dendritic cells containing nanoparticle and tumour antigen.
The gating strategy used to identify tumour dendritic cells [CD45+ DUMP(Ly6G CD19 CD3e NK1.1)- CD11c+] containing tumour antigen (ZsGreen) or nanoparticle (Cy5 detected in the APC channel) is shown (see methods for details on tumour digestion and the antibodies used for staining).

Comment in

  • Lipid nanodiscs give cancer a STING.
    Gong N, Mitchell MJ. Gong N, et al. Nat Mater. 2022 Jun;21(6):616-617. doi: 10.1038/s41563-022-01270-w. Nat Mater. 2022. PMID: 35606430 No abstract available.

Similar articles

Cited by

References

    1. Sharma P, Allison JP. The future of immune checkpoint therapy. Science. 2015;348:56–61. doi: 10.1126/science.aaa8172. - DOI - PubMed
    1. Larson, R. C. & Maus, M. V. Recent advances and discoveries in the mechanisms and functions of CAR T cells. Nat. Rev. Cancer10.1038/s41568-020-00323-z (2021). - PMC - PubMed
    1. Chen DS, Mellman I. Elements of cancer immunity and the cancer–immune set point. Nature. 2017;541:321–330. doi: 10.1038/nature21349. - DOI - PubMed
    1. Seelige R, Searles S, Bui JD. Innate sensing of cancer’s non-immunologic hallmarks. Curr. Opin. Immunol. 2018;50:1–8. doi: 10.1016/j.coi.2017.09.005. - DOI - PMC - PubMed
    1. Flood BA, Higgs EF, Li S, Luke JJ, Gajewski TF. STING pathway agonism as a cancer therapeutic. Immunol. Rev. 2019;290:24–38. doi: 10.1111/imr.12765. - DOI - PMC - PubMed

Publication types