. 2022 Jun;19(6):740-750.
doi: 10.1038/s41592-022-01467-6. Epub 2022 May 23.

Single-domain near-infrared protein provides a scaffold for antigen-dependent fluorescent nanobodies

Affiliations

Single-domain near-infrared protein provides a scaffold for antigen-dependent fluorescent nanobodies

Olena S Oliinyk et al. Nat Methods. 2022 Jun.

Abstract

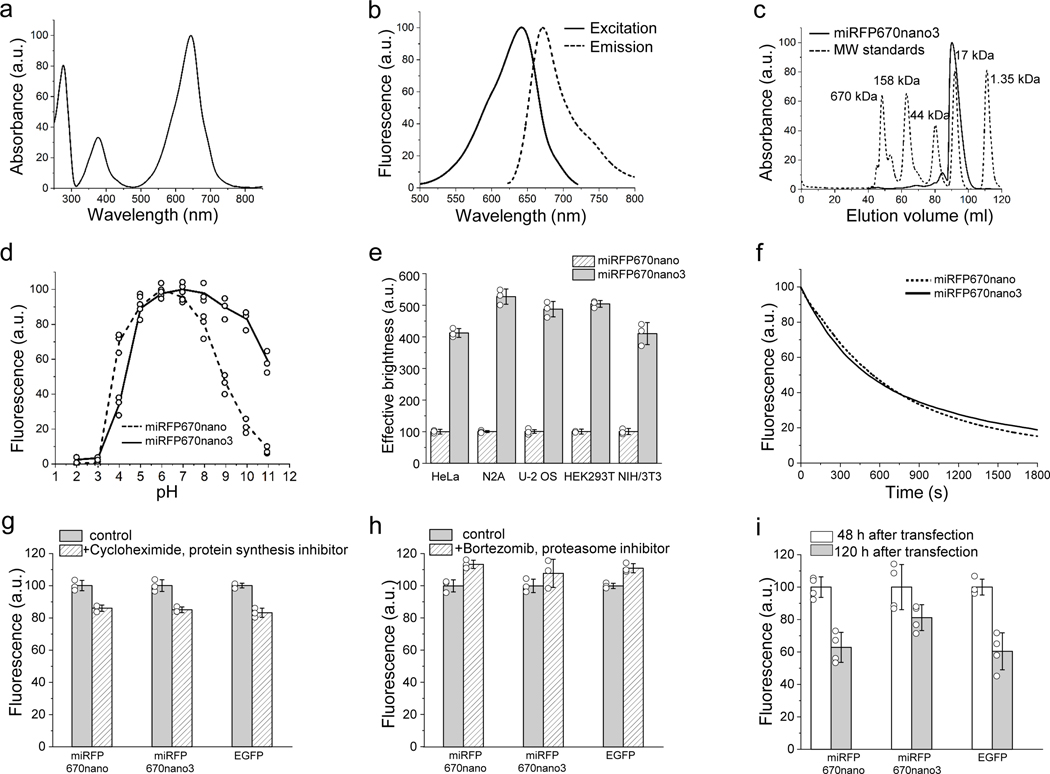
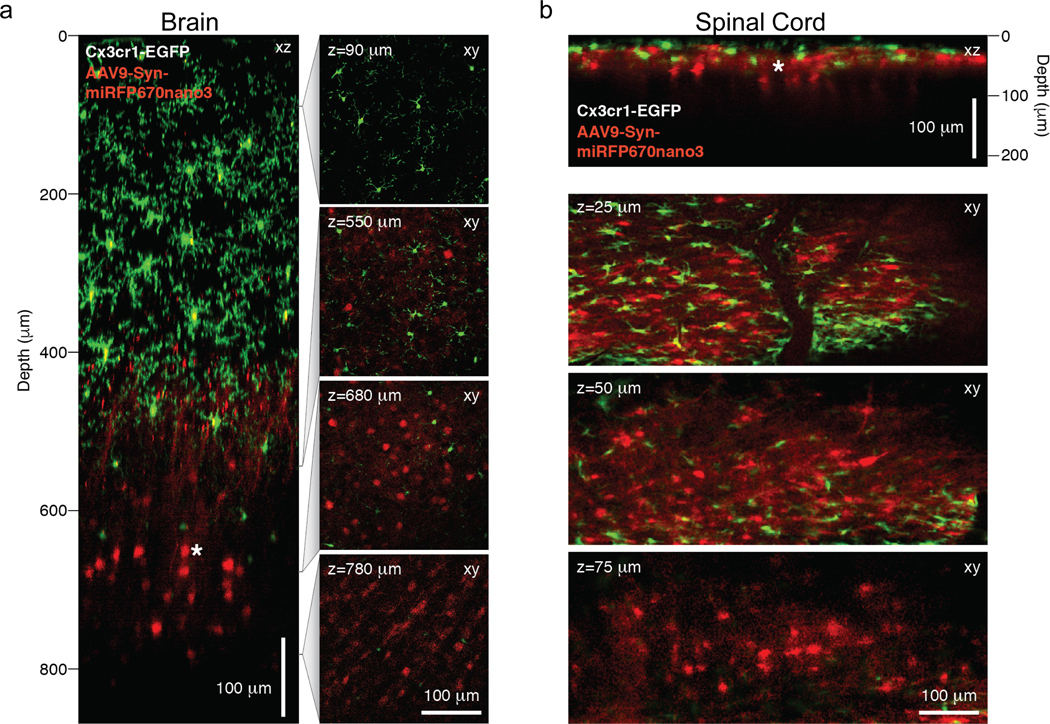
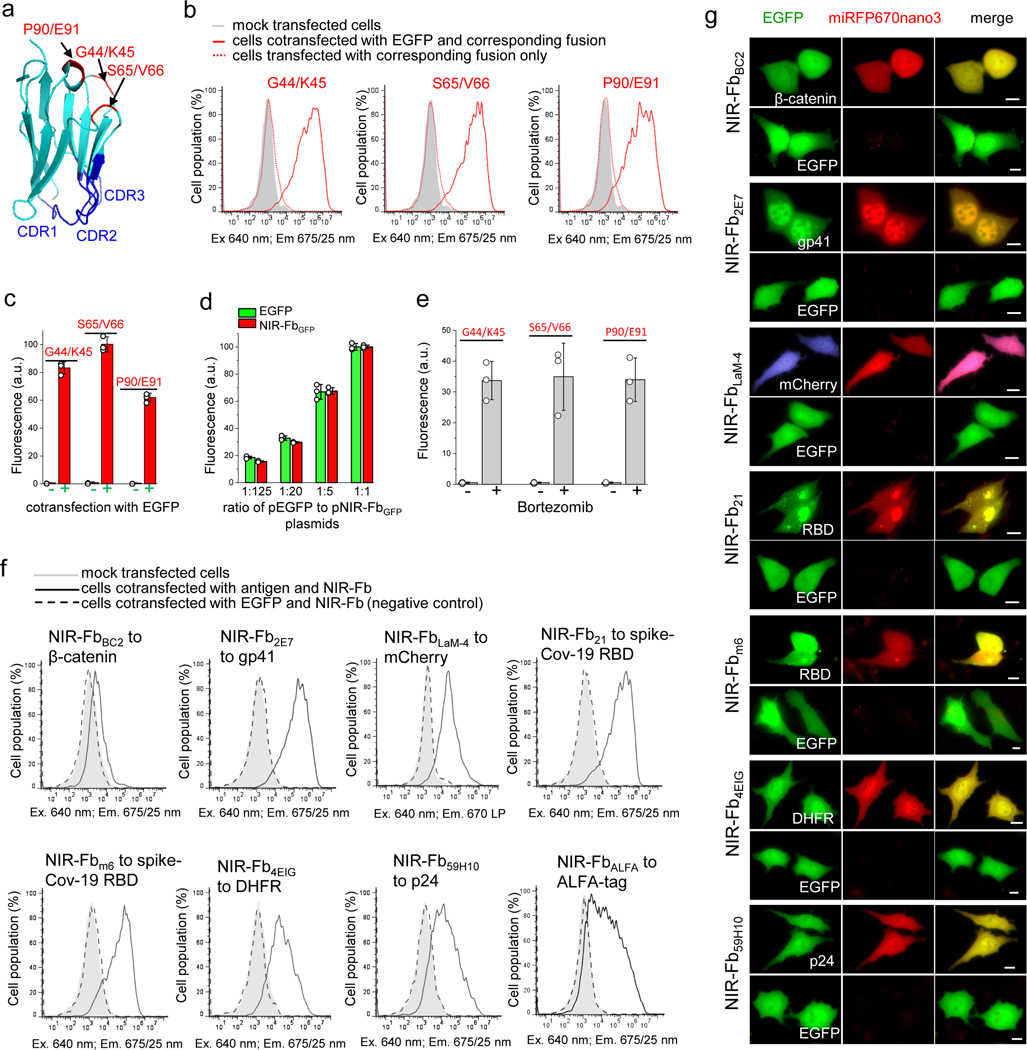
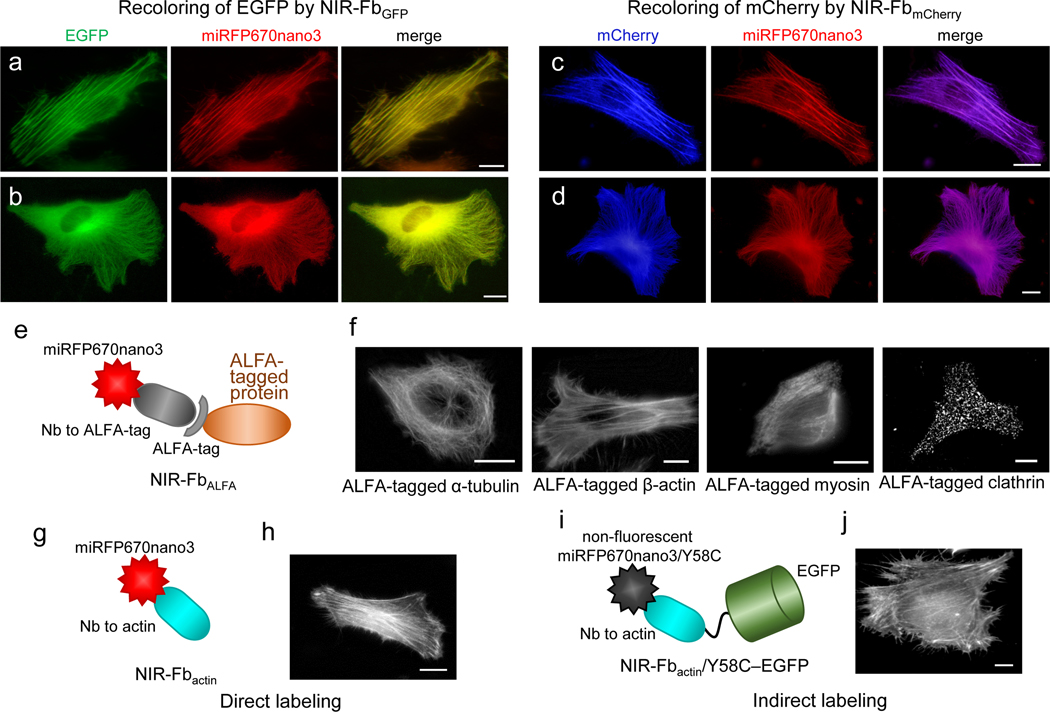
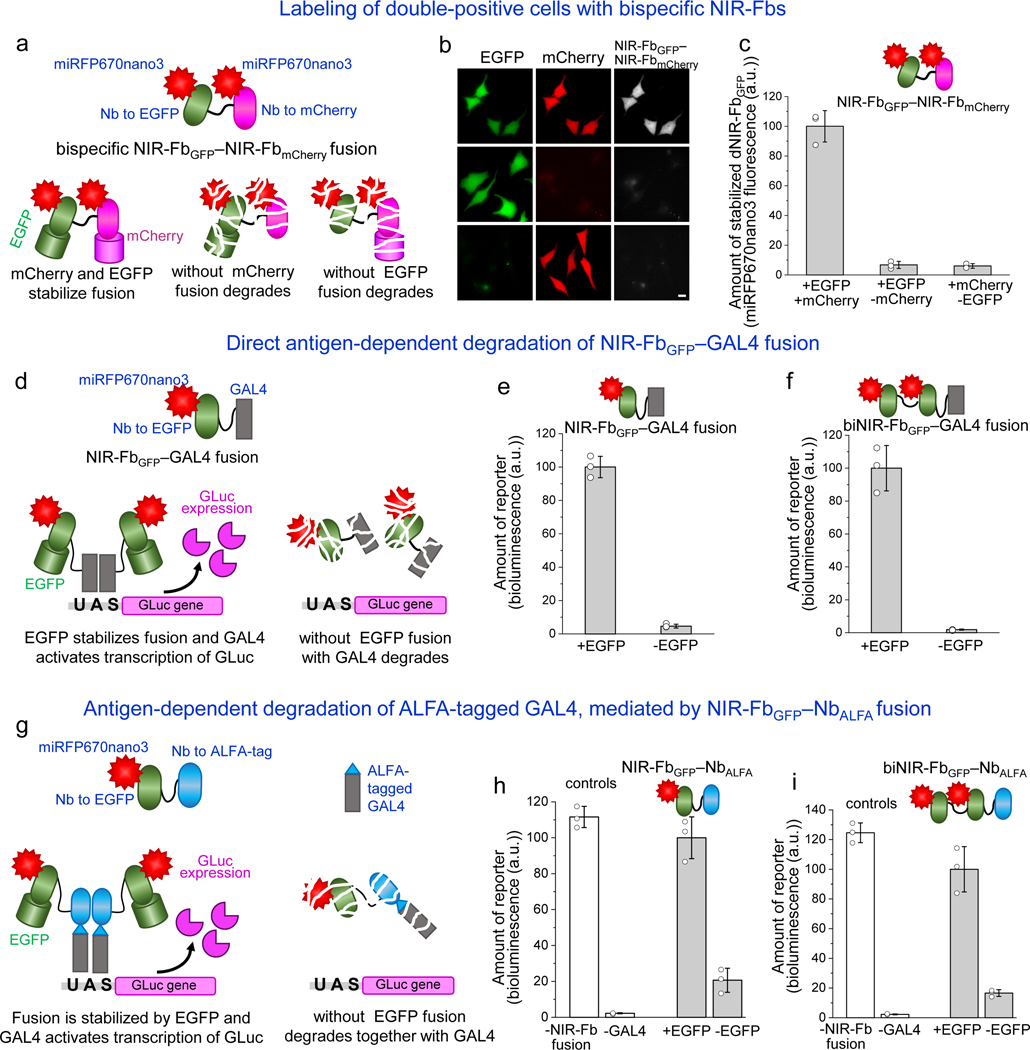
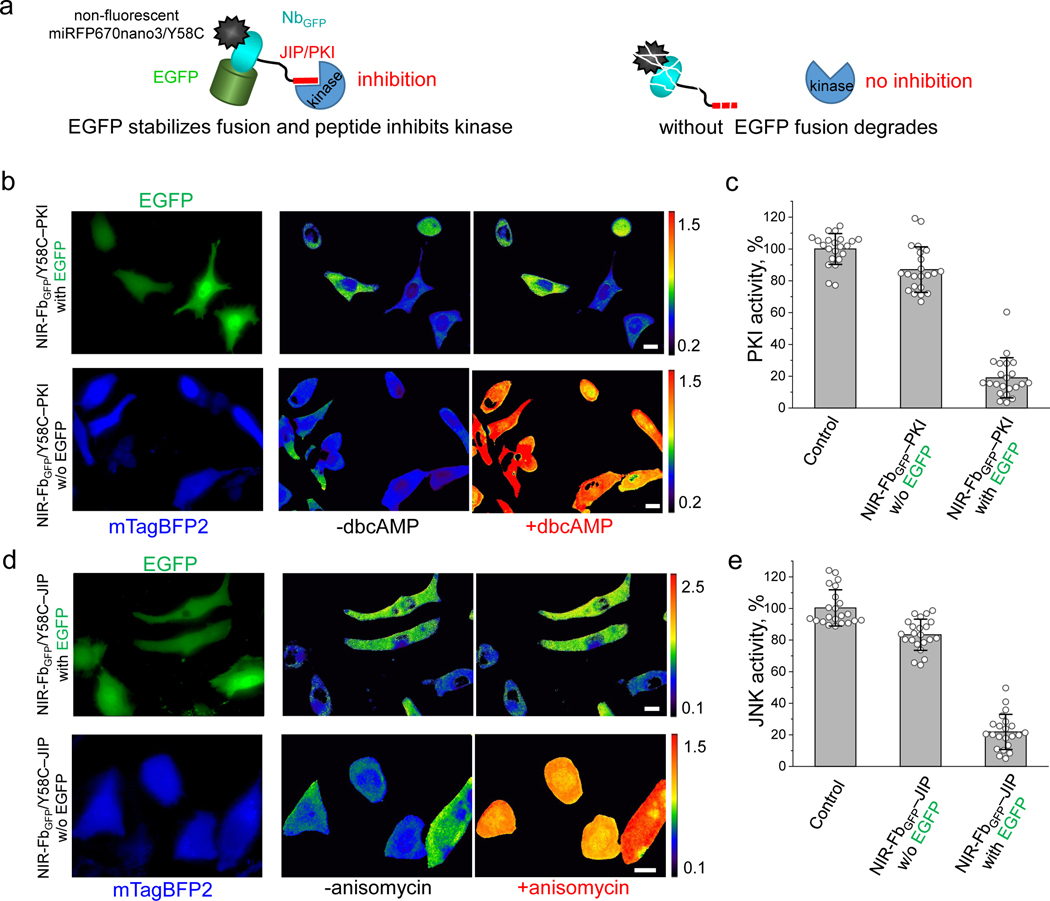
Small near-infrared (NIR) fluorescent proteins (FPs) are much needed as protein tags for imaging applications. We developed a 17 kDa NIR FP, called miRFP670nano3, which brightly fluoresces in mammalian cells and enables deep-brain imaging. By exploring miRFP670nano3 as an internal tag, we engineered 32 kDa NIR fluorescent nanobodies, termed NIR-Fbs, whose stability and fluorescence strongly depend on the presence of specific intracellular antigens. NIR-Fbs allowed background-free visualization of endogenous proteins, detection of viral antigens, labeling of cells expressing target molecules and identification of double-positive cell populations with bispecific NIR-Fbs against two antigens. Applying NIR-Fbs as destabilizing fusion partners, we developed molecular tools for directed degradation of targeted proteins, controllable protein expression and modulation of enzymatic activities. Altogether, NIR-Fbs enable the detection and manipulation of a variety of cellular processes based on the intracellular protein profile.


Figures

Figure 1.
Figure 1.. Characterization of miRFP670nano3 protein.
(a) Absorbance spectra. (b) Fluorescence excitation spectrum recorded at 730 nm emission and emission spectrum recorded at 600 nm excitation. (c) Size exclusion chromatography of miRFP670nano3 and used molecular weight protein standards. (d) pH dependence of miRFP670nano3 fluorescence in comparison with parental miRFP670nano. (e) Effective (cellular) brightness of miRFP670nano3 and miRFP670nano in transiently transfected HeLa, N2A, U-2 OS, HEK293T, and NIH3T3 live cells. Fluorescence intensity was analyzed 72 h after transfection. The effective brightness of miRFP670nano was assumed to be 100% for each cell type. Data are presented as mean values ± s.d. for n = 3 transfection experiments. (f) Photobleaching kinetics of miRFP670nano3 in comparison with parental miRFP670nano in live HeLa cells. (g) Fluorescence intensity of live HeLa cells transiently transfected with miRFP670nano3, miRFP670nano, or EGFP before and after 4 h of incubation with 20 μg/ml cycloheximide. Data are presented as mean values ± s.d. for n = 3 transfection experiments. (h) Fluorescence intensity of live HeLa cells transiently transfected with miRFP670nano3, miRFP670nano, or EGFP before and after 4 h of incubation with 10 μM bortezomib. Data are presented as mean values ± s.d. for n = 3 transfection experiments. (i) Fluorescence intensity of live HeLa cells transiently transfected with miRFP670nano3, miRFP670nano, or EGFP 48 h and 120 h after transfection normalized to that at 48 h. Data are presented as mean values ± s.d. for n = 4 transfection experiments. Fluorescence intensity in (e, g, h, i) was measured by flow cytometry using a 640 nm excitation laser and a 670 nm LP emission filter for miRFP670nano and miRFP670nano3, and a 488 nm excitation laser and a 510/15 nm emission filter for EGFP. Gating was performed as shown in Supplementary Fig. 3.
Figure 2.
Figure 2.. Multiplex two-photon imaging with miRFP670nano3 in the brain and spinal cord of live mice.
(a) Left, xz sub-projection from a xy fluorescence image stack showing neurons (red) and microglia (green) in the somatosensory cortex of a 14-weeks-old Cx3cr1 GFP/+ mouse five weeks after stereotactic AAV9-hSYN-miRFP670nano3 vector delivery into deep cortical layers. Right, four example images from the xy fluorescence image stack at the indicated depths (z) from the pial surface. (b) Top, xz sub-projection from a xy fluorescence image stack showing neurons (red) and microglia (green) in the lumbar spinal cord of a 12.5-weeks-old Cx3cr1 GFP/+ mouse five weeks after stereotactic AAV9-hSYN-miRFP670nano3 vector delivery into superficial dorsal horn laminae. Bottom, three example images from the xy fluorescence image stack at the indicated depths (z) from the pial surface. (a-b) GFP and miRFP670nano3 fluorescence images were acquired simultaneously using a 920 nm excitation light and emission filters 525/70 nm for EGFP and 645/75 nm for miRFP670nano3. No external BV was administered. Representative images of three experiments are shown. Scale bars, 100 μm.
Figure 3.
Figure 3.. Design and evaluation of nanobodies (Nbs) internally fused with miRFP670nanos (NIR-Fbs) in live HeLa cells.
(a) Structure of Nb against GFP (NbGFP) (PDB ID: 3OGO) with indicated positions for insertion of miRFP670nano3. (b) The fluorescence intensity distribution of cells transfected with NbGFP, containing miRFP670nano3 inserted at G44/K45, S65/V66, or P90/E91 positions and co-expressed with or without EGFP. (c) Quantification of the data presented in (b). Data are presented as mean values ± s.d. for n = 3 transfection experiments. (d) Fluorescence intensity of cells transfected with the same amount of the pNIR-FbGFP plasmid and indicated ratios of the pEGFP-N1 plasmid to the pNIR-FbGFP plasmid. Fluorescence intensity of cells transfected with the pNIR-FbGFP and pEGFP-N1 plasmids with the ratio of 1:1 was assumed to be 100% for each FP. Data are presented as mean values ± s.d. for n = 3 transfection experiments. (e) Mean fluorescence intensity of cells transfected with NbGFP, containing miRFP670nano3 inserted at G44/K45, S65/V66 or P90/E91 sites via Gly4Ser linkers before and after 4 h of incubation with 10 μM bortezomib. Fluorescence intensity of cells co-transfected with pEGFP-N1 and NbGFP, containing miRFP670nano3 inserted at Ser65/Val66 was assumed to be 100%. Data are presented as mean values ± s.d. for n = 3 transfection experiments. (f) The fluorescence intensity distribution of cells transfected with NIR-Fbs to indicated antigens and co-expressed with or without cognate antigen. (g) Fluorescence images of cells transfected with NIR-Fbs to the indicated antigens and co-expressed with either mEGFP-labeled cognate antigens or with unfused EGFP as a control. Representative images of two experiments are shown. For imaging of miRFP670nano3 and EGFP, a 605/30 nm excitation and a 667/30 nm emission, and a 485/20 nm excitation and a 525/30 nm emission filter was used, respectively. In (b, c, d, e) fluorescence intensity was analyzed by flow cytometry using a 640 nm excitation laser and a 675/25 nm emission filter for miRFP670nano3, and a 488 nm excitation laser and a 510/15 nm emission filter for EGFP. Gating was performed as shown in Supplementary Fig. 3. In (g) scale bars, 10 μm.
Figure 4.
Figure 4.. Labeling of intracellular proteins with NIR-Fbs in live HeLa cells.
Re-coloring of EGFP and mCherry fluorescent proteins with NIR-Fbs: (a) EGFP-β-actin labeled with NIR-FbGFP, (b) EGFP-α-tubulin labeled with NIR-FbGFP, (c) mCherry-β-actin labeled with NIR-FbmCherry, and (d) mCherry-α-tubulin labeled with NIR-FbmCherry. (e) Schematic representation of NIR-FbALFA to ALFA tag. (f) ALFA-tagged α-tubulin, β-actin, myosin, and clathrin labeled with NIR-FbALFA. (g) Schematic representation of NIR-Fbactin to β-actin. (h) Endogenous β-actin labeled with NIR-Fbactin. (i) Schematic representation of non-fluorescent NIR-Fbactin/Y58C fused with EGFP for indirect EGFP-labeling of β-actin. (j) Endogenous β-actin labeled with NIR-Fbactin/Y58C–EGFP. In (a-d, f, h, j), scale bars, 10 μm. Representative images of two experiments are shown. For imaging of miRFP670nano3, EGFP, and mCherry, a 605/30 nm excitation and a 667/30 nm emission, a 485/20 nm excitation and a 525/30 nm emission, and a 560/25 nm excitation and a 607/36 nm emission filter was used, respectively.
Figure 5.
Figure 5.. NIR-Fb fusions with antigen-dependent properties.
(a) Schematic representation of the bispecific NIR-FbGFP–NIR-FbmCherry fusion. If at least one cognate antigen (EGFP or mCherry) is not expressed in the cell, the whole fusion with the single attached antigen is degraded. (b) Fluorescence images of live HeLa cells transiently co-transfected with NIR-FbGFP–NIR-FbmCherry, EGFP cognate antigen and mCherry cognate antigen (top row), with NIR-FbGFP–NIR-FbmCherry and EGFP only (middle row), or with NIR-FbGFP–NIR-FbmCherry and mCherry only (bottom row). Scale bar, 10 μm. (c) Quantification of the data presented in (b). (d) Schematic representation of NIR-FbGFP–GAL4 and biNIR-FbGFP–GAL4 fusions for the antigen-dependent protein expression. In the presence of cognate antigen (EGFP), NIR-FbGFP–GAL4 or biNIR-FbGFP–GAL4 fusions drive expression of Gaussia luciferase (Gluc) reporter. Without cognate antigen, NIR-FbGFP–GAL4 and biNIR-FbGFP–GAL4 fusions are degraded, resulting in no Gluc expression. Bioluminescence signal of live HeLa cells co-transfected with 5xUAS Gluc, either EGFP or mTagBFP2, and (e) NIR-FbGFP–GAL4 or (f) biNIR-FbGFP–GAL4. (g) Schematic representation of NIR-FbGFP–NbALFA and biNIR-FbGFP–NbALFA fusions for antigen-dependent degradation of ALFA-tagged proteins. In the presence of cognate antigen (EGFP), ALFA-tagged GAL4 drives expression of Gluc reporter, whereas without EGFP the NIR-FB fusions are degraded together with bound ALFA-tagged GAL4. Bioluminescence signal of live HeLa cells co-transfected with ALFA-tagged GAL4, 5xUAS Gluc reporter, either EGFP or mTagBFP2, and (h) NIR-FbGFP–NbALFA or (i) biNIR-FbGFP–NbALFA. In (c, e, f, h, i) data are presented as mean values ± s.d. for n = 3 transfection experiments. For imaging of miRFP670nano3, EGFP, and mCherry, a 605/30 nm excitation and a 667/30 nm emission, a 485/20 nm excitation and a 525/30 nm emission, and a 560/25 nm excitation and a 607/36 nm emission filter was used, respectively.
Figure 6.
Figure 6.. NIR-Fb fusions for modulation of protein kinase activity.
(a) Schematic representation of non-fluorescent NIR-FbGFP/Y58C-PKI fusions with kinase inhibitory peptides (PKIs). In the presence of the cognate antigen (in this case EGFP), the fusions inhibit the kinases activity. If the antigen is not expressed the fusions are degraded. (b) Live HeLa cells expressing NIR fluorescent PKA biosensor, transiently co-transfected with NIR-FbGFP/Y58C–PKI and EGFP cognate antigen (top row), or with NIR-FbGFP/Y58C–PKI and mTagBFP2 control (bottom row). Cells were imaged before and 45 min after the stimulation with dbcAMP. The FRET/donor ratio images are presented using intensity pseudocolor. Scale bar, 10 μm. (c) Quantification of the data presented in (b), control is cells not transfected with NIR-FbGFP/Y58C–PKI. (d) Live HeLa cells expressing NIR fluorescent JNK biosensor transiently transfected with NIR-FbGFP/Y58C–JIP and EGFP cognate antigen (top row), or with NIR-FbGFP/Y58C–JIP and mTagBFP2 control (bottom row). Cells were imaged before and 45 min after the stimulation with 1 μg/ml anisomycin. FRET/donor ratio images are presented using intensity pseudocolor. (e) Quantification of the data presented in (d), control is cells not transfected with NIR-FbGFP/Y58C–JIP. Scale bar, 10 μm. In (c, e) data are presented as mean values ± s.d. for n = 22 cells. For FRET imaging, a 605/30 nm excitation and a 667/30 nm (for miRFP670nano) and a 725/40 nm (for miRFP720) emission filters was used.

Comment in

References

    1. Shcherbakova DM, Stepanenko OV, Turoverov KK & Verkhusha VV Near-Infrared Fluorescent Proteins: Multiplexing and Optogenetics across Scales. Trends Biotechnol 36, 1230–1243 (2018). - PMC - PubMed
    1. Chernov KG, Redchuk TA, Omelina ES & Verkhusha VV Near-Infrared Fluorescent Proteins, Biosensors, and Optogenetic Tools Engineered from Phytochromes. Chem Rev 117, 6423–6446 (2017). - PubMed
    1. Oliinyk OS, Chernov KG & Verkhusha VV Bacterial Phytochromes, Cyanobacteriochromes and Allophycocyanins as a Source of Near-Infrared Fluorescent Probes. Int J Mol Sci 18 (2017). - PMC - PubMed
    1. Shcherbakova DM, Baloban M. & Verkhusha VV Near-infrared fluorescent proteins engineered from bacterial phytochromes. Curr Opin Chem Biol 27, 52–63 (2015). - PMC - PubMed
    1. Tran MT et al. In vivo image analysis using iRFP transgenic mice. Exp Anim 63, 311–319 (2014). - PMC - PubMed

Publication types