. 2022 May 23;13(1):2864.
doi: 10.1038/s41467-022-30600-4.

Multisensory task demands temporally extend the causal requirement for visual cortex in perception

Affiliations

Multisensory task demands temporally extend the causal requirement for visual cortex in perception

Matthijs N Oude Lohuis et al. Nat Commun. .

Erratum in

Abstract

Primary sensory areas constitute crucial nodes during perceptual decision making. However, it remains unclear to what extent they mainly constitute a feedforward processing step, or rather are continuously involved in a recurrent network together with higher-order areas. We found that the temporal window in which primary visual cortex is required for the detection of identical visual stimuli was extended when task demands were increased via an additional sensory modality that had to be monitored. Late-onset optogenetic inactivation preserved bottom-up, early-onset responses which faithfully encoded stimulus features, and was effective in impairing detection only if it preceded a late, report-related phase of the cortical response. Increasing task demands were marked by longer reaction times and the effect of late optogenetic inactivation scaled with reaction time. Thus, independently of visual stimulus complexity, multisensory task demands determine the temporal requirement for ongoing sensory-related activity in V1, which overlaps with report-related activity.


Conflict of interest statement

The authors declare no competing interests.

Figures
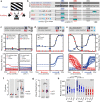
Fig. 1
Fig. 1. Multisensory task contingencies delay reaction time.
a Schematic of task setup. b Example trial structure with reward availability for each cohort. Three cohorts of mice were presented with the same sensory stimuli: continuous drifting gratings that occasionally changed orientation and direction (visual trial) and a continuous tone that changed frequency content (auditory trial, Supplementary Fig. 1). Cohorts differed in reward structure. Noncontingently exposed (NE) mice were not rewarded contingently to the stimuli. Unisensory trained mice (UST) were rewarded for licks to the left spout after visual trials only, i.e., trained on vision only (cyan blocks denote the reward windows). Multisensory trained mice (MST) were rewarded and trained to lick (for instance) left to report visual changes and right to report auditory changes, i.e., discriminate modality. For NE mice, reward windows were temporally decorrelated from the sensory stimuli, and randomly occurred outside the stimulation period (these windows are denoted as cyan blocks with an asterisk). The trial windows indicate the time window used post-hoc to compare stimulus-related lick rates across cohorts; colors of these windows correspond to the different trial types (blue: visual; red: auditory; gray: catch). For NE mice and auditory trials in UST mice, licks to the visual spout and auditory spout that happened to fall in these windows were defined as surrogate “hits” and “errors” (see Methods). ITI: inter-trial interval. c The upper panels show behavioral response rates (dots) and model fits (lines: solid lines for responses to the correct—rewarded—side, dashed lines for responses to wrong—unrewarded—side) for an example session of a noncontingently exposed (NE) mouse. The bottom panels show the average psychometric fits for each mouse obtained by averaging parameters over sessions. Each session was fit with a two-alternative signal detection model (black lines in upper panels, colored in lower panels). d Same as c, but for UST animals. Note how visual hit rates increase as a function of the amount of visual change, but not auditory change. The relatively high lick rate to the visual spout upon auditory changes arises because only that spout was associated with reward in this task. e Same as c, but for MST animals. Hit rates increased as a function of both visual and auditory change. f D-prime across cohorts. Visual d-prime was comparable for UST and MST (ANOVA, n = 151 sessions, F(1,29) = 1.60, p = 0.22,), and lower than auditory d-prime (ANOVA, n = 139, F(1,261) = 36.26, p = 5.84 × 10−9). Each dot is the average over sessions for each animal. Error bars denote the median and interquartile ranges. g The detection threshold for visual orientation changes was comparable for UST and MST (ANOVA, n = 151 sessions, F(1,31) = 0.45, p = 0.51). h Reaction time for the same subjectively salient visual stimuli (see Methods) was significantly shorter for UST compared to MST (ANOVA, n = 3917 trials, F(1,3865) = 60.1, p = 1.11 × 10−14). Saliency levels: sub = subthreshold, thr = threshold, sup = suprathreshold, max = maximal change. Boxplot: dot, median; box limits, 25th and 75th quartiles; whiskers, 1 × interquartile range. **p < 0.01, ***p < 0.001.
Fig. 2
Fig. 2. Multisensory task demands modulate late activity in V1.
a Coronal histological section (3.6 mm posterior to bregma) showing silicon probe tract after recording in V1. b Representative example of current source density (CSD) map and LFP traces for checkerboard stimulation. SG = supragranular, G = granular, IG = infragranular. (CSD analysis was repeated with similar results for all 28 mice to determine the depth of probe insertion). c Raster plots (bottom) and firing rate (top panel) show stimulus-evoked and report-related activity in three example neurons recorded in V1 (Task A). Raster plots are grouped by trial type (visual or catch) and choice. Within trial type, trials are sorted by post-change orientation and response latency (orange ticks). Note that hits and misses in NE mice are surrogate conditions and are defined post-hoc. CR = correct rejection. FA = visual false alarm. d Heatmaps of trial-averaged z-scored activity of all neurons for the three cohorts for the same conditions as in b. NE neurons: n = 159; UST neurons: n = 128; MST neurons: n = 510. e Averaging z-scored firing rate overall neurons for visual and catch trials split by choice reveals biphasic activity in visual hits but not misses, with late activity only present in animals for which visual trials were rewarded (UST and MST). Note the increase in firing rates in FA trials for UST and MST mice but not NE mice. The weak early transient activity during FA trials in UST and MST mice during this noisy change detection task might be the result of stochastic variability interpreted as a sensory signal, i.e., falsely perceived changes, although a motor (lick) related signal cannot be excluded. See Supplementary Fig. 3 for an in-depth analysis of the lick-related nature of these responses. f Same as e, but for each laminar zone (neurons from UST and MST mice combined). Inset: maximum z-score during the early (0–200 ms) and late (200–1000 ms) phase of visual hits (SG: F(1,194) = 4.60, p = 0.03; G: F(1,171) = 0.00, p = 1.00; IG: F(1,1284) = 23.32, p < 0.001, ANOVA). g Histogram of peak-to-trough delay for all neurons (n = 816 neurons) colored by cell type class: narrow-spiking (peak-to-trough delay <0.45 ms; putative inhibitory; blue) and broad-spiking (peak-to-trough delay >0.55 ms; putative excitatory; red). Single units with intermediate peak-to-trough values were unclassified. The peak-to-trough delay was capped at 1 ms for neurons whose trough extended beyond the sampled window. h Normalized average waveform for all V1 neurons colored by cell type class. i Z-scored activity averaged over all broad-spiking V1 neurons (left, n = 421 neurons) or narrow-spiking neurons (right, n = 202 neurons) across UST and MST mice, split by hit/miss response for maximum visual change trials only. Throughout the figure, lines and shading are mean ± SEM.
Fig. 3
Fig. 3. A generalized linear model dissociates time-varying encoding during late activity.
a We constructed a kernel-based GLM encoding model in which variables related to the sensory environment, task, and behavioral state were included as predictors of firing rate. Binary task variables were convolved with raised cosine basis functions that spanned the relevant time window to model transient firing rate dynamics. b Model fits for three example neurons (one V1 neuron from each task version) show that predicted and actual firing rates closely overlap and that both sensory-driven activity (example #1), as well as report-related activity for both visual and auditory hits (examples #2–3), are captured by the model. The five stimulus-response combinations that had the most counts are plotted (trials with false alarms and licks to the incorrect spout are omitted). c Explained variance over time for subsets of predictors. Each line shows how much firing rate variance is explained for each time bin across trials based on only including a subset of all predictors. Shaded area corresponds to s.e.m.
Fig. 4
Fig. 4. The onset of late activity is delayed in MST mice.
a The Venn diagrams show for each training cohort the percentage of neurons encoding orientation (grating after stimulus change), occurrence (presence of a visual change or not), or hit/miss (visual hits versus visual misses, with no lick response) as established with ROC analysis. Only maximum visual change trials were used. Shown are percentages out of all coding neurons; percentage of non-coding neurons per cohort: NE: 15.5%; UST: 13.3%, MST: 35.6%. b Fraction of neurons (summed over all recordings) coding for task-relevant variables over time. Each coding fraction is baseline-subtracted and normalized by its maximum. Visual hit/miss coding (hits vs misses) was only present in UST and MST mice (as expected) and started earlier in UST than MST mice (highlighted with black arrows). c Heatmaps of the fraction of coding neurons across time and cortical depth, with neurons binned based on their recorded depth relative to the granular layer (400–550 μm from dura). Only UST and MST cohorts were included to compare sensory and hit/miss coding in the same datasets. SG = supragranular, G = granular, IG = infragranular. Occurrence coding, 0–200 ms, ANOVA, SG versus IG, F(1,16) = 7.21, p = 0.016. Hit/miss coding, Thr, 200–1000 ms, G vs IG, F(1,15) = 5.21, p = 0.037; Max, G vs IG, F(1,15) = 4.96, p = 0.042. Significance (sidebars): *p < 0.05. d Earliest increase in the fraction of significantly coding neurons. Mean ± 95% CI (bootstrap). The apparent fast onset of visual occurrence coding is likely due to temporal smoothing of firing rates. (Bootstrap test, two-sided, UST n = 128, MST n = 306 neurons, p = 0.012) e Reaction time correlated with the onset of hit/miss coding in population-averaged activity (ANOVA, n = 26 sessions, F(1,24) = 5.15, p = 0.03). Gray dotted line shows linear regression fit. Each dot is one session. Error bars show mean ± SEM. f Same as e, but now for the bootstrapped average for each visually trained condition using single-neuron AUC (as in d). Reaction time correlated with the earliest moment of significant hit/miss coding (ANOVA, F(1,2) = 102.33, p = 0.0096). Error bars show bootstrapped mean and 95% CI. Blue dotted line at 200 ms marks the time point where late photostimulation was applied (see Fig. 5d). At this point, unisensory trained mice already showed hit/miss- coding in V1, while multisensory trained mice did not.
Fig. 5
Fig. 5. Late silencing of V1 selectively impairs task performance of sessions with slow reaction time.
a Cre-dependent ChR2 expression in bilateral V1 of PvCre mice allowed robust silencing by locally enhancing PV-mediated inhibition. A1 = auditory cortex, S1 = primary somatosensory cortex. b Dorsal view of flattened cortical hemispheres sectioned approximately through layer 4 showing localized viral expression in bilateral V1. (Repeated with similar results for all 28 mice) c High-pass filtered trace from an example V1 recording site showing robust silencing of multi-unit spiking activity during bouts of 1-s photostimulation (blue bars). d Baseline-normalized firing rate averaged over V1 neurons from UST and MST mice. Control trials are visual hits. Mean ± SEM. e Behavioral response rates for control, early, and late silencing trials follow plotting conventions of Fig. 1c–e. f Same as e, but for MST mice. Both early and late silencing affected visual change detection rates. For the increase in FA see Methods. g Early silencing affected visual discrimination performance (d-prime) for both saliencies across UST and MST cohorts. (ANOVA, UST n = 18, MST n = 34 sessions, UST Thr, F(1,32) = 16.71, p = 0.0032; UST Max, F(1,32) = 14.80, p = 0.0064; MST Thr, F(1,59) = 35.32, p = 2 × 10−6; MST Max, F(1,58) = 32.56, p = 5 × 10−6, each corrected for four multiple comparisons (Bonferroni-Holm)) h Effect of late silencing depended on task type: late silencing only reduced d-prime in MST (same n as g, ANOVA, Thr, F(1,54) = 13.90, p = 0.00553, Max, F(1,53) = 13.48, p = 0.0067), but not UST mice (Thr, F(1,32) = 0.29, p = 1, Max, F(1,30) = 1.19, p = 0.85). For both g and h, *p < 0.05, **p < 0.01,***p < 0.001, errorbars denote inter-quartile range. i The effect of early silencing (quantified as the reduction in d-prime) was not significantly correlated with the median reaction time in control trials from the same session (ANOVA, n = 40 conditions, F(1,33) = 1.71, r = 0.048, p = 0.865). j Same as i but for late silencing. The effect of late silencing was significantly correlated with the reaction time (n = 45, F(1,15) = 10.04, r = 0.423, p = 0.03).
Fig. 6
Fig. 6. Extended causal requirement of V1 generalizes to visuotactile side detection.
a Schematic of the visuotactile two-sided detection task in which mice reported the side of visual and/or tactile stimulation. b Psychometric fits for visual and tactile detection for each mouse trained in the UST and MST version of the task. Same conventions as in Fig. 1c–e, with the x-axis running left for visual/tactile stimuli presented to the left side and right for visual/tactile stimuli presented to the right side. Visual and tactile intensities were normalized for rendering purposes. c Average z-scored firing rate of responsive V1 neurons during visual (max contrast) and catch trials, split by trial outcome. Only neurons from MST mice are shown. The dashed blue line indicates the onset of optogenetic silencing. Similar to Task A, contralateral hits elicit more late activity compared to misses. Also note the weak early transient activity during FA trials (analogously to Task A, see Fig. 2e). Shaded area: bootstrapped 95% confidence intervals. d Visual d-prime across V1 inactivation conditions. Early V1 inactivation (left) impaired the detection performance of contralateral threshold-level visual stimuli in both UST (ANOVA, n = 7 sessions, F(1,14) = 24.57, p = 0.0006318) and MST (ANOVA, n = 6, F(1,12) = 17.93, p = 0.0023), without effect on ipsilateral threshold-level stimuli nor contralateral maximum-level stimuli. Late silencing (right) only affected detection performance of contralateral threshold stimuli in MST mice (ANOVA, n = 7 sessions, F(1,14) = 45.14, p = 0.000036), but not in UST mice (ANOVA, n = 7, F(1,14) = 2.15, p = 0.164). **p < 0.01, ***p < 0.001. Each corrected for four multiple comparisons (Bonferroni-Holm). Errorbars denote inter-quartile range. e Reduction in d-prime by late silencing correlated with the median reaction time on corresponding control trials (ANOVA, n = 30 conditions, F(1,26) = 9.785, p = 0.00427, r2 = 0.7056). Each dot represents a session.
Fig. 7
Fig. 7. Onset of report-related activity in task A and drop in noise correlations predict effects of late silencing.
a Average spiking rate for all orientation-selective neurons for preferred and non-preferred orientations is split by hits and misses (UST and MST neurons combined; task A). b Orientation decoding performance over time. Right panel: decoding performance increased post-stim (0 to +500 ms) versus pre-stim (−500 to 0 ms; n = 11 sessions, cohorts combined, ANOVA, F(1,17) = 44.76, p = 4.1 × 10−6) and increased in individual sessions from all cohorts (colored dots). c Change in noise correlation (NC) relative to baseline (200 to 1000 ms compared to baseline −500 to 0 ms) for visual trials split by choice and cohort (for auditory trials, see Supplementary Fig. 9a). Boxplots show the median and interquartile range (box limits) and 0.5 × interquartile range (whiskers). Noise correlations decreased only during hits in UST and MST mice (ANOVA, UST, n = 1930 pairs, F(1,3856) = 82.44, p < 1 × 10−19; MST n = 13972, F(1,28188) = 142.96, p < 1 × 10−33). Misses in NE mice were associated with a slight increase in noise correlations (n = 2904 pairs, F(1,5805) = 14.67, p < 0.001). d Reaction time distributions for visual hits in UST and MST cohorts and tertile ranges. e1 Noise correlations over time with respect to baseline, either aligned to stimulus change (left) or first lick (right). Horizontal dashed lines indicate for each tertile the threshold for each tertile for the onset of the drop in NCs (below 2 standard deviations of the baseline; −500 to 0 ms) and this onset is highlighted with colored arrows. Note how noise correlations (aligned to stimulus change) drop first in fast trials, and progressively later in medium and slow trials. Right panels show that, when aligning to lick onset, the drop in noise correlations precedes reaction times by a similar lag, independent of reaction time tertile. e2 Same as e1, but for MST mice. f Reaction time and moment of decorrelation were significantly correlated (Pearson correlation, n = 6, r = 0.960, p = 0.002). Scatterplot shows median reaction time and earliest time point of decorrelation for each tertile in the two visually trained cohorts. g Average Z-scored firing rates just before photostimulation (100–200 ms) were higher if the trial resulted in a visual hit rather than a miss in UST mice (Thr: F(1,156) = 10.16, p = 0.002; Max: F(1,152) = 5.66, p = 0.019; ANOVA). h Same as g, but for MST mice. Firing rates just before photostimulation were higher for hits than misses only for threshold visual changes (F(1,268) = 13.19, p = 0.001), but not maximal changes (F(1,254) = 0.59, p = 0.44). i Noise correlations for visual hit and miss trials before photostimulation onset (grouped across UST and MST cohorts and saliency levels). Black bar on top indicates time bins with significantly different NCs between hits and misses (p < 0.05). Throughout the figure, lines and shading are mean ± SEM.
Fig. 8
Fig. 8. Schematic summary of results.
Increased task demands (in our tasks imposed by multisensory requirements) delay the onset of the late report-related wave of activity and drop in noise correlations, and extend the causal involvement of V1. Jointly, these processes predict the behavioral effect of late V1 inactivation on visual detection, and whether a trial is going to be a hit or a miss.

Similar articles

Cited by

References

    1. Harris KD, Mrsic-Flogel TD. Cortical connectivity and sensory coding. Nature. 2013;503:51–58. - PubMed
    1. Crochet, S., Lee, S.-H. & Petersen, C. C. H. Neural circuits for goal-directed sensorimotor transformations. Trends Neurosci. 10.1016/j.tins.2018.08.011 (2018). - PubMed
    1. Supèr H, Spekreijse H, Lamme VAF. Two distinct modes of sensory processing observed in monkey primary visual cortex (V1) Nat. Neurosci. 2001;4:304–310. - PubMed
    1. Cul AD, Baillet S, Dehaene S. Brain dynamics underlying the nonlinear threshold for access to consciousness. PLOS Biol. 2007;5:e260. - PMC - PubMed
    1. DiCarlo JJ, Zoccolan D, Rust NC. How does the brain solve visual object recognition? Neuron. 2012;73:415–434. - PMC - PubMed

Publication types

LinkOut - more resources