Observational Study
. 2022 Jun;28(6):1303-1313.
doi: 10.1038/s41591-022-01837-9. Epub 2022 May 23.

A multisystem, cardio-renal investigation of post-COVID-19 illness

Collaborators, Affiliations
Observational Study

A multisystem, cardio-renal investigation of post-COVID-19 illness

Andrew J Morrow et al. Nat Med. 2022 Jun.

Abstract

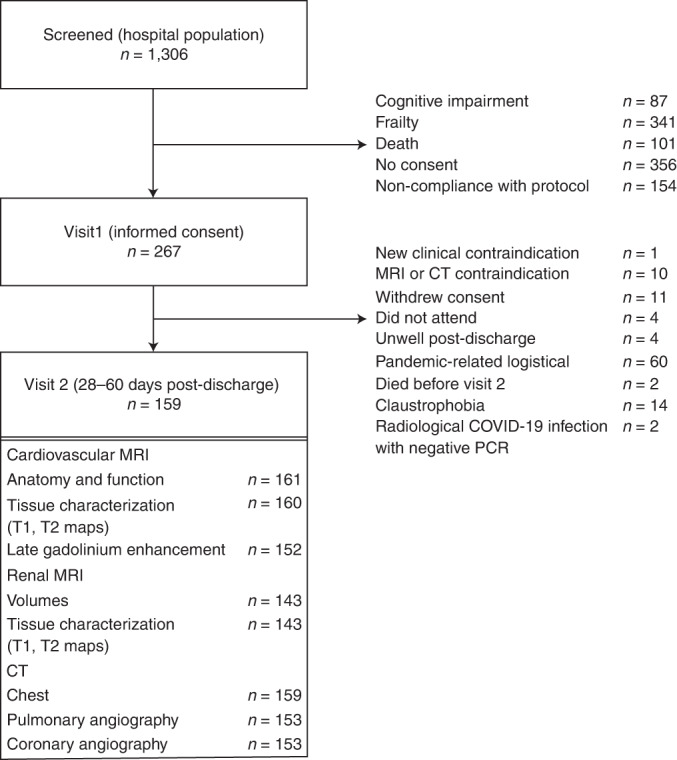
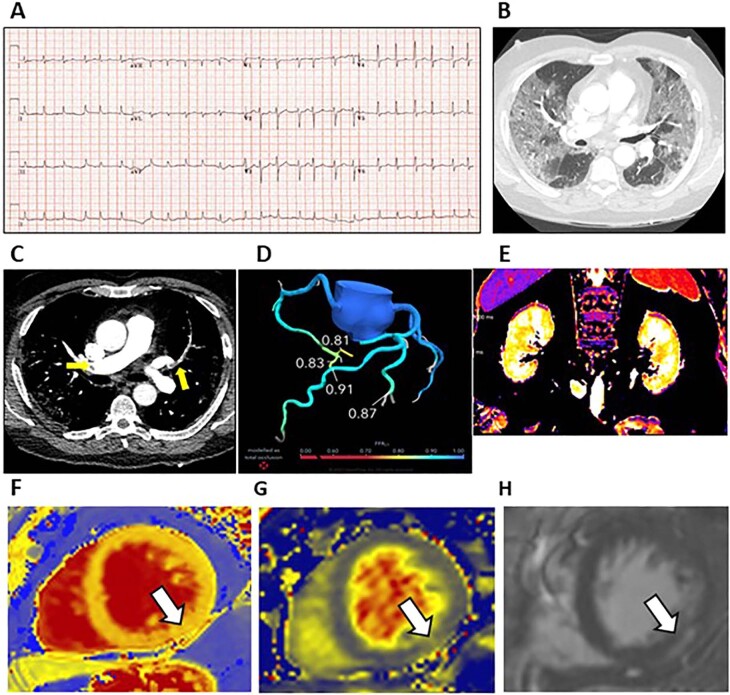
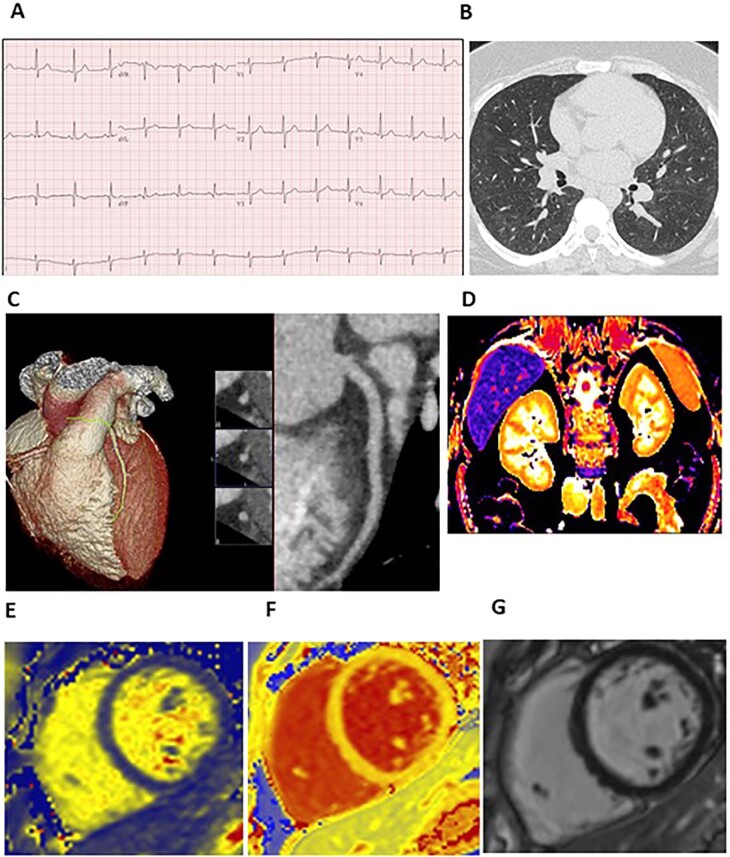
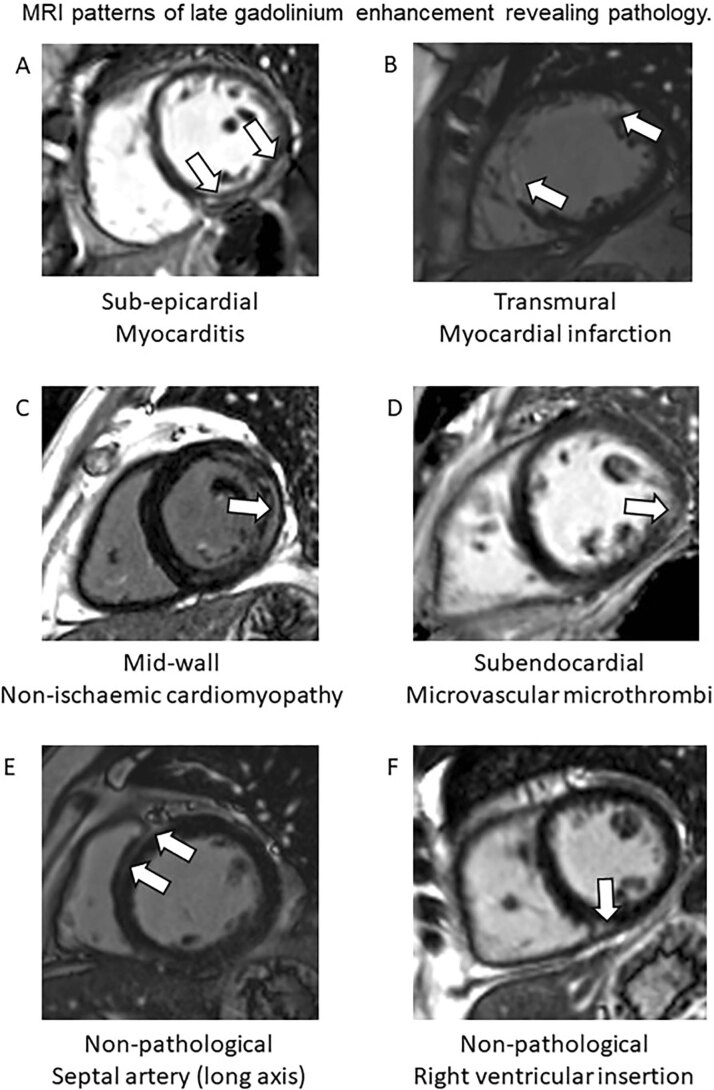
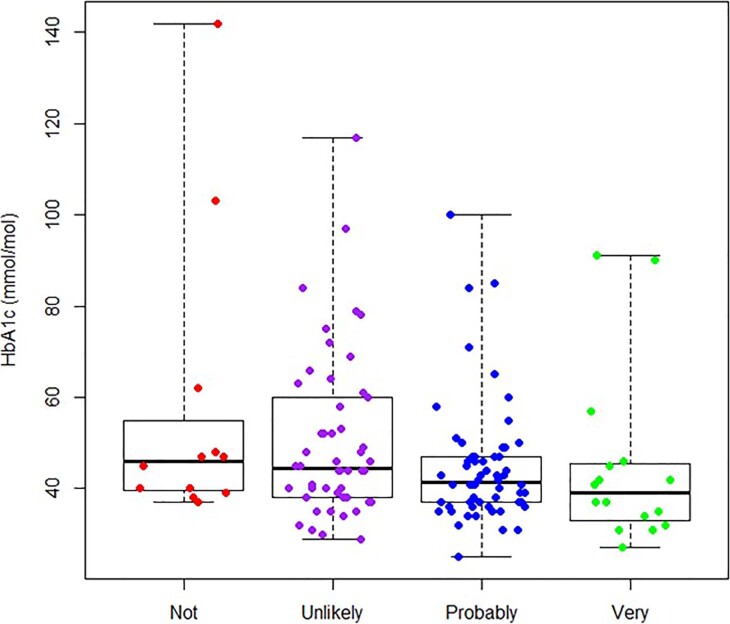
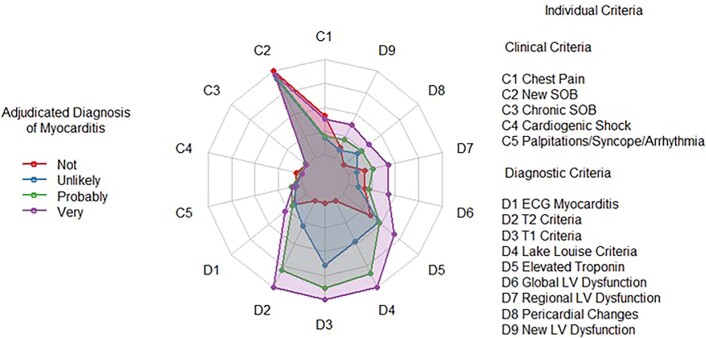
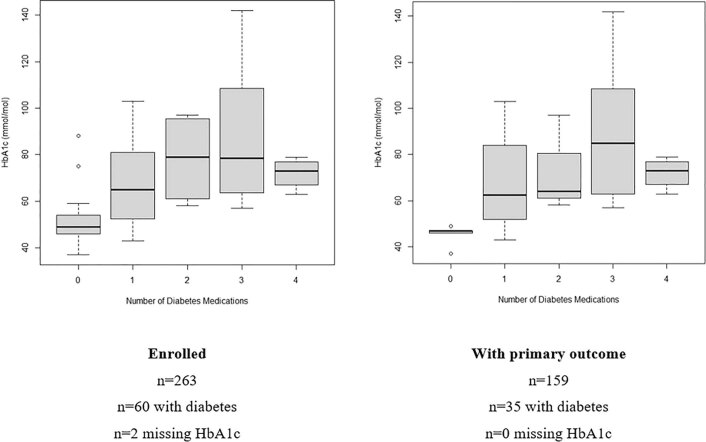
The pathophysiology and trajectory of post-Coronavirus Disease 2019 (COVID-19) syndrome is uncertain. To clarify multisystem involvement, we undertook a prospective cohort study including patients who had been hospitalized with COVID-19 (ClinicalTrials.gov ID NCT04403607 ). Serial blood biomarkers, digital electrocardiography and patient-reported outcome measures were obtained in-hospital and at 28-60 days post-discharge when multisystem imaging using chest computed tomography with pulmonary and coronary angiography and cardio-renal magnetic resonance imaging was also obtained. Longer-term clinical outcomes were assessed using electronic health records. Compared to controls (n = 29), at 28-60 days post-discharge, people with COVID-19 (n = 159; mean age, 55 years; 43% female) had persisting evidence of cardio-renal involvement and hemostasis pathway activation. The adjudicated likelihood of myocarditis was 'very likely' in 21 (13%) patients, 'probable' in 65 (41%) patients, 'unlikely' in 56 (35%) patients and 'not present' in 17 (11%) patients. At 28-60 days post-discharge, COVID-19 was associated with worse health-related quality of life (EQ-5D-5L score 0.77 (0.23) versus 0.87 (0.20)), anxiety and depression (PHQ-4 total score 3.59 (3.71) versus 1.28 (2.67)) and aerobic exercise capacity reflected by predicted maximal oxygen utilization (20.0 (7.6) versus 29.5 (8.0) ml/kg/min) (all P < 0.01). During follow-up (mean, 450 days), 24 (15%) patients and two (7%) controls died or were rehospitalized, and 108 (68%) patients and seven (26%) controls received outpatient secondary care (P = 0.017). The illness trajectory of patients after hospitalization with COVID-19 includes persisting multisystem abnormalities and health impairments that could lead to substantial demand on healthcare services in the future.


Conflict of interest statement

C.B. is employed by the University of Glasgow, which holds consultancy and research agreements with Abbott Vascular, AstraZeneca, Boehringer Ingelheim, Coroventis, GlaxoSmithKline, HeartFlow, Menarini, Novartis, Siemens Healthcare, Somalogic and Valo Health. These companies had no role in the design or conduct of the study or in the data collection, interpretation or reporting. HeartFlow derived FFRCT. None of the other authors has any relevant disclosures.

Figures

Fig. 1
Fig. 1. Flow diagram of the clinical study.
The procedures involved screening hospitalized patients with COVID-19 defined by a PCR-positive result for SARS-CoV-2 in a nasopharyngeal swab and then obtaining written informed consent. The analysis population is defined by a PCR-positive result. Serial investigations were initiated in-hospital or early post-discharge (visit 1) and then repeated in association with multi-organ imaging at 28–60 days post-discharge (visit 2). Clinical follow-up continued for on average 450 days ± 88 s.d. (range, 290–627 days) post-discharge.
Extended Data Fig. 1
Myopericarditis associated with acute COVID-19 infection. A 19-year-old man with no past medical history presented with chest pain and dyspnoea. He had tested PCR-positive for SARS-CoV-2 in the community one week earlier. He experienced central burning chest pain which radiated to his jaw and left arm. The symptom lasted approximately 90 minutes. A 12-lead electrocardiogram revealed saddle-shaped ST-elevation in the precordial leads (a) and the peak concentration of high sensitivity troponin-I was 4,738 ng/L. No further episodes of chest pain occurred. A transthoracic echocardiogram revealed preserved biventricular function. Research-indicated chest computed tomography (CT) and pulmonary and coronary angiography (b, c) and cardio-renal magnetic resonance imaging (MRI) (e, f, g) were acquired in line with the protocol 28 days after discharge from hospital. There was no evidence of pulmonary embolism or COVID-19 pneumonitis (B). In the inferior wall (white arrow), localized, mid-wall elevations in myocardial native T2 (E, 47 ms) and T1 (F, 1270 ms) indicative of acute myocardial inflammation co-localized with sub-epicardial late gadolinium enhancement indicative of scar tissue (g). On coronary CT angiography, there was no angiographic evidence of atherosclerosis and the FFRct values derived in the left anterior descending (0.94) and left circumflex (0.95) coronary arteries were normal (FFRCT > 0.80) (d). The cardiac diagnosis adjudicated by the clinical event committee was myocarditis secondary to COVID-19.
Extended Data Fig. 2
Myocardial injury in a patient treated in the Intensive Care Unit for COVID-19 pneumonitis and respiratory failure. A 58-year-old male healthcare worker was hospitalized with breathlessness, cough and pyrexia. There was no history of chest pain. Admission electrocardiogram (a) showed sinus tachycardia with premature atrial complexes and lateral ST-segment depression, and a peak troponin I concentration of 532 ng/L. The medical history included asthma and hypertension. A PCR test was positive for SARS-CoV-2. Due to respiratory distress and hypoxemia, the patient was intubated and admitted to the intensive care (ICU). A computed tomography (CT) pulmonary angiogram (8) revealed COVID pneumonitis and pulmonary thromboembolism was excluded. The ICU admission lasted one-month and the patient was discharged after a period of 52 days in hospital. The research CT scan revealed resolution of changes in the lung parenchyma (c). Coronary CT angiography revealed atherosclerosis in the left coronary artery (d) and FFRCT (e) excluded obstructive coronary artery disease. Protocol-directed cardio-renal magnetic resonance imaging (MRI) did not reveal features of myocardial inflammation. Specifically, the myocardial T2 (F, 41 ms) and T1 (G, 1218 ms) relaxation times were normal and there was no intra-myocardial late gadolinium enhancement other than at the right ventricular insertion point, which can be a normal finding (H). The adjudicated cardiac diagnosis was acute myocardial injury secondary to hypoxemia, not myocarditis.
Extended Data Fig. 3
COVID-19 infection associated with type 2 myocardial infarction and atrial fibrillation. A 68-year-old woman presented with breathlessness, a five-day febrile illness and falls due to weakness but without loss of consciousness. The admission electrocardiogram (a) revealed atrial fibrillation of presumed recent onset and a rapid ventricular rate and there were clinical signs of heart failure. Following admission, a swab PCR test for SARS-CoV-2 infection was positive. Protocol-directed coronary computed tomograph (CT) angiography revealed a dominant left coronary artery. The Agatston calcium score was 156 (815 percentile for age, gender, ethnicity) and there was atherosclerosis in the left coronary artery (c). The FFRCT ratios in the mid-left anterior descending (FFRCT = 0.71) and distal circumflex (FFRCT = 0.76) coronary arteries were reduced (abnormal < 0.80) (d). Parametric mapping revealed increases in myocardial T2 (47 ms) and T1 (1269 ms) relaxation times consistent with myocardial inflammation (e, f). Late gadolinium contrast-enhanced imaging was normal. There was bi-atrial enlargement and the left and right ventricular ejection fractions were preserved (g). The adjudicated diagnosis was acute myocardial injury and type 2 myocardial infarction in association with pre-existing coronary artery disease and acute COVID-19.
Extended Data Fig. 4
Myocarditis associated with acute COVID-19 infection. A 51-year-old woman with no relevant past medical history presented with chest pain and dyspnoea. She had tested PCR-positive for SARS-CoV-2 in the community 8 days previously. She experienced breathlessness, anosmia, fever, and central chest pain which radiated to her jaw. A 12-lead electrocardiogram revealed T wave flattening laterally (a) and the peak concentration of high sensitivity troponin-1 was 56 ng/L. No further episodes of chest pain occurred. Research-indicated computed tomography (CT) (b, c) and cardio-renal magnetic resonance imaging (MRI) (e, f, g) were acquired in line with the protocol 27 days after discharge from hospital. There was no evidence of pulmonary embolism or COVID-19 pneumonitis (B). On coronary CT angiography, there was no angiographic evidence of atherosclerosis and the FFRct values were normal (d). In the inferior wall of the left ventricle (white arrow), localized, mid-wall elevations in myocardial native T2 (E, 54 ms) and T1 (F, 1313 ms) relaxation times, indicative of acute myocardial inflammation, co-localized with sub epicardial myocardial late gadolinium enhancement (g). These imaging features are diagnostic of myocarditis. The cardiac diagnosis adjudicated by the clinical event committee was myocarditis secondary to COVID-19.
Extended Data Fig. 5
Persisting cardio-renal abnormalities due to COVID-19 infection. A 66-year-old man with history of hypertension was admitted with increasing breathlessness and transient syncope. There was no history of chest pain. The PCR test confirmed SARS-CoV-2 infection and the D-Dimer concentration was 35,656 ng/L. The admission electrocardiogram revealed atrial fibrillation with a rapid ventricular rate requiring electrocardioversion due to haemodynamic compromise (a). The computed tomography (CT) pulmonary angiogram revealed COVID-19 pneumonitis (b) and bilateral pulmonary arterial thrombus involving both central and peripheral branches (c). Treatment dose low molecular weight heparin was initially prescribed followed by directoral anticoagulation. Despite additional treatment with tocilizumab and dexamethasone for covid pneumonitis, intubation and mechanical ventilation were necessary during a 4-day admission to the intensive care unit (ICU). The patient recovered, supported by treatment with inhaled oxygen and a reducing dose of dexamethasone. At visit 2, one month later, the research coronary CT angiogram and FFRct excluded obstructive coronary artery disease (d). Protocoldirected MRI revealed tissue inflammation in the kidney (increased renal T1 (e, cortex 1666ms, medulla 2060 ms), and myocardium (native T1 (f, 1303 ms), and native T2 (g, 49 ms) associated with late gadolinium enhancement localized to the inferior left ventricular wall with a sub-epicardial distribution (h) in keeping with myocardial inflammation. The CT chest scan revealed substantially improvement in the lung parenchyma, and the previously identified pulmonary emboli were no longer evident.
Extended Data Fig. 6
COVID-19 without cardio-renal involvement: no abnormalities identified. A 25-year-old woman presented with breathlessness, lightheadedness and anosmia 9 days after a nasopharyngeal swab tested PCR-positive for SARS-COV-2 infection. The admission electrocardiogram (a) revealed normal sinus rhythm. She was treated with dexamethasone. Research-indicated chest computed tomography (CT) (b, c) and cardio-renal magnetic resonance imaging (MRI) (d, e, f, g) were acquired in line with the protocol 23 days after discharge from hospital. High resolution lung CT revealed faint peribronchovascular ground glass opacification in keeping with recovering pneumonitis. The coronary CT angiogram was normal (C). Renal MRI imaging revealed normal T1 values (D: cortex 1481 ms, medulla 1922ms). There was no evidence of raised T2 (E: 38 ms) or T1 (1218 ms) values on parametric mapping, and no myocardial late gadolinium enhancement. The cardiac diagnosis adjudicated by the dinical event committee was no evidence of myocardial injury.
Extended Data Fig. 7
Case examples of predefined patterns of myocardial late gadolinium enhancement. The white arrows indicate late gadolinium enhancement.
Extended Data Fig. 8
Glycated hemoglobin (HbA1c) (mmol/mol) (n = 136) during the index hospitalization in relation to the adjudicated likelihood of myocarditis (p = 0.10). The boxplot indicates the minimum and maximum values (whiskers), the sample median (middle value), and the first and third quartiles (25th and 75th percentiles, bounds of the box).
Extended Data Fig. 9
The radar plot illustrates the characteristics of patients in terms of the presence of each individual criterion, separately for those with each adjudicated likelihood of myocarditis. A point in the center of the plot (for example, criteria D2, D3, and D4, for those patients adjudicated as not having myocarditis) indicates that the criterion was absent for all patients in this group. A point on the outer rim of the plot indicates that the criterion was present for all patients in that subgroup. The only exception to this is for Lake Louise criteria (criterion D4), which was coded as 0, 1, or 2, depending on the number of criteria present, so a point on the outer rim indicates all patients in the subgroup had both Lake Louise criteria. The colored regions identify the associations between each likelihood classification and potential diagnostic criteria. The diagnostic test criteria discriminate well between ‘Very likely’ and ‘Probable’, whereas this is not the case for Clinical Criteria, which are very much less specific.
Extended Data Fig. 10
Glycated hemoglobin (HbA1c) (mmol/mol) during the index hospitalization in relation to the number of prescribed anti-diabetic medications. Anti-diabetic medications prescribed (n, patients): biguanide n = 36; sodium-glucose transport protein 2 (SGLT2) inhibitor n = 21; insulin n = 14; sulfonylurea n = 12; glucagon-like peptide-1 (GLP-1) receptor agonist n = 6; dipeptidyl peptidase-4 (DPP-4) inhibitors n = 6; thiazolidinedione n = 3. Boxplots show median, quartiles, and range of non-outlying data (outliers defined as those more than 1.5 times the interquartile range above the upper quartile or below the lower quartile). The boxplot indicates the minimum and maximum values (whiskers), the sample median (middle value), and the first and third quartiles (25th and 75th percentiles, bounds of the box).

References

    1. Carfì A, Bernabei R, Landi F, Gemelli Against COVID-10 Post-Acute Care Study Group. Persistent symptoms in patients after acute COVID-19. JAMA. 2020;324:603–605. doi: 10.1001/jama.2020.12603. - DOI - PMC - PubMed
    1. Mandal S, et al. ‘Long-COVID’: a cross-sectional study of persisting symptoms, biomarker and imaging abnormalities following hospitalisation for COVID-19. Thorax. 2021;76:396–398. doi: 10.1136/thoraxjnl-2020-215818. - DOI - PMC - PubMed
    1. Dennis A, et al. Multiorgan impairment in low-risk individuals with post-COVID-19 syndrome: a prospective, community-based study. BMJ Open. 2021;11:e048391. doi: 10.1136/bmjopen-2020-046311. - DOI - PMC - PubMed
    1. Cirulli, E. T. et al. Long-term COVID-19 symptoms in a large unselected population. Preprint at https://www.medrxiv.org/content/10.1101/2020.10.07.20208702v3 (2020). - DOI
    1. Office for National Statistics. Prevalence of ongoing symptoms following coronavirus (COVID-19) infection in the UK: 1 April 2021. https://www.ons.gov.uk/peoplepopulationandcommunity/healthandsocialcare/... (2021).

Publication types

Associated data