

Quantification of epicardial adipose tissue in obese patients using an open-bore MR scanner
- PMID: 35606555
- PMCID: PMC9127004
- DOI: 10.1186/s41747-022-00274-0
Quantification of epicardial adipose tissue in obese patients using an open-bore MR scanner
Abstract
Background: Our aim was to evaluate the reproducibility of epicardial adipose tissue (EAT) volume, measured on scans performed using an open-bore magnetic resonance scanner.
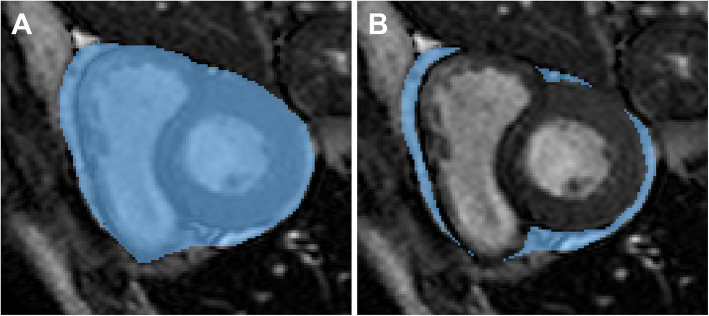
Methods: Consecutive patients referred for bariatric surgery, aged between 18 and 65 years who agreed to undergo cardiac imaging (MRI), were prospectively enrolled. All those with cardiac pathology or contraindications to MRI were excluded. MRI was performed on a 1.0-T open-bore scanner, and EAT was segmented on all scans at both systolic and diastolic phase by two independent readers (R1 with four years of experience and R2 with one year). Data were reported as median and interquartile range; agreement and differences were appraised with Bland-Altman analyses and Wilcoxon tests, respectively.
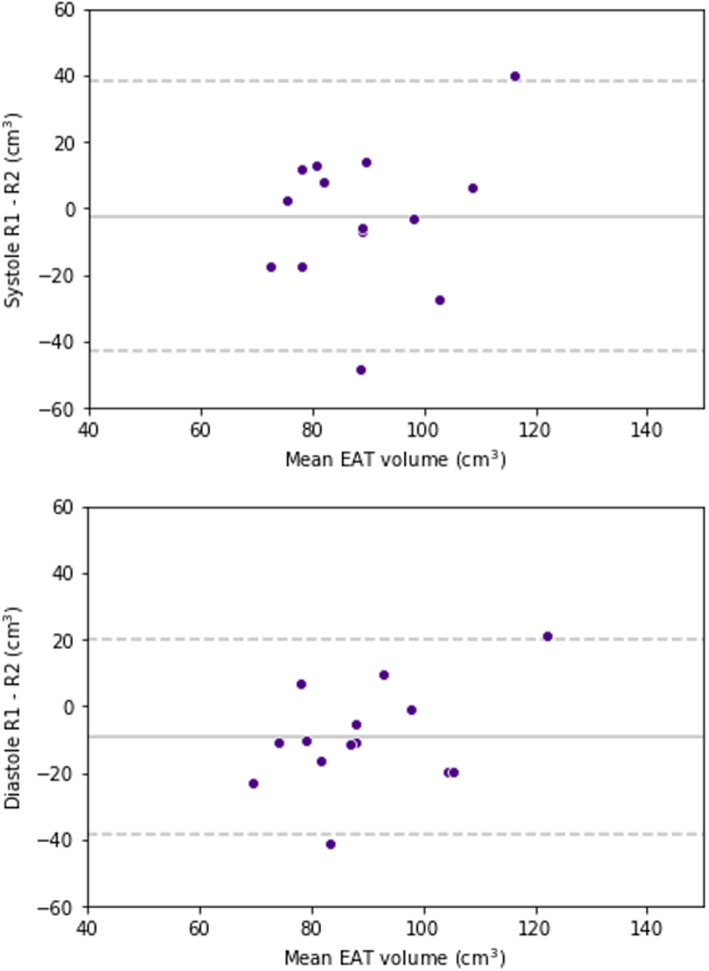
Results: Fourteen patients, 11 females (79%) aged 44 (41-50) years, underwent cardiac MRI. For the first and second readings, respectively, EAT volume was 86 (78-95) cm3 and 85 (79-91) cm3 at systole and 82 (74-95) cm3 and 81 (75-94) cm3 at diastole for R1, and 89 (79-99) cm3 and 93 (84-98) cm3 at systole and 92 (85-103) cm3 and 93 (82-94) cm3 at diastole for R2. R1 had the best reproducibility at diastole (bias 0.3 cm3, standard deviation of the differences (SD) 3.3 cm3). R2 had the worst reproducibility at diastole (bias 3.9 cm3, SD 12.1 cm3). The only significant difference between systole and diastole was at the first reading by R1 (p = 0.016). The greatest bias was that of inter-reader reproducibility at diastole (-9.4 cm3).
Conclusions: Reproducibility was within clinically acceptable limits in most instances.
Keywords: Adipose tissue; Bariatric surgery; Heart; Magnetic resonance imaging; Reproducibility of results.
© 2022. The Author(s) under exclusive licence to European Society of Radiology.
Conflict of interest statement
Prof. Francesco Sardanelli has received research grants from and has been a member of the speakers’ bureau and of the advisory group for General Electric, Bayer and Bracco; he is a member of the scientific advisory board of DeepTrace Technologies S.R.L.; in addition, he is the Editor-in-Chief of
Figures


References
-
- Sacks HS, Fain JN, Holman B, et al (2009) Uncoupling protein-1 and related messenger ribonucleic acids in human epicardial and other adipose tissues: Epicardial fat functioning as brown fat. J Clin Endocrinol Metab 94:3611–3615. 10.1210/jc.2009-0571 - PubMed