

Time trends in social contacts before and during the COVID-19 pandemic: the CONNECT study
- PMID: 35606703
- PMCID: PMC9125550
- DOI: 10.1186/s12889-022-13402-7
Time trends in social contacts before and during the COVID-19 pandemic: the CONNECT study
Abstract
Background: Since the beginning of the COVID-19 pandemic, many countries, including Canada, have adopted unprecedented physical distancing measures such as closure of schools and non-essential businesses, and restrictions on gatherings and household visits. We described time trends in social contacts for the pre-pandemic and pandemic periods in Quebec, Canada.
Methods: CONNECT is a population-based study of social contacts conducted shortly before (2018/2019) and during the COVID-19 pandemic (April 2020 - February 2021), using the same methodology for both periods. We recruited participants by random digit dialing and collected data by self-administered web-based questionnaires. Questionnaires documented socio-demographic characteristics and social contacts for two assigned days. A contact was defined as a two-way conversation at a distance ≤ 2 m or as a physical contact, irrespective of masking. We used weighted generalized linear models with a Poisson distribution and robust variance (taking possible overdispersion into account) to compare the mean number of social contacts over time and by socio-demographic characteristics.
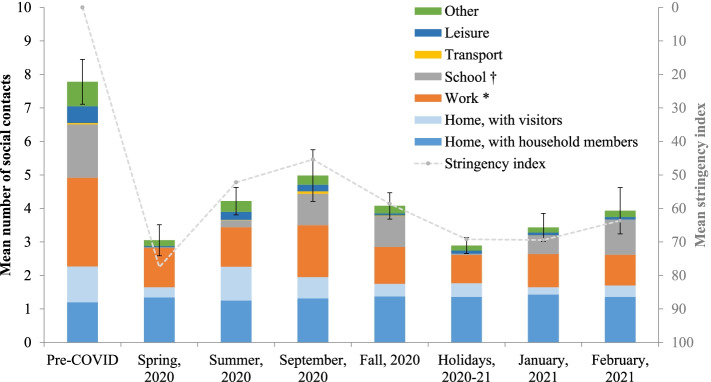
Results: A total of 1291 and 5516 Quebecers completed the study before and during the pandemic, respectively. Contacts significantly decreased from a mean of 8 contacts/day prior to the pandemic to 3 contacts/day during the spring 2020 lockdown. Contacts remained lower than the pre-COVID period thereafter (lowest = 3 contacts/day during the Christmas 2020/2021 holidays, highest = 5 in September 2020). Contacts at work, during leisure activities/in other locations, and at home with visitors showed the greatest decreases since the beginning of the pandemic. All sociodemographic subgroups showed significant decreases of contacts since the beginning of the pandemic. The mixing matrices illustrated the impact of public health measures (e.g. school closure, gathering restrictions) with fewer contacts between children/teenagers and fewer contacts outside of the three main diagonals of contacts between same-age partners/siblings and between children and their parents.
Conclusion: Physical distancing measures in Quebec significantly decreased social contacts, which most likely mitigated the spread of COVID-19.
Keywords: COVID-19; Infectious disease; Mathematical modeling; Public health; Social contacts; Social distancing measures.
© 2022. The Author(s).
Conflict of interest statement
The authors declare that they have no competing interests.
Figures


References
-
- Government of Canada: Coronavirus disease (COVID-19): Outbreak update. Available at https://www.canada.ca/en/public-health/services/diseases/2019-novel-coro.... Accessed September 3 2021. 2021.
-
- Institut national de santé publique du Québec: Ligne du temps COVID-19 au Québec. Available at https://www.inspq.qc.ca/covid-19/donnees/ligne-du-temps. Accessed September 20, 2021. 2021.
-
- Backer JA, Mollema L, Vos ER, Klinkenberg D, van der Klis FR, de Melker HE, van den Hof S, Wallinga J. Impact of physical distancing measures against COVID-19 on contacts and mixing patterns: repeated cross-sectional surveys, the Netherlands, 2016–17, April 2020 and June 2020. Euro Surveill. 2021;26(8):2000994. doi: 10.2807/1560-7917.ES.2021.26.8.2000994. - DOI - PMC - PubMed
-
- Available at http://surveysampler.com/samples/rdd-samples/. Accessed September 2021
Publication types
MeSH terms
Grants and funding
LinkOut - more resources
Full Text Sources
Medical
Miscellaneous
