

Transcriptome analysis reveals fluid shear stress (FSS) and atherosclerosis pathway as a candidate molecular mechanism of short-term low salinity stress tolerance in abalone
- PMID: 35606721
- PMCID: PMC9128277
- DOI: 10.1186/s12864-022-08611-8
Transcriptome analysis reveals fluid shear stress (FSS) and atherosclerosis pathway as a candidate molecular mechanism of short-term low salinity stress tolerance in abalone
Abstract
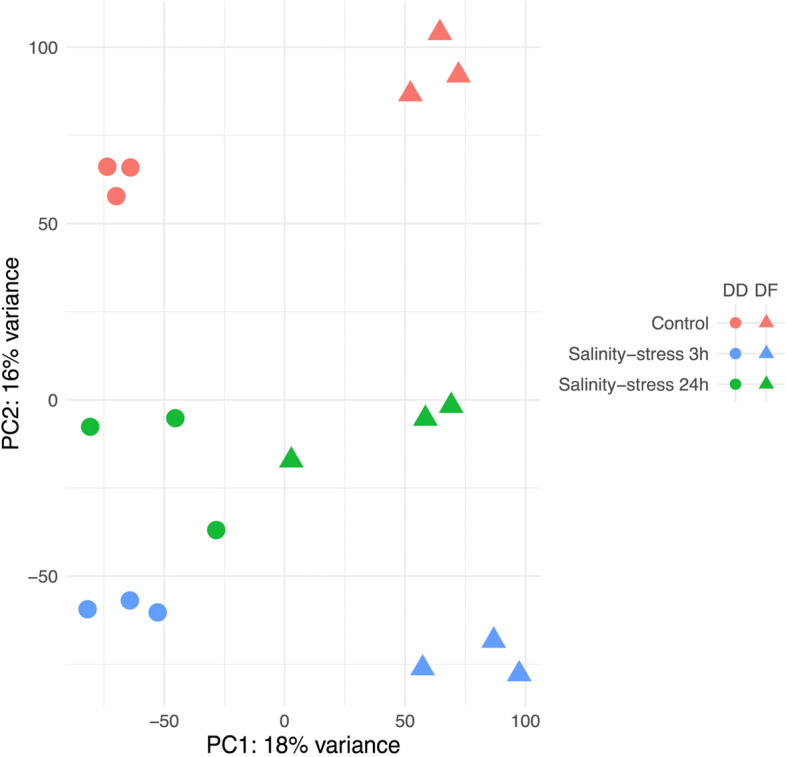
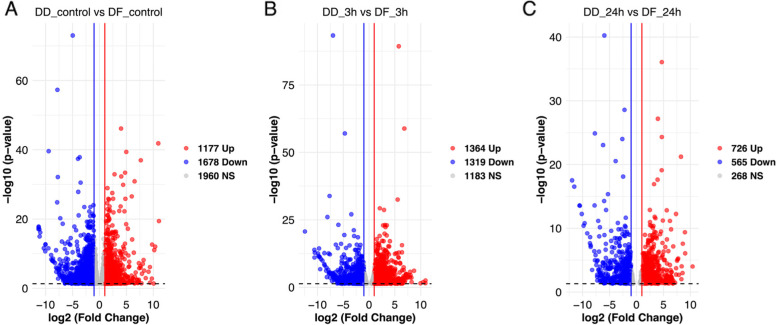
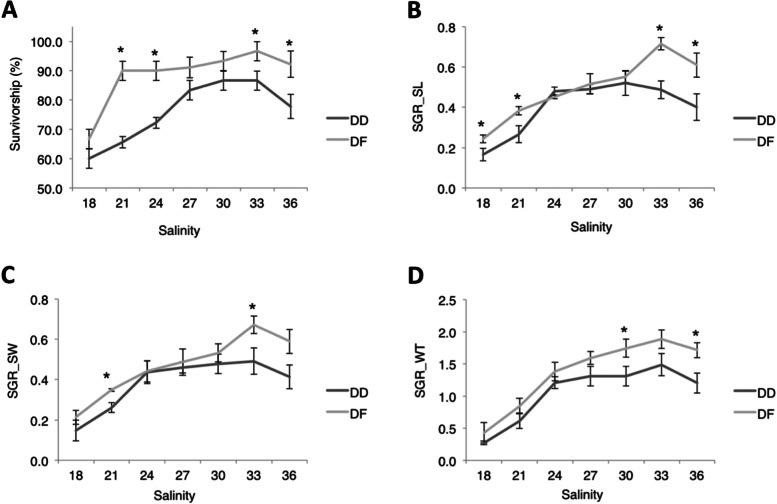
Background: Transcriptome sequencing is an effective tool to reveal the essential genes and pathways underlying countless biotic and abiotic stress adaptation mechanisms. Although severely challenged by diverse environmental conditions, the Pacific abalone Haliotis discus hannai remains a high-value aquaculture mollusk and a Chinese predominantly cultured abalone species. Salinity is one of such environmental factors whose fluctuation could significantly affect the abalone's cellular and molecular immune responses and result in high mortality and reduced growth rate during prolonged exposure. Meanwhile, hybrids have shown superiority in tolerating diverse environmental stresses over their purebred counterparts and have gained admiration in the Chinese abalone aquaculture industry. The objective of this study was to investigate the molecular and cellular mechanisms of low salinity adaptation in abalone. Therefore, this study used transcriptome analysis of the gill tissues and flow cytometric analysis of hemolymph of H. discus hannai (DD) and interspecific hybrid H. discus hannai ♀ x H. fulgens ♂ (DF) during low salinity exposure. Also, the survival and growth rate of the species under various salinities were assessed.
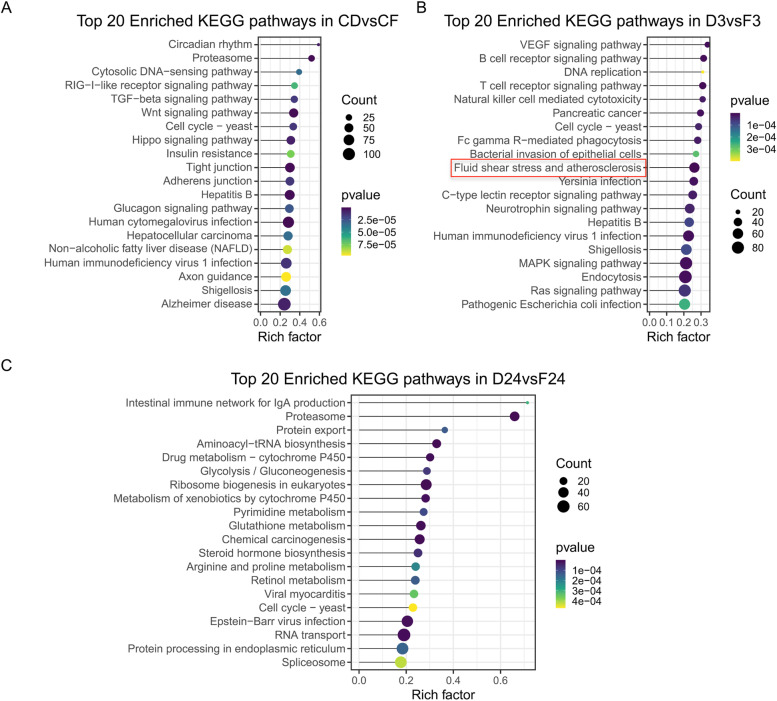
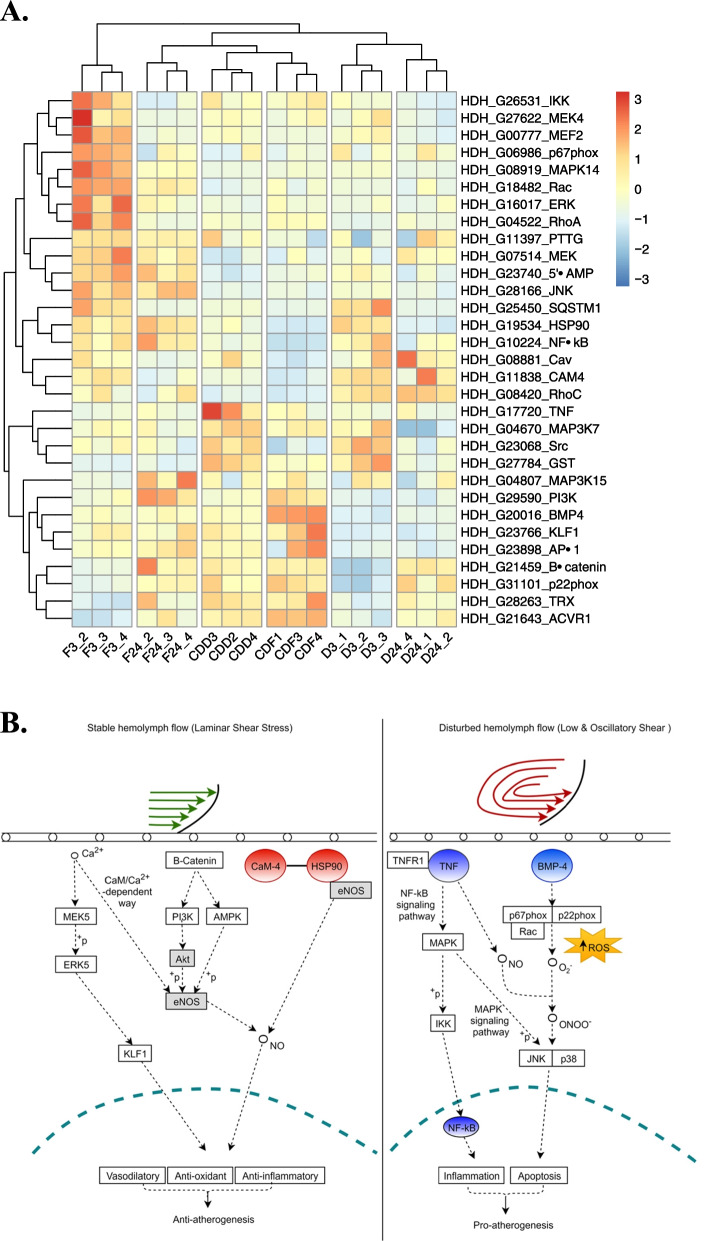
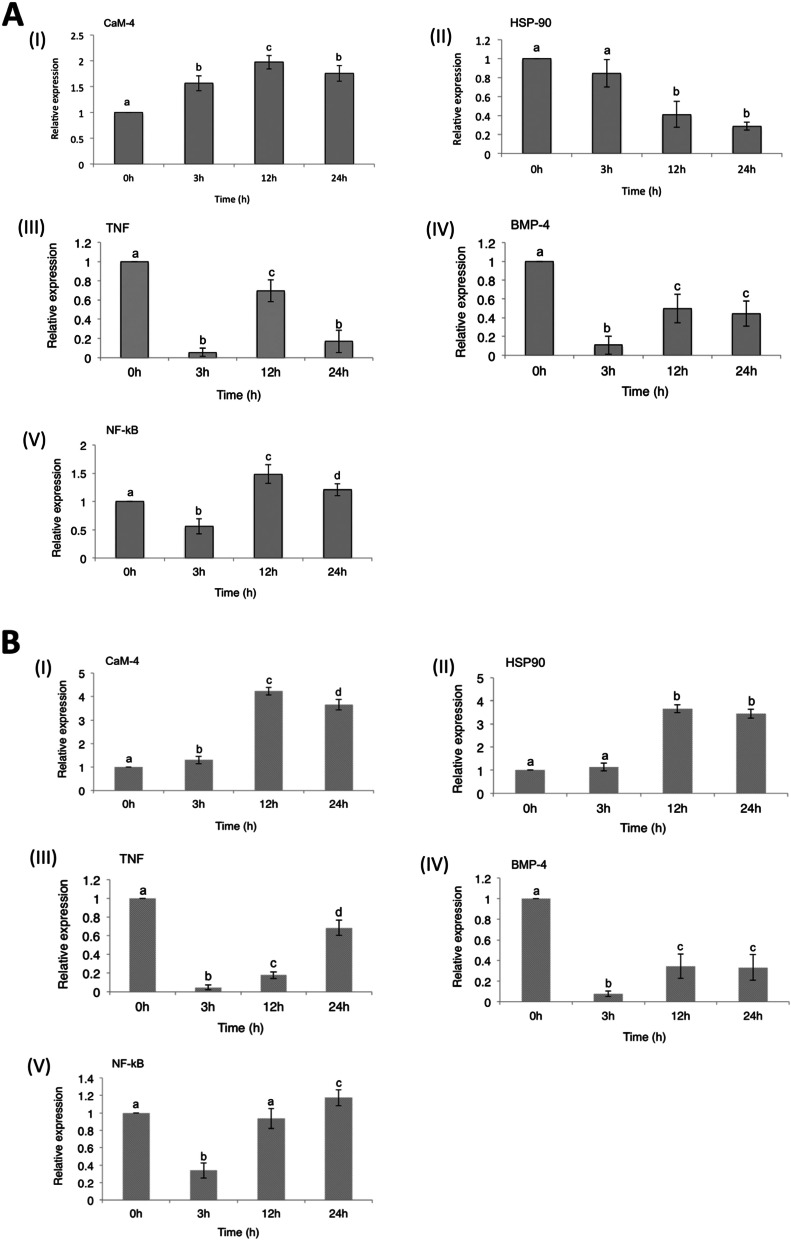
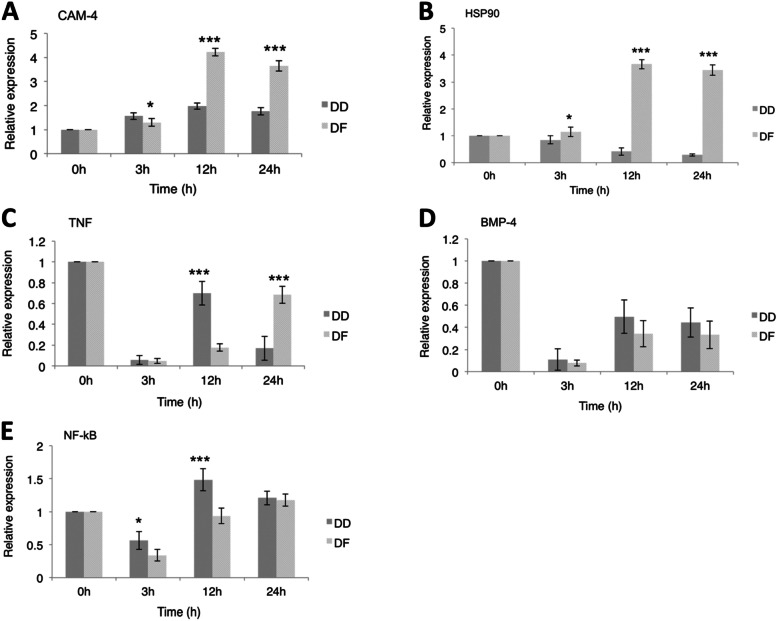
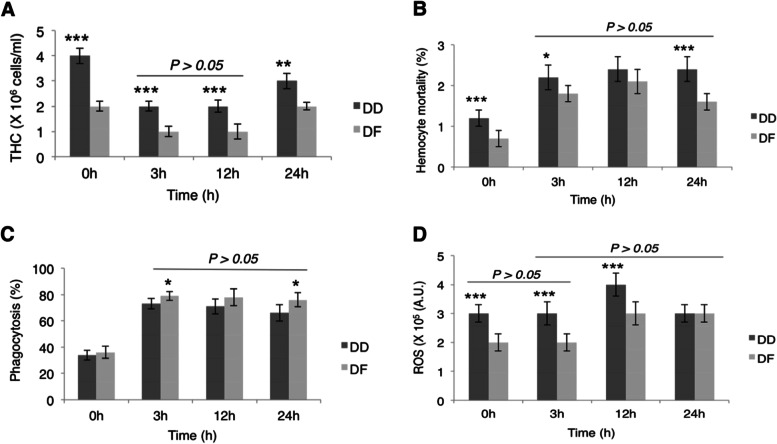
Results: The transcriptome data revealed that the differentially expressed genes (DEGs) were significantly enriched on the fluid shear stress and atherosclerosis (FSS) pathway. Meanwhile, the expression profiles of some essential genes involved in this pathway suggest that abalone significantly up-regulated calmodulin-4 (CaM-4) and heat-shock protein90 (HSP90), and significantly down-regulated tumor necrosis factor (TNF), bone morphogenetic protein-4 (BMP-4), and nuclear factor kappa B (NF-kB). Also, the hybrid DF showed significantly higher and sustained expression of CaM and HSP90, significantly higher phagocytosis, significantly lower hemocyte mortality, and significantly higher survival at low salinity, suggesting a more active molecular and hemocyte-mediated immune response and a more efficient capacity to tolerate low salinity than DD.
Conclusions: Our study argues that the abalone CaM gene might be necessary to maintain ion equilibrium while HSP90 can offset the adverse changes caused by low salinity, thereby preventing damage to gill epithelial cells (ECs). The data reveal a potential molecular mechanism by which abalone responds to low salinity and confirms that hybridization could be a method for breeding more stress-resilient aquatic species.
Keywords: Abalone; FSS pathway; Immunity; Interspecific hybrid; Low salinity; Transcriptomics.
© 2022. The Author(s).
Conflict of interest statement
We declare that we have no financial and personal relationships with other people or organizations that can inappropriately influence our work. There is no professional or other personal interest of any nature or kind in any product, service, or company that could be construed as influencing the position presented in, or the review of, the manuscript entitled, “TRANSCRIPTOME ANALYSIS REVEALS FLUID SHEAR STRESS (FSS) AND ATHEROSCLEROSIS PATHWAY AS A CANDIDATE MOLECULAR MECHANISM OF SHORT-TERM LOW SALINITY STRESS TOLERANCE IN ABALONE”.
Figures
Similar articles
-
Hemolymph and transcriptome analysis to understand innate immune responses to hypoxia in Pacific abalone.Comp Biochem Physiol Part D Genomics Proteomics. 2019 Jun;30:102-112. doi: 10.1016/j.cbd.2019.02.001. Epub 2019 Feb 6. Comp Biochem Physiol Part D Genomics Proteomics. 2019. PMID: 30822665
-
Preliminary analysis of pathways and their implications during salinity stress in abalone.Comp Biochem Physiol Part D Genomics Proteomics. 2024 Jun;50:101224. doi: 10.1016/j.cbd.2024.101224. Epub 2024 Feb 28. Comp Biochem Physiol Part D Genomics Proteomics. 2024. PMID: 38430709
-
Transcriptome analysis reveals the molecular mechanisms of heterosis on thermal resistance in hybrid abalone.BMC Genomics. 2021 Sep 8;22(1):650. doi: 10.1186/s12864-021-07954-y. BMC Genomics. 2021. PMID: 34496767 Free PMC article.
-
Genome-wide identification and expression profiling of the Wnt gene family in three abalone species.Genes Genomics. 2024 Dec;46(12):1363-1374. doi: 10.1007/s13258-024-01579-7. Epub 2024 Oct 14. Genes Genomics. 2024. PMID: 39397130 Review.
-
Genetic features of Haliotis discus hannai by infection of vibrio and virus.Genes Genomics. 2020 Feb;42(2):117-125. doi: 10.1007/s13258-019-00892-w. Epub 2019 Nov 27. Genes Genomics. 2020. PMID: 31776802 Review.
Cited by
-
Investigating the Mechanism of Low-Salinity Environmental Adaptation in Sepia esculenta Larvae through Transcriptome Profiling.Animals (Basel). 2023 Oct 8;13(19):3139. doi: 10.3390/ani13193139. Animals (Basel). 2023. PMID: 37835745 Free PMC article.
-
Pathological and miRNA-mRNA Analyses Provide New Insights into the Immune Response of Clams to Vibrio Infection.Mar Biotechnol (NY). 2025 Apr 23;27(3):76. doi: 10.1007/s10126-025-10454-9. Mar Biotechnol (NY). 2025. PMID: 40266414
-
Genome-wide investigation of the TGF-β superfamily in scallops.BMC Genomics. 2024 Jan 2;25(1):24. doi: 10.1186/s12864-023-09942-w. BMC Genomics. 2024. PMID: 38166626 Free PMC article.
-
High Hcy regulates fluid shear stress pathway activity through histone H3K79 homocysteinylation in hyperhomocysteinemia-related child hypertension.J Transl Med. 2025 May 9;23(1):525. doi: 10.1186/s12967-025-06483-6. J Transl Med. 2025. PMID: 40346632 Free PMC article.
References
-
- Morash AJ, Alter K. Effects of environmental and farm stress on abalone physiology: perspectives for abalone aquaculture in the face of global climate change. Rev Aquac. 2016;8(4):342–368. doi: 10.1111/raq.12097. - DOI
-
- Cook PA. Recent trends in worldwide abalone production. J Shellfish Res. 2016;5(3):581–583. doi: 10.2983/035.035.0302. - DOI
-
- Creencia LA, Noro T. Effects of salinity on the growth and mucous cells of the abalone Haliotis diversicolor Reeve, 1846. Int Aquat Res. 2018;10:179–189. doi: 10.1007/s40071-018-0199-0. - DOI
-
- Manuel AV, Tu PTC, Tsutsui N, Yoshimatsu T. Effect of salinity change and exposure time on egg stages of two abalone species Haliotis discus discus and H. gigantean. Fish Sci. 2020;86(1):27–33. doi: 10.1007/s12562-019-01366-4. - DOI
-
- Lim HK, Jeong MH, Min BH, Kim SH, Park CJ. Survival rate and oxygen consumption patterns with respect to salinity changes in juvenile abalone Haliotis discus hannai. Anim Cells Syst. 2014;18(6):380–386. doi: 10.1080/19768354.2014.978370. - DOI
MeSH terms
Grants and funding
- 2018SOA015946/Chinese Government Marine Scholarship
- 31872564/National Natural Science Foundation of China
- 31872564/National Natural Science Foundation of China
- 31872564/National Natural Science Foundation of China
- 31872564/National Natural Science Foundation of China
- 31872564/National Natural Science Foundation of China
- 31872564/National Natural Science Foundation of China
- 31872564/National Natural Science Foundation of China
- 31872564/National Natural Science Foundation of China
- 2018YFD0901401/National Key Research and Development Program of China
- 2018YFD0901401/National Key Research and Development Program of China
- 2018YFD0901401/National Key Research and Development Program of China
- 2018YFD0901401/National Key Research and Development Program of China
- 2018YFD0901401/National Key Research and Development Program of China
- 2018YFD0901401/National Key Research and Development Program of China
- 2018YFD0901401/National Key Research and Development Program of China
- 2018YFD0901401/National Key Research and Development Program of China
- 2019N0001 and 2020NZ08003/Fujian Provincial Science and Technology Project
- 2019N0001 and 2020NZ08003/Fujian Provincial Science and Technology Project
- 2019N0001 and 2020NZ08003/Fujian Provincial Science and Technology Project
- 2019N0001 and 2020NZ08003/Fujian Provincial Science and Technology Project
- 2019N0001 and 2020NZ08003/Fujian Provincial Science and Technology Project
- 2019N0001 and 2020NZ08003/Fujian Provincial Science and Technology Project
- 2019N0001 and 2020NZ08003/Fujian Provincial Science and Technology Project
- 2019N0001 and 2020NZ08003/Fujian Provincial Science and Technology Project
LinkOut - more resources
Full Text Sources
Medical
Miscellaneous
