

Transcriptomic analyses of NeuroD1-mediated astrocyte-to-neuron conversion
- PMID: 35606902
- PMCID: PMC9540770
- DOI: 10.1002/dneu.22882
Transcriptomic analyses of NeuroD1-mediated astrocyte-to-neuron conversion
Abstract
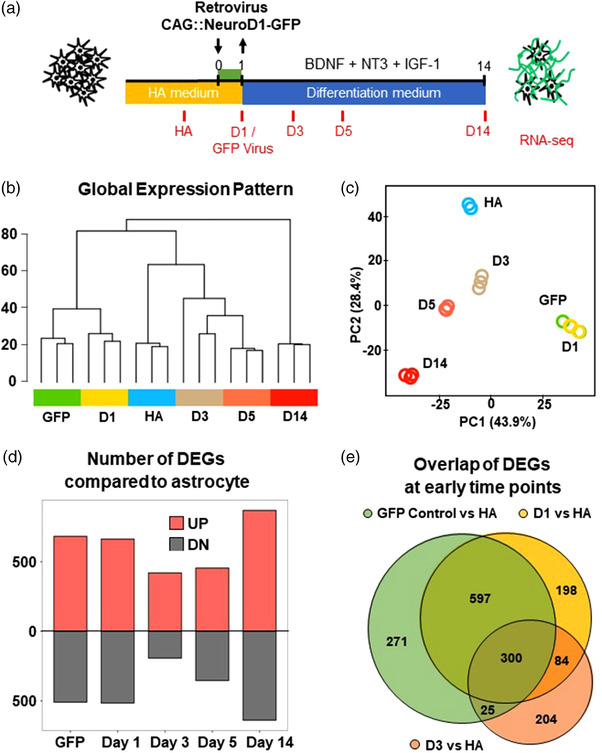
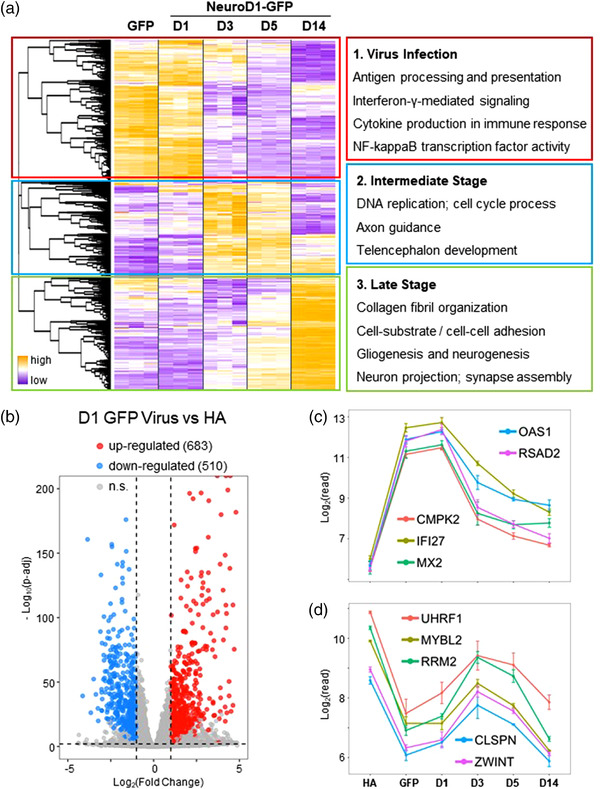
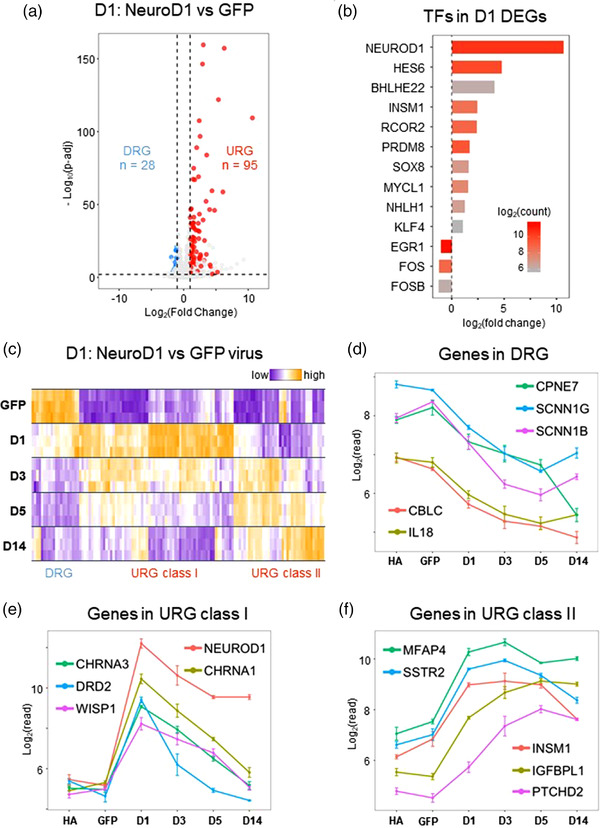
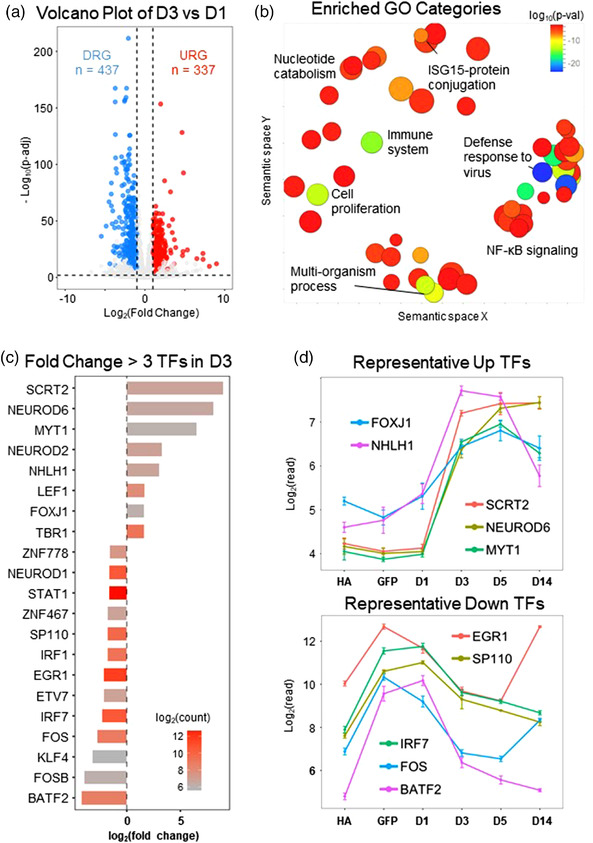
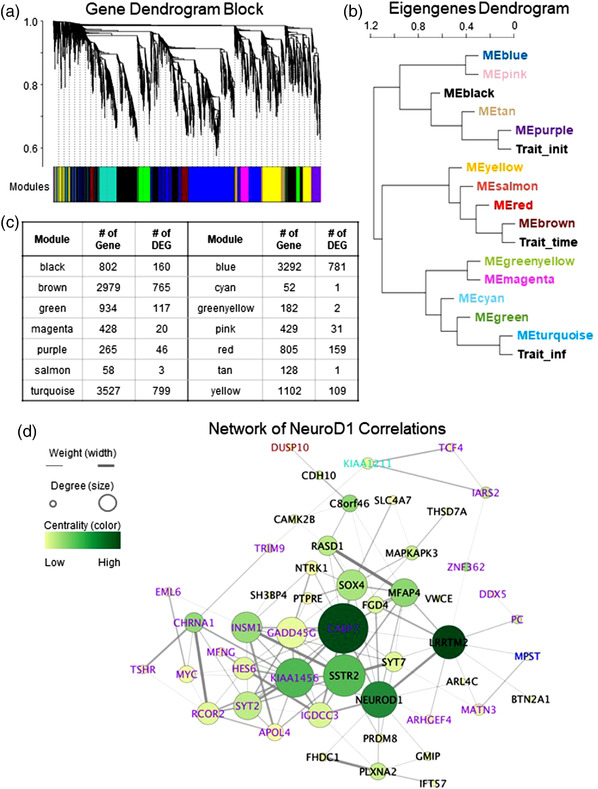
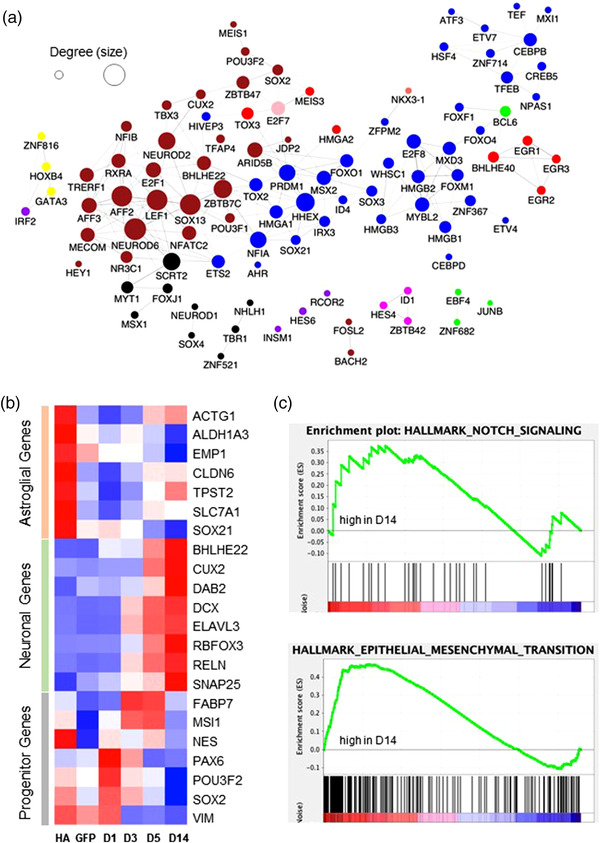
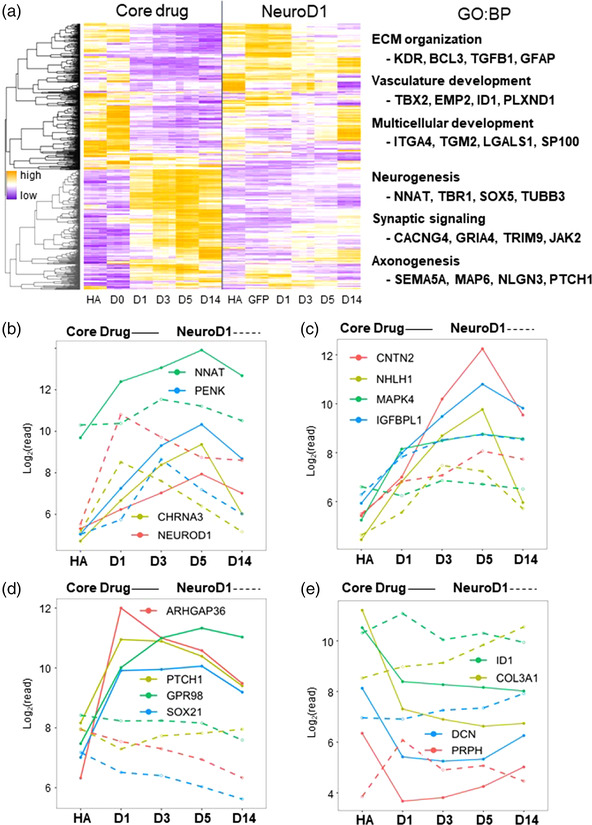
Ectopic expression of a single neural transcription factor NeuroD1 can reprogram reactive glial cells into functional neurons both in vitro and in vivo, but the underlying mechanisms are not well understood yet. Here, we used RNA-sequencing technology to capture the transcriptomic changes at different time points during the reprogramming process. We found that following NeuroD1 overexpression, astroglial genes (ACTG1, ALDH1A3, EMP1, CLDN6, SOX21) were significantly downregulated, whereas neuronal genes (DCX, RBFOX3/NeuN, CUX2, RELN, SNAP25) were significantly upregulated. NeuroD family members (NeuroD1/2/6) and signaling pathways (Wnt, MAPK, cAMP) as well as neurotransmitter receptors (acetylcholine, somatostatin, dopamine) were also significantly upregulated. Gene co-expression analysis identified many central genes among the NeuroD1-interacting network, including CABP7, KIAA1456, SSTR2, GADD45G, LRRTM2, and INSM1. Compared to chemical conversion, we found that NeuroD1 acted as a strong driving force and triggered fast transcriptomic changes during astrocyte-to-neuron conversion process. Together, this study reveals many important downstream targets of NeuroD1 such as HES6, BHLHE22, INSM1, CHRNA1/3, CABP7, and SSTR2, which may play critical roles during the transcriptomic landscape shift from a glial profile to a neuronal profile.
Keywords: NeuroD1; RNA-sequencing; astrocyte; neuronal conversion; reprogramming; transcriptome.
© 2022 The Authors. Developmental Neurobiology published by Wiley Periodicals LLC.
Conflict of interest statement
G.C. is a co‐founder of NeuExcell Therapeutics Inc. The other authors declare no conflict of interest.
Figures
Similar articles
-
A NeuroD1 AAV-Based Gene Therapy for Functional Brain Repair after Ischemic Injury through In Vivo Astrocyte-to-Neuron Conversion.Mol Ther. 2020 Jan 8;28(1):217-234. doi: 10.1016/j.ymthe.2019.09.003. Epub 2019 Sep 6. Mol Ther. 2020. PMID: 31551137 Free PMC article.
-
Expression level of the reprogramming factor NeuroD1 is critical for neuronal conversion efficiency from different cell types.Sci Rep. 2022 Oct 26;12(1):17980. doi: 10.1038/s41598-022-22802-z. Sci Rep. 2022. PMID: 36289433 Free PMC article.
-
Identification of the core regulatory program driving NEUROD1-induced neuronal reprogramming.Cell Rep. 2025 Apr 22;44(4):115523. doi: 10.1016/j.celrep.2025.115523. Epub 2025 Apr 1. Cell Rep. 2025. PMID: 40173039
-
Glial-Neuron Transformation by "Chemical Cocktail".ACS Chem Neurosci. 2019 Jan 16;10(1):42-43. doi: 10.1021/acschemneuro.8b00684. Epub 2018 Dec 20. ACS Chem Neurosci. 2019. PMID: 30571085 Review.
-
Development in the Mammalian Auditory System Depends on Transcription Factors.Int J Mol Sci. 2021 Apr 18;22(8):4189. doi: 10.3390/ijms22084189. Int J Mol Sci. 2021. PMID: 33919542 Free PMC article. Review.
Cited by
-
Somatic Cell Reprogramming for Nervous System Diseases: Techniques, Mechanisms, Potential Applications, and Challenges.Brain Sci. 2023 Mar 22;13(3):524. doi: 10.3390/brainsci13030524. Brain Sci. 2023. PMID: 36979334 Free PMC article. Review.
-
Compressed primary-to-transmodal gradient is accompanied with subcortical alterations and linked to neurotransmitters and cellular signatures in major depressive disorder.Hum Brain Mapp. 2023 Dec 1;44(17):5919-5935. doi: 10.1002/hbm.26485. Epub 2023 Sep 9. Hum Brain Mapp. 2023. PMID: 37688552 Free PMC article.
-
Multi-omic profiling of the developing human cerebral cortex at the single-cell level.Sci Adv. 2023 Oct 13;9(41):eadg3754. doi: 10.1126/sciadv.adg3754. Epub 2023 Oct 12. Sci Adv. 2023. PMID: 37824614 Free PMC article.
-
Sponge bHLH Gene Expression in Xenopus laevis Disrupts Inner Ear and Lateral Line Neurosensory Development and Otic Afferent Pathfinding.Int J Mol Sci. 2025 Jun 7;26(12):5487. doi: 10.3390/ijms26125487. Int J Mol Sci. 2025. PMID: 40564948 Free PMC article.
-
Characteristic changes in astrocyte properties during astrocyte-to-neuron conversion induced by NeuroD1/Ascl1/Dlx2.Neural Regen Res. 2025 Jun 1;20(6):1801-1815. doi: 10.4103/NRR.NRR-D-23-01897. Epub 2024 May 13. Neural Regen Res. 2025. PMID: 39104117 Free PMC article.
References
-
- Barker, R. A. , Gotz, M. , & Parmar, M. (2018). New approaches for brain repair‐from rescue to reprogramming. Nature, 557, 329–334. - PubMed
-
- Borromeo, M. D. , Savage, T. K. , Kollipara, R. K. , He, M. , Augustyn, A. , Osborne, J. K. , Girard, L. , Minna, J. D. , Gazdar, A. F. , Cobb, M. H. , & Johnson, J. E. (2016). ASCL1 and NEUROD1 reveal heterogeneity in pulmonary neuroendocrine tumors and regulate distinct genetic programs. Cell Reports, 16, 1259–1272. 10.1016/j.celrep.2016.06.081 - DOI - PMC - PubMed
-
- Buscail, L. , Esteve, J. P. , Saint‐Laurent, N. , Bertrand, V. , Reisine, T. , O'Carroll, A. M. , Bell, G. I. , Schally, A. V. , Vaysse, N. , & Susini, C. (1995). Inhibition of cell proliferation by the somatostatin analogue RC‐160 is mediated by somatostatin receptor subtypes SSTR2 and SSTR5 through different mechanisms. Proceedings of the National Academy of Sciences of the United States of America, 92, 1580–1584. - PMC - PubMed
-
- Caudell, E. G. , Caudell, J. J. , Tang, C. H. , Yu, T. K. , Frederick, M. J. , & Grimm, E. A. (2000). Characterization of human copine III as a phosphoprotein with associated kinase activity. Biochemistry, 39, 13034–13043. - PubMed
Publication types
MeSH terms
Substances
LinkOut - more resources
Full Text Sources
Medical
