

Essential Regression: A generalizable framework for inferring causal latent factors from multi-omic datasets
- PMID: 35607614
- PMCID: PMC9122954
- DOI: 10.1016/j.patter.2022.100473
Essential Regression: A generalizable framework for inferring causal latent factors from multi-omic datasets
Abstract
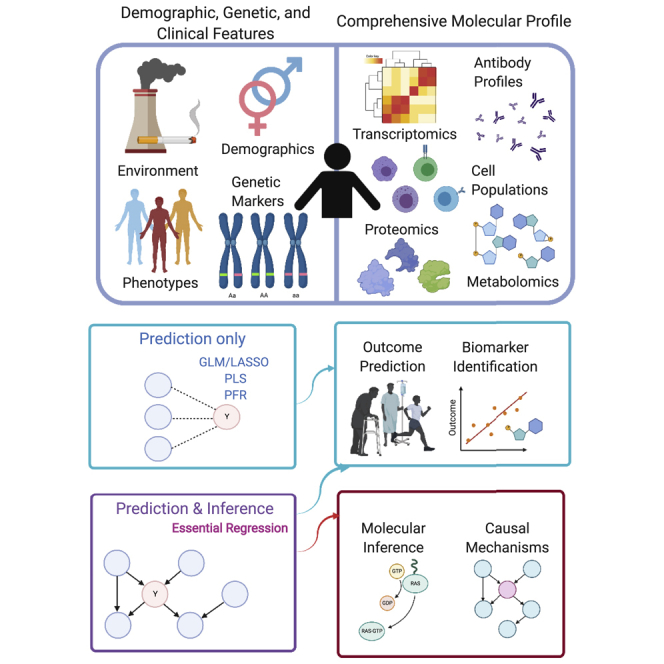
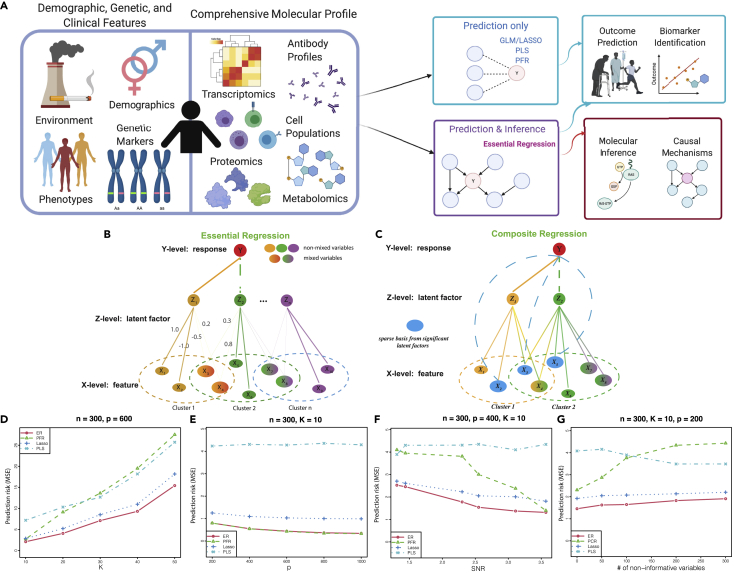
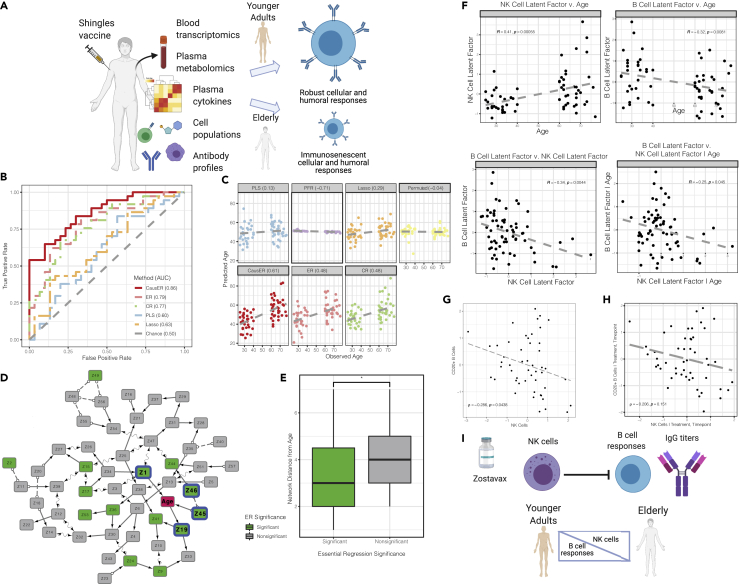
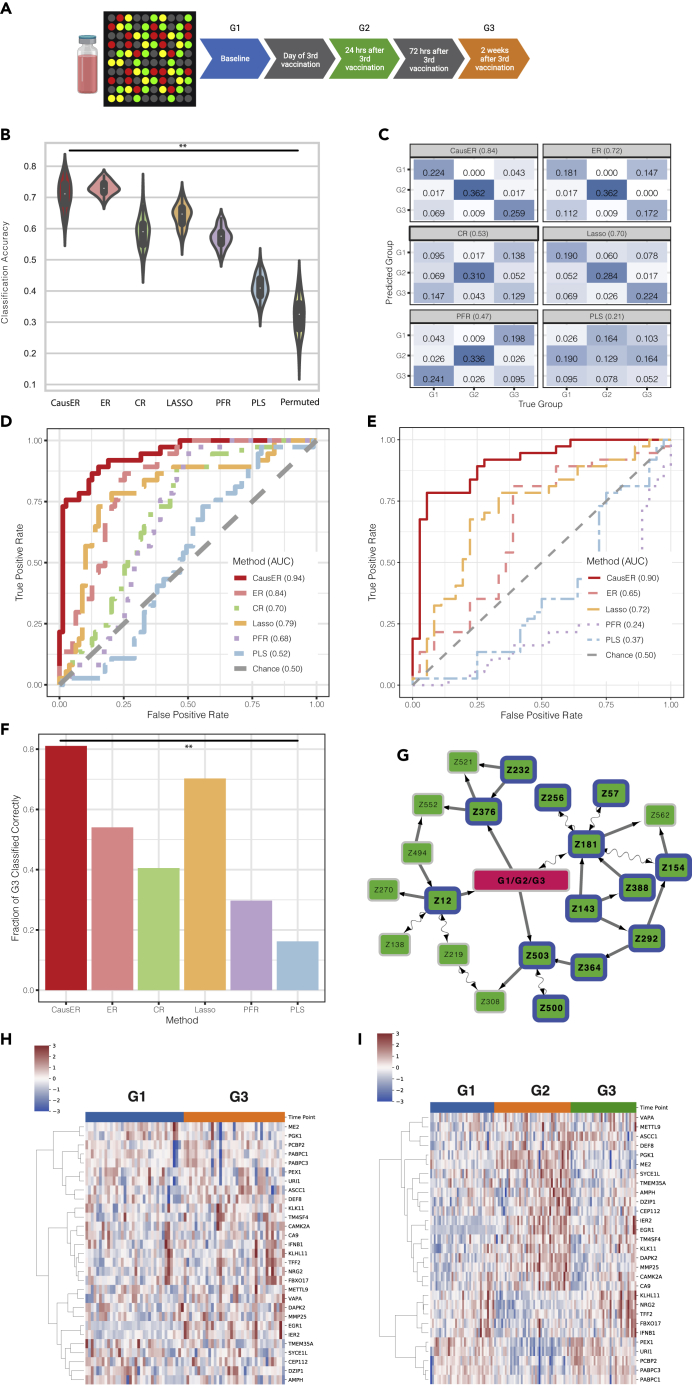
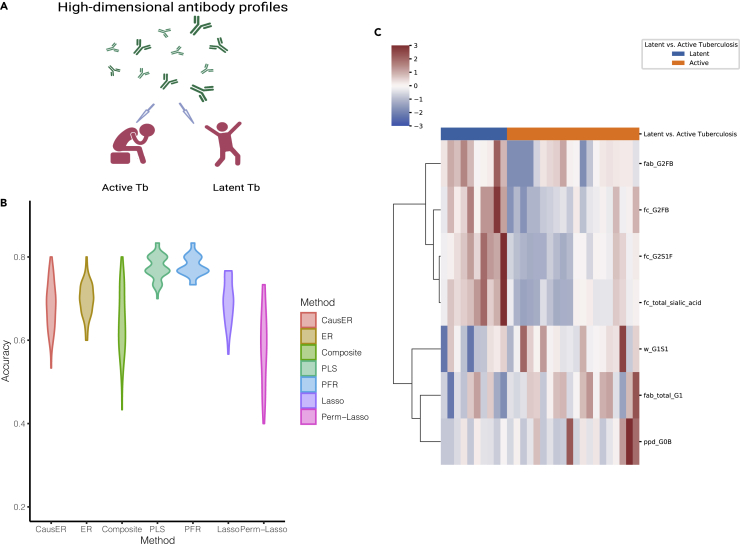
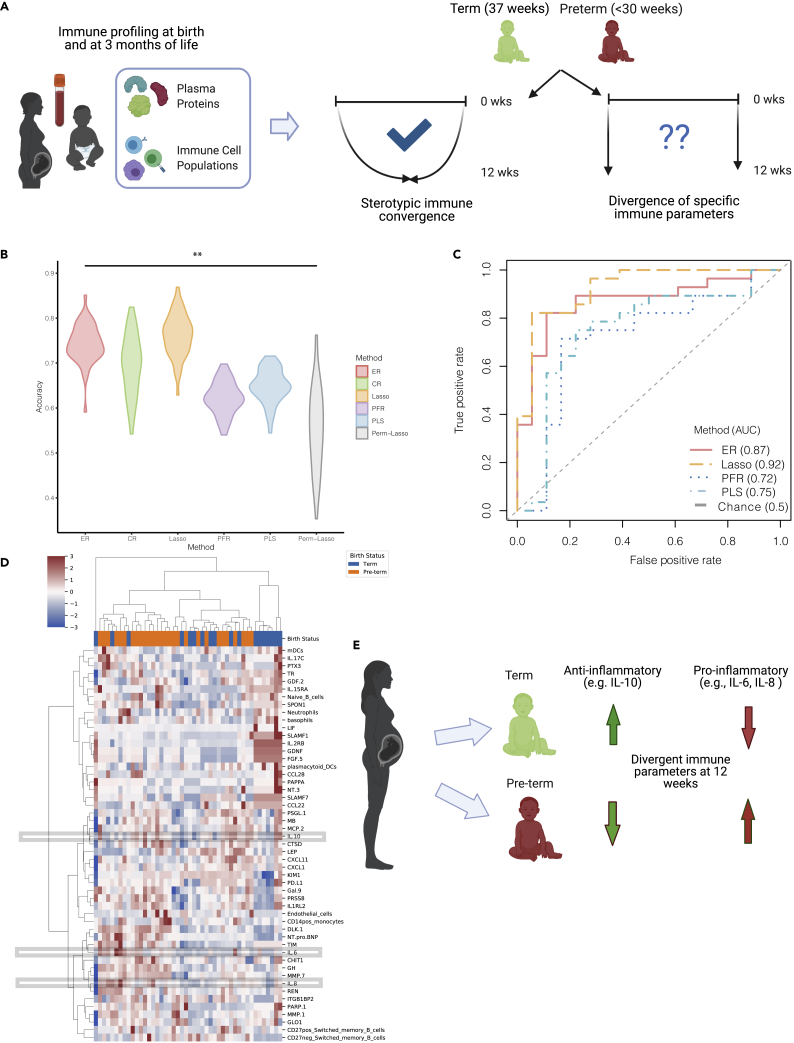
High-dimensional cellular and molecular profiling of biological samples highlights the need for analytical approaches that can integrate multi-omic datasets to generate prioritized causal inferences. Current methods are limited by high dimensionality of the combined datasets, the differences in their data distributions, and their integration to infer causal relationships. Here, we present Essential Regression (ER), a novel latent-factor-regression-based interpretable machine-learning approach that addresses these problems by identifying latent factors and their likely cause-effect relationships with system-wide outcomes/properties of interest. ER can integrate many multi-omic datasets without structural or distributional assumptions regarding the data. It outperforms a range of state-of-the-art methods in terms of prediction. ER can be coupled with probabilistic graphical modeling, thereby strengthening the causal inferences. The utility of ER is demonstrated using multi-omic system immunology datasets to generate and validate novel cellular and molecular inferences in a wide range of contexts including immunosenescence and immune dysregulation.
Keywords: causal inference; dimensionality reduction; interpretable machine learning; latent model; machine learning; systems biology; systems immunology.
© 2022 The Author(s).
Conflict of interest statement
The authors declare no competing interests.
Figures
Similar articles
-
SLIDE: Significant Latent Factor Interaction Discovery and Exploration across biological domains.Nat Methods. 2024 May;21(5):835-845. doi: 10.1038/s41592-024-02175-z. Epub 2024 Feb 19. Nat Methods. 2024. PMID: 38374265 Free PMC article.
-
From bench to bedside via bytes: Multi-omic immunoprofiling and integration using machine learning and network approaches.Hum Vaccin Immunother. 2023 Dec 15;19(3):2282803. doi: 10.1080/21645515.2023.2282803. Epub 2023 Dec 15. Hum Vaccin Immunother. 2023. PMID: 38100557 Free PMC article. Review.
-
Unfolding and de-confounding: biologically meaningful causal inference from longitudinal multi-omic networks using METALICA.mSystems. 2024 Oct 22;9(10):e0130323. doi: 10.1128/msystems.01303-23. Epub 2024 Sep 6. mSystems. 2024. PMID: 39240096 Free PMC article.
-
Unfolding and De-confounding: Biologically meaningful causal inference from longitudinal multi-omic networks using METALICA.bioRxiv [Preprint]. 2023 Dec 13:2023.12.12.571384. doi: 10.1101/2023.12.12.571384. bioRxiv. 2023. Update in: mSystems. 2024 Oct 22;9(10):e0130323. doi: 10.1128/msystems.01303-23. PMID: 38168315 Free PMC article. Updated. Preprint.
-
Computational approaches leveraging integrated connections of multi-omic data toward clinical applications.Mol Omics. 2022 Jan 17;18(1):7-18. doi: 10.1039/d1mo00158b. Mol Omics. 2022. PMID: 34734935 Review.
Cited by
-
SLIDE: Significant Latent Factor Interaction Discovery and Exploration across biological domains.Nat Methods. 2024 May;21(5):835-845. doi: 10.1038/s41592-024-02175-z. Epub 2024 Feb 19. Nat Methods. 2024. PMID: 38374265 Free PMC article.
-
Causal Discovery in High-dimensional, Multicollinear Datasets.Front Epidemiol. 2022;2:899655. doi: 10.3389/fepid.2022.899655. Epub 2022 Sep 13. Front Epidemiol. 2022. PMID: 36778756 Free PMC article.
-
From bench to bedside via bytes: Multi-omic immunoprofiling and integration using machine learning and network approaches.Hum Vaccin Immunother. 2023 Dec 15;19(3):2282803. doi: 10.1080/21645515.2023.2282803. Epub 2023 Dec 15. Hum Vaccin Immunother. 2023. PMID: 38100557 Free PMC article. Review.
-
Deep humoral profiling coupled to interpretable machine learning unveils diagnostic markers and pathophysiology of schistosomiasis.Sci Transl Med. 2024 Sep 18;16(765):eadk7832. doi: 10.1126/scitranslmed.adk7832. Epub 2024 Sep 18. Sci Transl Med. 2024. PMID: 39292803 Free PMC article.
-
Determining asthma endotypes and outcomes: Complementing existing clinical practice with modern machine learning.Cell Rep Med. 2022 Dec 20;3(12):100857. doi: 10.1016/j.xcrm.2022.100857. Cell Rep Med. 2022. PMID: 36543110 Free PMC article. Review.
References
-
- Suscovich T.J., Fallon J.K., Das J., Demas A.R., Crain J., Linde C.H., Michell A., Natarajan H., Arevalo C., Broge T., et al. Mapping functional humoral correlates of protection against malaria challenge following RTS,S/AS01 vaccination. Sci. Transl. Med. 2020;12:eabb4757. doi: 10.1126/scitranslmed.abb4757. - DOI - PubMed
Grants and funding
LinkOut - more resources
Full Text Sources
