. 2021 Jun 12:10:e00208.
doi: 10.1016/j.ohx.2021.e00208. eCollection 2021 Oct.

An open-source, automated, gas sampling peripheral for laboratory incubation experiments using cavity ring-down spectroscopy

Affiliations

An open-source, automated, gas sampling peripheral for laboratory incubation experiments using cavity ring-down spectroscopy

Timothy D Berry et al. HardwareX. .

Erratum in

Abstract

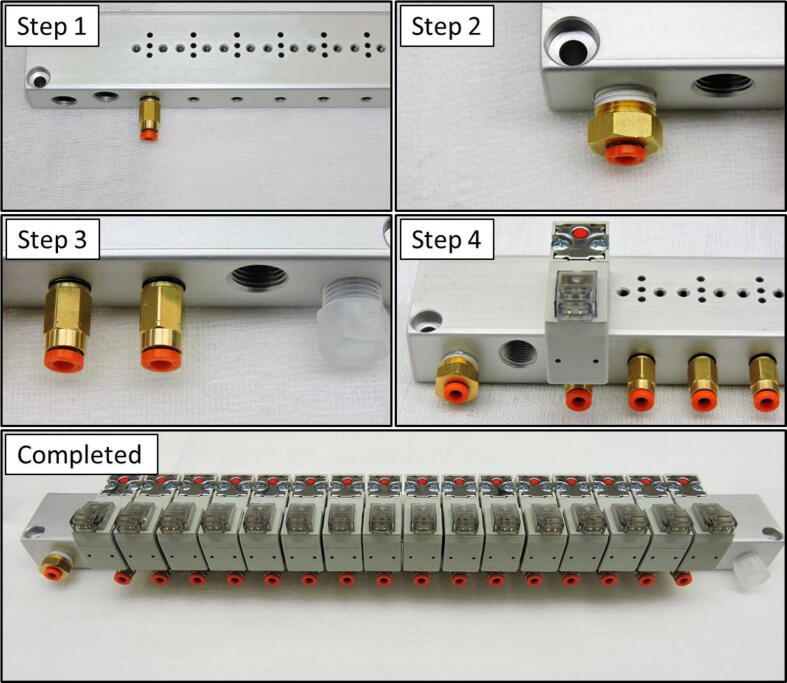
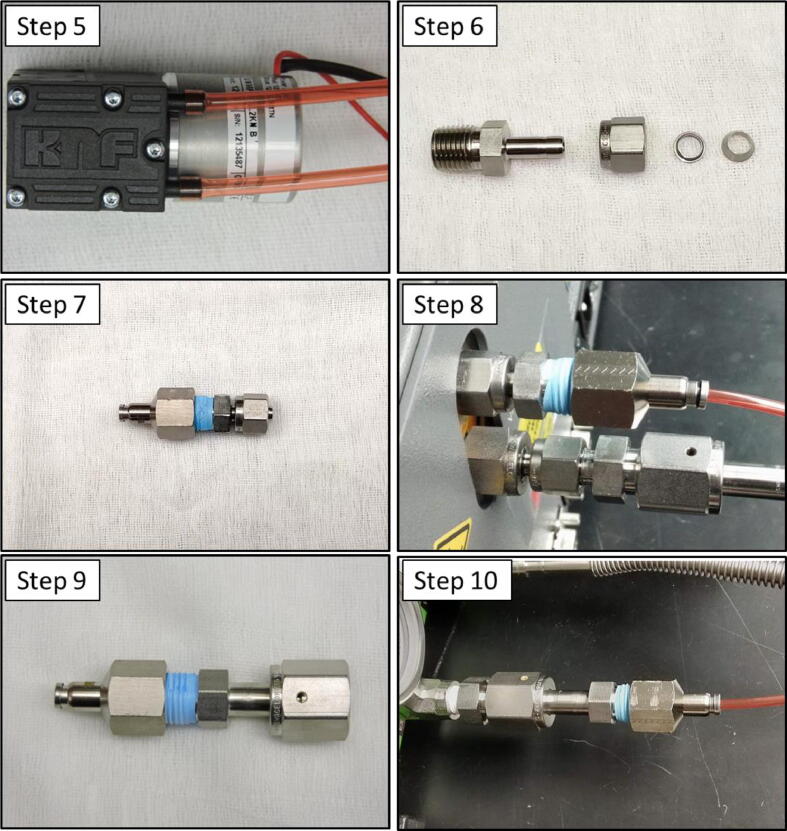
Spectroscopic instruments are becoming increasingly popular for measuring the isotopic composition and fluxes of a wide variety of gases in both field and laboratory experiments. The popularity of these instruments has created a need for automated multiplexers compatible with the equipment. While there are several such peripherals commercially available, they are currently limited to only a small number of samples (≤16), which is insufficient for some studies. To support researchers in constructing custom, larger-scale systems, we present our design for a scalable gas sampling peripheral that can be programmed to autonomously sample up to 56 vessels - the "multiplexer". While originally designed to be used with a Picarro cavity ring-down spectroscopy (CRDS) system, the multiplexer design and data processing approach implemented can be easily adapted to serve as a gas sampling/delivery platform for a wide variety of instruments including other cavity ring-down systems and infra-red gas analyzers. We demonstrate the basic capabilities of the multiplexer by using it to autonomously sample head-space CO2 from 14 laboratory-incubated soils amended with 13C-enriched pyrogenic organic matter for analysis in a Picarro G2201-i cavity ring-down spectroscopy system.

Keywords: Autosampler; Cavity ring-down spectroscopy; Gas sampling; Respiration study; Soil gas fluxes; Trace gas analysis.


Conflict of interest statement

Authors Nickerson and Creelman are employed by Eosense Inc., a for-profit company that produces gas multiplexer units for similar applications. No additional interests are present.

Figures

None
Graphical abstract
Fig. 1
Fig. 1
Schematic of the sample flow paths for the 128-solenoid gas sampling multiplexer. Arrows indicate the flow of gas within the tubing during operation. Numbers indicate paired valves on manifolds.
Fig. 2
Fig. 2
Parts list for manifold system. Components are labelled as in the bill of materials. (A1) Manifold fittings; (A2) Mainline fittings; (A3) Manifolds; (A4) Plastic plug; (A5) Solenoid valve.
Fig. 3
Fig. 3
Correct manifold orientation. Note the mirrored orientation.
Fig. 4
Fig. 4
Steps in the assembly of the solenoid manifolds. Panel labels correspond to instructions in the section 5.1 in the body of the text. Step 1 – install manifold fittings into each manifold. Step 2 – install mainline fittings into one supply port. Step 3 – install plastic plug into other supply port. Step 4 – attach solenoid valves to manifolds. A completed single manifold is shown.
Fig. 5
Fig. 5
Assembled and mounted manifolds.
Fig. 6
Fig. 6
Parts list for electrical system. Components are labelled as in the bill of materials. (B1) Breakout board; (B2) Connection board; (B3) Diodes; (B4) Relay board; (B5) Solenoid connector; (B6) Power supply.
Fig. 7
Fig. 7
Overview of multiplexer electrical system. Components are labelled as in the bill of materials. Inset. Magnified view of component B3 in circuit.
Fig. 8
Fig. 8
Steps in the assembly of the first solenoid/relay circuit. Panel labels correspond to instructions in section 5.2 in the body of the text. This process is repeated for each solenoid pair. Step 1 – connect breakout board GRND to connection board (−) with black wire; Step 2 – connect breakout board 12 V to connection board (+) with red wire; Step 3 – connect diode; Step 4 – solder red wire to connection board J1; Step 5 – solder solenoid connector wires to I1 and the (−) rail; Step 6 – solder white wire to (+) rail on the connection board. (For interpretation of the references to color in this figure legend, the reader is referred to the web version of this article.)
Fig. 9
Fig. 9
Matching leads from two different solenoid connectors (B5) can be consolidated by connecting them to a single jumper wire as show here before (left) and after (right) the application of heat-shrink insulation.
Fig. 10
Fig. 10
It is recommended that solenoid connectors be bundled and labelled in sets of 8 or 16.
Fig. 11
Fig. 11
Completed connections between connection board and relay board (top), magnified view of relay bank terminals (center), and the relay board with all connections made (bottom).
Fig. 12
Fig. 12
Parts list for tubing system. Components are labelled as in the bill of materials. (C1) T-fitting; (C2) Pump; (C3) Nut and Ferrule; (C4) MNPT-Tube fitting; (C5) FNPT-Tube fitting; (C6) MNPT-VCR Fitting.
Fig. 13
Fig. 13
Steps in the assembly of the multiplexer manifold tubing. Panel labels correspond to instructions in section 5.3 in the body of the text. Step 1 – connect each group of 4 manifolds together with T-fittings; Step 2 – connect the first fitting of each manifold on the inlet side together with T-fittings; Step 3 – connect the first fitting of each manifold on the outlet side to separate lengths of tubing; Step 4 – connect the last fitting on each manifold on each inlet manifold to the corresponding fitting on an outlet manifold.
Fig. 14
Fig. 14
Steps in the assembly of pumping system. Panel labels correspond to instructions in section 5.3 in the body of the text. Step 5 – connect tubing to auxiliary pump; Step 6 – connect a Swagelok nut to the MNPT-tubing adapter; Step 7 – connect the MNPT-tubing fitting to one of the FNPT-tube fittings separate lengths of tubing; Step 8 – connect the combined fitting to the inlet of the analytical instrument; Step 9 – connect the remaining FNPT-tube fitting to the MNPT-VCR fitting; Step 10 – connect this combined fitting to the outlet of the analytical instrument.
Fig. 15
Fig. 15
Schematic of the junction connecting the auxiliary pump, manifolds, and analytical instruments. When first starting the instrument, it is recommended tubing be disconnected from one fitting to prevent over-pressurization before a solenoid can be activated.
Fig. 16
Fig. 16
The dilution effect caused by non-sample gases in the multiplexer system can be determined by plotting the measured concentration of a gas against the expect concentration of the gas in a vessel of known volume at a known pressure in a background of CO2-free synthetic air. The slope of the regression line from this figure was used in the data processing script to correct the measured CO2 concentrations in the demonstration experiment.
Fig. 17
Fig. 17
The soils attached to the multiplexer during the incubation experiment. The manifolds (A) can be seen mounted vertically on the side of the shelving unit holding the samples. The control board (B) sits nearby (uncovered for this picture).
Fig. 18
Fig. 18
Flow paths of gas during flushing of lines and manifolds (A), sampling (B), flushing of sample vessels (C), and idle (D) phases of the multiplexer sample cycle. Colored lines with arrows depict tubing with active gas flow in the direction indicated while gray lines indicate tubing that is unused at that step.
Fig. 19
Fig. 19
An example trace demonstrating the measurement of CO2 respired by soil samples – in this trace three soil microcosms were analyzed (green) and flushed with synthetic zero air (blue) before being allowed to accumulate CO2 for future measurements. Manifolds and gas lines were flushed and vented to atmosphere in between analyses (red). (For interpretation of the references to color in this figure legend, the reader is referred to the web version of this article.)
Fig. 20
Fig. 20
An example of a figure generated by the data processing script using the data from the experiment described. This figure shows the cumulative mineralization of soil organic matter over time in PyOM amended and un-amended soils. Points are individual measurements.

References

    1. Zalicki P., Zare R.N. Cavity ring-down spectroscopy for quantitative absorption-measurements. J. Chem. Phys. 1995;102(7):2708–2717.
    1. Crosson E.R., et al. Stable isotope ratios using cavity ring-down spectroscopy: determination of 13C/12C for carbon dioxide in human breath. Anal. Chem. 2002;74(9):2003–2007. - PubMed
    1. Midwood A.J., Millard P. Challenges in measuring the delta C-13 of the soil surface CO2 efflux. Rapid Commun. Mass Spectrom. 2011;25(1):232–242. - PubMed
    1. Kerstel E., Gianfrani L. Advances in laser-based isotope ratio measurements: selected applications. Appl. Phys. B-Lasers and Optics. 2008;92(3):439–449.
    1. Robinson, David and Alex Hayes, Broom: Convert statistical analysis objects into tidy tibbles. 2018. R package: version 0.5.0.

LinkOut - more resources