Multicenter Study
. 2023 Feb 8;76(3):e426-e438.
doi: 10.1093/cid/ciac404.

Humoral and T-Cell Immune Response After 3 Doses of Messenger RNA Severe Acute Respiratory Syndrome Coronavirus 2 Vaccines in Fragile Patients: The Italian VAX4FRAIL Study

Collaborators, Affiliations
Multicenter Study

Humoral and T-Cell Immune Response After 3 Doses of Messenger RNA Severe Acute Respiratory Syndrome Coronavirus 2 Vaccines in Fragile Patients: The Italian VAX4FRAIL Study

Paolo Corradini et al. Clin Infect Dis. .

Abstract

Background: Patients with solid or hematological tumors or neurological and immune-inflammatory disorders are potentially fragile subjects at increased risk of experiencing severe coronavirus disease 2019 and an inadequate response to severe acute respiratory syndrome coronavirus 2 (SARS-CoV-2) vaccination.

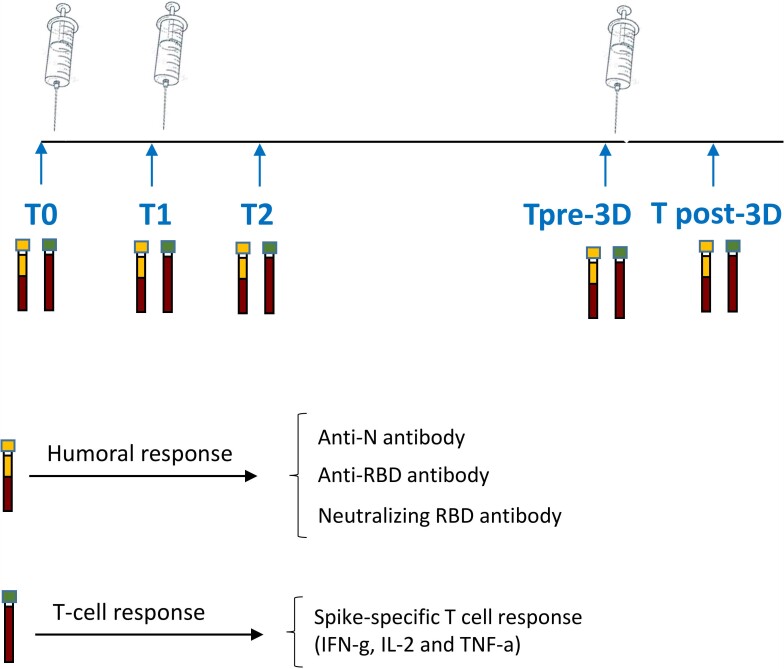
Methods: We designed a prospective Italian multicenter study to assess humoral and T-cell responses to SARS-CoV-2 vaccination in patients (n = 378) with solid tumors (ST), hematological malignancies (HM), neurological disorders (ND), and immunorheumatological diseases (ID). A group of healthy controls was also included. We analyzed the immunogenicity of the primary vaccination schedule and booster dose.

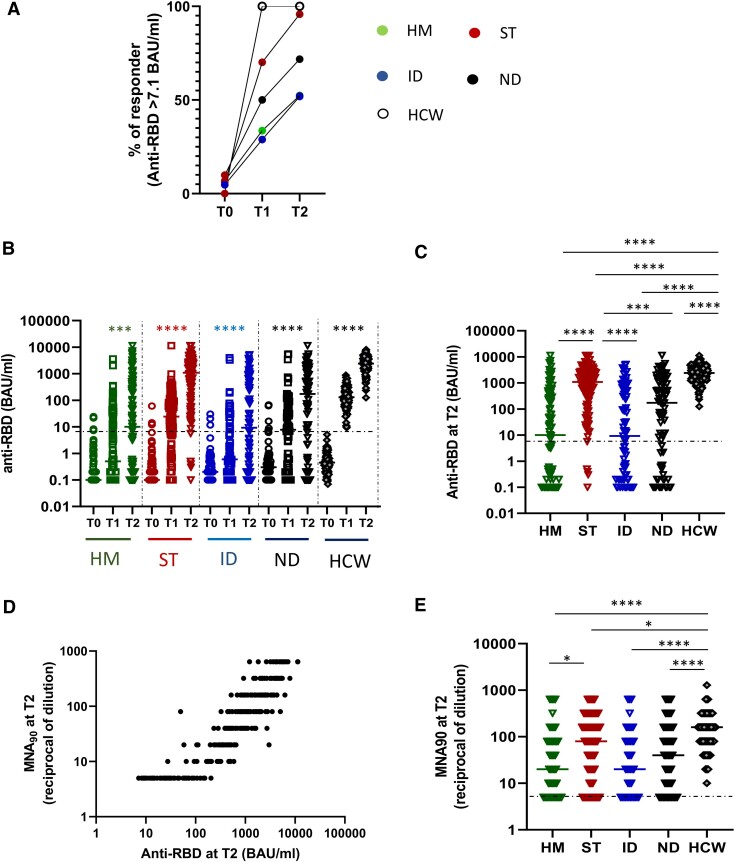
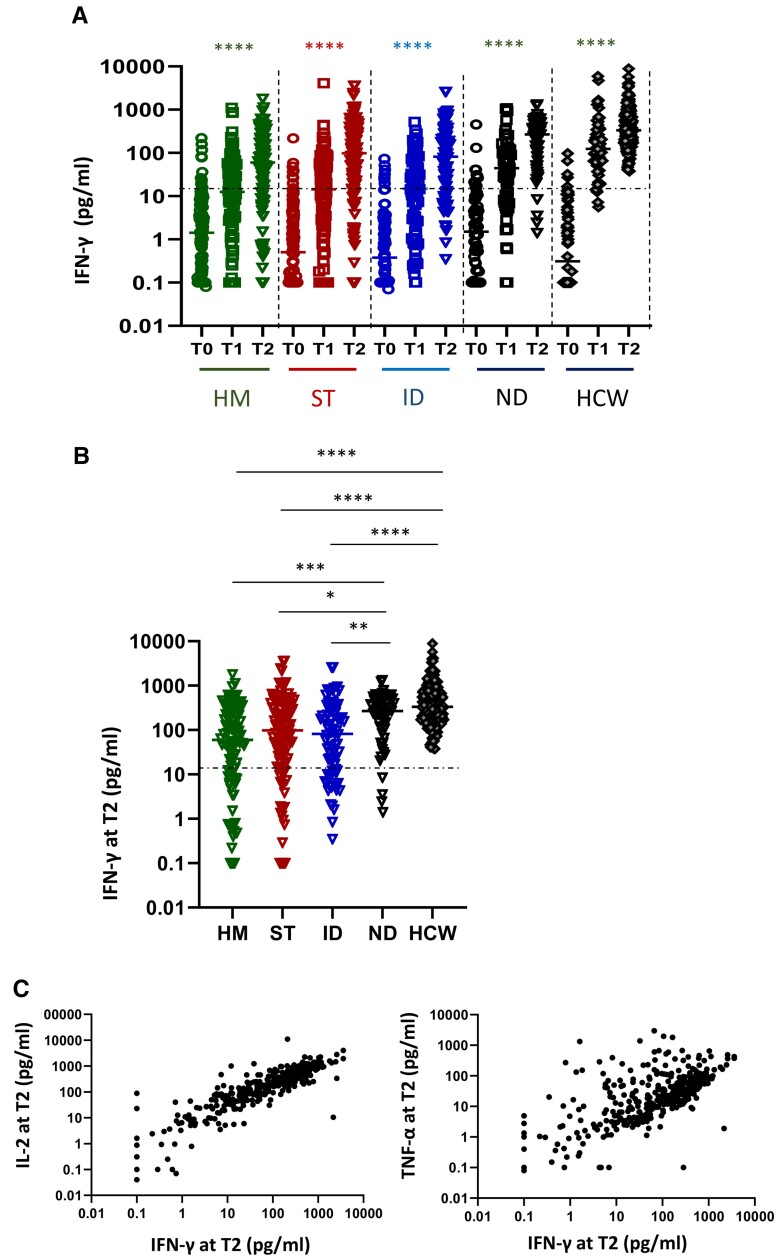
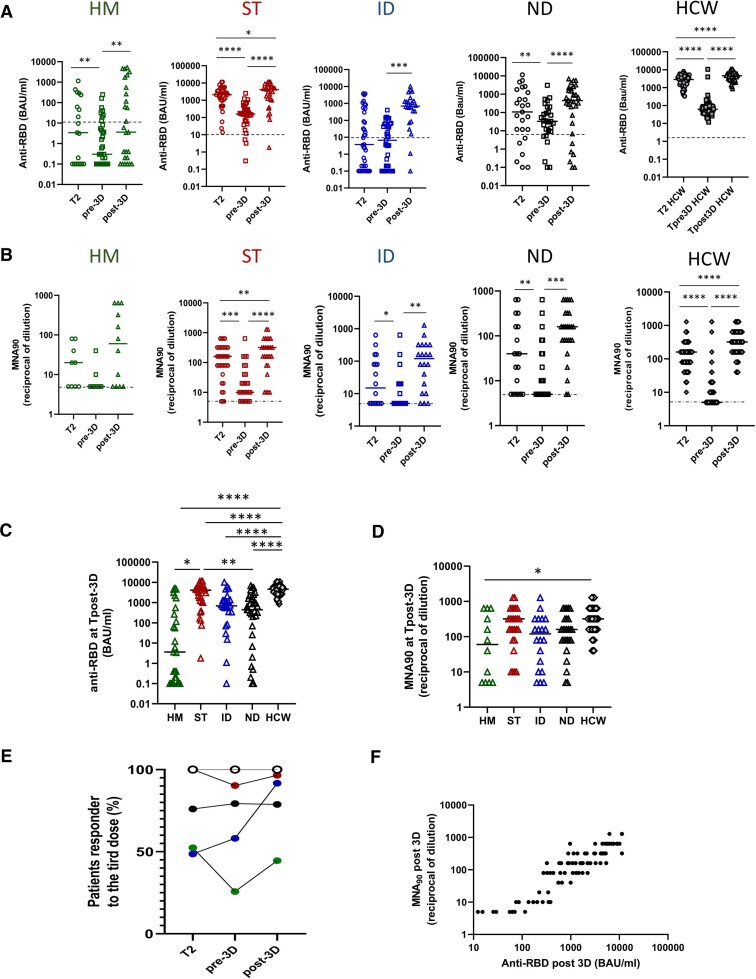
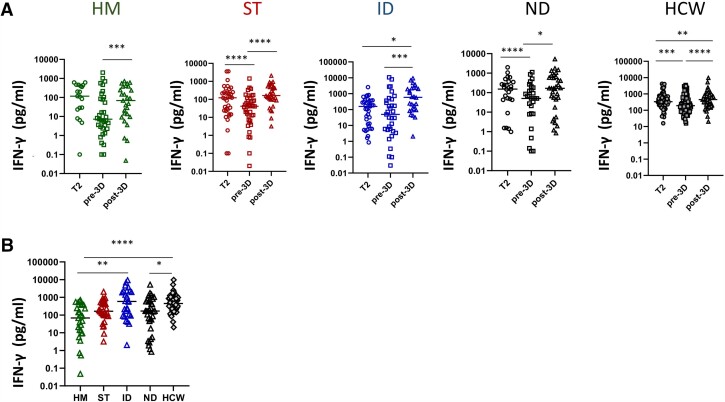
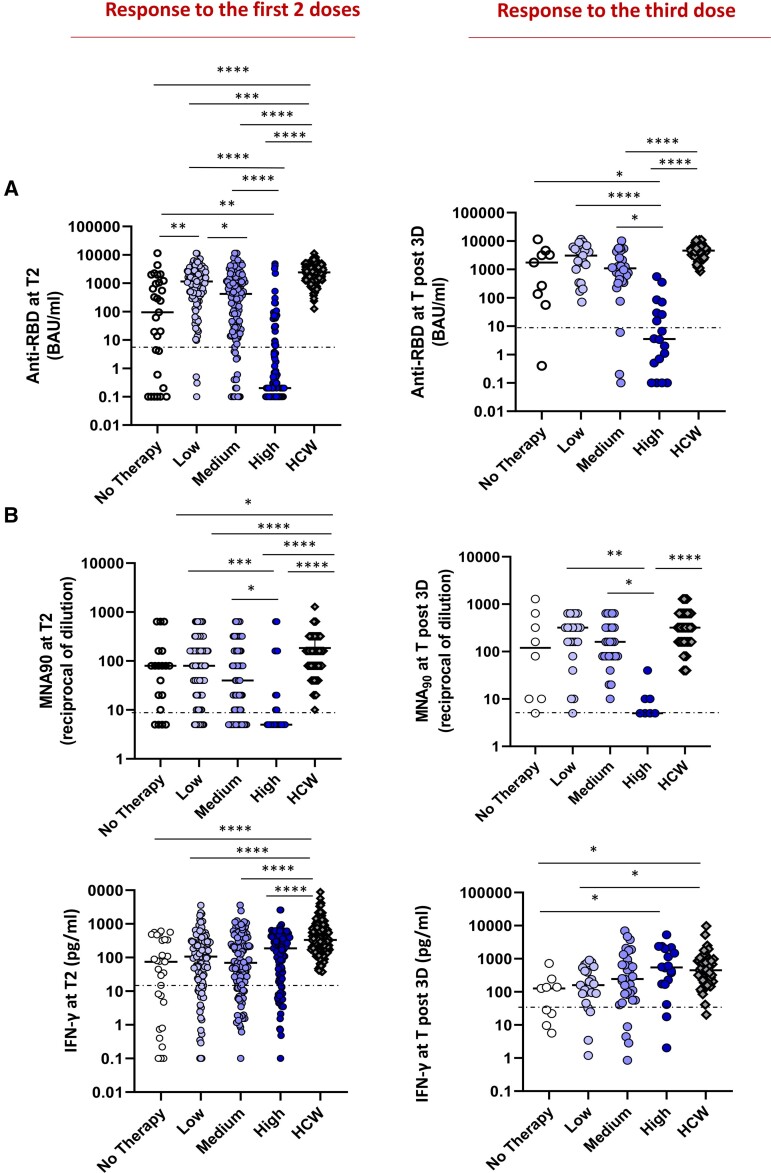
Results: The overall seroconversion rate in patients after 2 doses was 62.1%. Significantly lower rates were observed in HM (52.4%) and ID (51.9%) than in ST (95.6%) and ND (70.7%); a lower median antibody level was detected in HM and ID versus ST and ND (P < .0001). Similar rates of patients with a positive SARS-CoV-2 T-cell response were found in all disease groups, with a higher level observed in ND. The booster dose improved the humoral response in all disease groups, although to a lesser extent in HM patients, whereas the T-cell response increased similarly in all groups. In the multivariable logistic model, independent predictors of seroconversion were disease subgroup, treatment type, and age. Ongoing treatment known to affect the immune system was associated with the worst humoral response to vaccination (P < .0001) but had no effect on T-cell responses.

Conclusions: Immunosuppressive treatment more than disease type per se is a risk factor for a low humoral response after vaccination. The booster dose can improve both humoral and T-cell responses.

Keywords: Fragile patients; SARS-CoV-2 mRNA vaccine; T-cell immunity; humoral immunity.


Conflict of interest statement

Potential conflicts of interest . P. C. reports consulting fees for advisory board participation from AbbVie, ADC Therapeutics, Amgen, BeiGene, Celgene, Daiichi Sankyo, Gilead/Kite, GSK, Incyte, Janssen, KyowaKirin, Nerviano Medical Science, Novartis, Roche, Sanofi, and Takeda; payment or honoraria for lectures from AbbVie, Amgen, Celgene, Gilead/Kite, Janssen, Novartis, Roche, Sanofi, Takeda; support for attending meetings and/or travel from AbbVie, Amgen, BMS, Celgene, Gilead/Kite, Janssen, Novartis, Roche, and Takeda. A. Mantovani reports royalties for reagents related to innate immunity; consulting fees and payment or honoraria as a consultant/advisory board member for Novartis, Roche, Ventana, Pierre Fabre, Verily, AbbVie, BMS, J&J, Imcheck, Myeloid Therapeutics, Astra Zeneca, Biovelocita, BG Fund, Third Rock Venture, Violend Verseau Therapeutics, Macrophage pharma, Ellipses Pharma, and Olatec Therapeutics; and is the inventor of patents related to PTX3 and other innate immunity molecules. D. G. reports payment or honoraria for lesson to a Master from Vivamed s.r.l., consulting from MSD Italia, and consulting from MITT Medical and Scientific Learning. PLZ reports consulting fees from Takeda, Janssen, BMS, MSD, Kyowa Kirin, Sanofi, Eusa Pharma, and Roche; payment or honoraria for lectures, presentations, speakers bureaus, manuscript writing or educational events from Takeda, MSD, Kyowa Kirin, Sanofi, Beigene, and Roche. R. M. reports consulting fees paid to author from Alexion, Argenx, and UCB; payment to author for lectures, presentations, speakers bureaus, manuscript writing or educational events from Alexion, Argenx, Merck Serono, Reflexion Medical Network, Sanofi Aventis, UCB; paid participation on Data Safety Monitoring or Advisory Board with Alexion, Argenx, Catalyst, and UCB. A. U. reports grants or contracts unrelated to this work from FISM, ALEXION, BIOGEN, ROCHE, MERCK SERONO, and COVAXIMS; participation on Data Safety Monitoring or Advisory Board for BD, BIOGEN, IQVIA, SANOFI, ROCHE, ALEXION, BRISTOL MYERS SQUIBB. N. S. reports payment or honoraria for lectures, presentations, speakers bureaus, manuscript writing, or educational events from Lilly, Roche, and Servier. F. L. reports a position as President of the Italian Higher Council of Health, the technical scientific advisory body to the Ministry of Health since 2019 and a position as Coordinator of the Technical-Scientific Committee for the COVID-19 pandemic from March 2021 to March 2022. All other authors report no potential conflicts. All authors have submitted the ICMJE Form for Disclosure of Potential Conflicts of Interest. Conflicts that the editors consider relevant to the content of the manuscript have been disclosed.

Figures

Figure 1.
Figure 1.
Study design. Schematic representation of the timeline of immune monitoring of the clinical study. Abbreviations: RBD, receptor binding domain; T0, before vaccination; T1, after 3–4 weeks from T0; T2, 5–8 weeks from T0; Tpre-3D. 5 months from T2; Tpost-3D, 2-4 weeks from Tpre-3D.
Figure 2.
Figure 2.
Impact of different diseases on humoral response. A, The percentage of patients (HM, green dot; ST, red dots; ID, blue dots; ND, black dots; HCW, white dots) presenting a positive anti-RBD response (>7.1 BAU/mL) at each time point (T0, T1, and T2) is shown. B, Kinetics of humoral immune response before and after vaccination in HM (green dots), ST (red dots), ID (blue dots), ND (black dots), and HCW (gray dots). SARS-CoV-2 specific anti-RBD Abs were measured in sera samples at each time point. Anti-RBD-immunoglobulin G are expressed as BAU/mL and values >7.1 BAU/mL are considered positive. Differences were evaluated by Friedman paired test. ****P < .0001. C, The level of anti-RBD antibodies at T2 was compared among groups and was expressed as BAU/mL. Differences were evaluated by Kruskal-Wallis test. *P < .05; **P < .01; ***P < .001; ****P < .0001. HM: median = 10.0 BAU/mL (IQR 0.1–392.5 BAU/mL); ST: 1094.6 BAU/mL (IQR 265.1–2697.9 BAU/mL); ID: 9.2 BAU/mL (IQR 0.2–503.8 BAU/mL); NT: 172.9 BAU/mL (IQR 1.7–1457.8 BAU/mL) and HCW: 2405.0 BAU/mL (IQR 1343–3848 BAU/mL, respectively). D, The correlation between the levels of anti-RBD and neutralization titer at T2 for all fragile patients are shown. Each black dot represents one sample. Spearman test: rho = 0.9202, P < .0001. E, The levels of neutralizing antibody at T2 were quantified by microneutralization assay (MNA90) in all groups and were expressed as reciprocal of dilution. Differences were evaluated by Kruskal-Wallis test. *P < .05; ****P < .0001. HM: median = 20 reciprocal of dilution (IQR 5–80); ST: 80 reciprocal of dilution (IQR 20–240); ID: 20 reciprocal of dilution (IQR 5–80); NT: 40 reciprocal of dilution (IQR 8.75–160) and HCW: 160 (IQR 80–320). Abbreviations: Abs, antibodies; HCW, health care workers; HM, hematological malignancies; ID, immune-rheumatological diseases; IQR, interquartile range; ND, neurological disorders; RBD, receptor binding domain; SARS-CoV-2, severe acute respiratory syndrome 2 virus; ST, solid tumors; T0, before vaccination; T1, after 3–4 weeks from T0; T2, 5–8 weeks from T0.
Figure 3.
Figure 3.
Impact of different diseases on T-cell response. A, Kinetic of T-cell response before and after vaccination in HM (green dots), ST (red dots), ID (blue dots), ND (black dots), and HCW (gray dots). Spike-specific T-cell response was measured after stimulation of whole blood with specific peptides at each time point. T-cell response was expressed as pg/mL of IFN-γ and values >12 pg/mL are considered positive. Differences were evaluated by Friedman paired test. ****P < .0001. B, The level of T cell response at T2 was compared among groups and was expressed as pg/mL of IFN-γ. Differences were evaluated by Kruskal-Wallis test. *P < .05; **P < .01; ***P < .001; ****P < .0001. HM: median = 60.2 pg/mL (IQR 9.4–247.2 pg/mL); ST: 98.6 pg/mL (IQR 18.9–335.1 pg/mL); ID: 81.8 pg/mL (IQR 12.1–284.1 pg/mL); NT: 268.5 pg/mL (IQR 107.6–505.5 pg/mL) and HCW: 331.9 pg/mL (IQR 189.9–765.0 pg/mL, respectively). C: The correlation between the levels of IFN-γ and interleukin-2 or IFN-γ and tumor necrosis factor-α at T2 for all fragile patients are shown. Each black dot represents one sample. Spearman test: rho = 0.8739 and .6368, P < .0001. Abbreviations: HCW, health care workers; HM, hematological malignancies; ID, immune-rheumatological diseases; ND, neurological disorders; ST, solid tumors; T0, before vaccination; T1, after 3–4 weeks from T0; T2, 5–8 weeks from T0.
Figure 4.
Figure 4.
Kinetic of humoral response after 2 and 3 doses of vaccine in diseases groups. A, The level of the anti-RBD antibody was compared in HM (green dots), ST (red dots), ID (blue dots), ND (black dots), and HCW (gray dots) at 3 different time points: after 2 doses (T2) and before (pre-3D) and after (post-3D) the booster dose. Differences were evaluated by Wilcoxon paired test. HM: median T2: 3.4 BAU/mL (IQR 0.1-238.8 BAU/mL); median pre-3D: 0.3 BAU/mL (IQR 0.1-8.1 BAU/mL); median post-3D: 3.6 BAU/mL (IQR 0.1-555.6 BAU/mL). **P < .001. ST: median T2: 2089 BAU/mL (IQR 956.7–3652.0 BAU/mL); median pre-3D: 158.1 BAU/mL (IQR 58.0–444.6 BAU/mL); median post-3D: 4093 BAU/mL (IQR 1051.0–5769.0 BAU/mL). *P < .05; ****P < .0001. ID: median T2: 3.7 BAU/mL (IQR 0.15–400.4 BAU/mL); median pre-3D: 6.6 BAU/mL (IQR 0.2–59.9 BAU/mL); median post-3D: 694.0 BAU/mL (IQR 150.0–1356.0 BAU/mL). ***P < .001. ND: median T2: 107.0 BAU/mL (IQR 7.8–1510.0 BAU/mL); median pre-3D: 32.6 BAU/mL (IQR 9.3–151.9 BAU/mL); median post-3D: 443.0 BAU/mL (IQR 48.0–1770.0 BAU/mL). **P < .01, ****P < .0001. HCW: median T2: 2646.0 BAU/mL (IQR 1529.0–3958.0 BAU/mL); median pre-3D: 60.20 BAU/mL (IQR 39.3–93.5BAU/mL); median post-3D: 4608.0 BAU/mL (IQR 3302.0-6030.0 BAU/mL). ****P < .0001. B, The level of the neutralizing antibody was compared in HM (green dots), ST (red dots), ID (blue dots), ND (black dots), and HCW (gray dots) at 3 different time points: after 2 doses (T2) and before (pre-3D) and after (post-3D) the booster dose. Differences were evaluated by Wilcoxon paired test. HM: median T2: 20 reciprocal of dilution (IQR 5–60); median pre-3D: 5 reciprocal of dilution (IQR 5–7.5); median post-3D: 60 reciprocal of dilution (IQR 5–560). ST: median T2: 160 reciprocal of dilution (IQR 80–320); median pre-3D: 10 reciprocal of dilution (IQR 6.2–40.0); median post-3D: 320 reciprocal of dilution (IQR 80–640). **P < .01, ***P < .001, ****P < .0001. ID: median T2: 15 reciprocal of dilution (IQR 5–100); median pre-3D: 5 reciprocal of dilution (IQR 5–20); median post-3D: 120 reciprocal of dilution (IQR 12.5–320). *P < .05, **P < .01. ND: median T2: 40 reciprocal of dilution (IQR 5–160); median pre-3D: 5 reciprocal of dilution (IQR 5–40); median post-3D: 160 reciprocal of dilution (IQR 80–320). **P < .01, ***P < .001. HCW: median T2: 160 reciprocal of dilution (IQR 80–160); median pre-3D: 5 reciprocal of dilution (IQR 5–10); median post-3D: 320 reciprocal of dilution (IQR 160-640). **** P < .0001. C, The level of anti-RBD antibodies at Tpost-3D was compared among groups and was expressed as BAU/mL. Differences were evaluated by Kruskal-Wallis test. *P < .05; **P < .01; ****P < .0001. HM: median = 3.6 BAU/mL (IQR .1-555.6 BAU/mL); ST: 4093.0 BAU/mL (IQR 1051.0–5769.0 BAU/mL); ID: 694.0 BAU/mL (IQR 150.0–1356.0 BAU/mL); ND: 443 BAU/mL (IQR 48.1–1770.0 BAU/mL) and HCW: 4608.0 BAU/mL (IQR 3302.0–6030.0 BAU/mL, respectively). D, The level of neutralizing antibodies at Tpost-3D was compared among groups and was expressed as reciprocal of dilution. Differences were evaluated by Kruskal-Wallis test. *P < .05. HM: median = 60 reciprocal of dilution (IQR 5–560); ST: 320 reciprocal of dilution (IQR 80–640); ID: 120 reciprocal of dilution (IQR 12.5–320); ND: 160 reciprocal of dilution (IQR 180–320) and HCW: 320 reciprocal of dilution (IQR 160–640, respectively). E, The percentage of patients (HM, green dot; ST, red dots; ID, blue dots; ND, black dots; HCW, white dots) presenting a positive anti-RBD response (>7.1 BAU/mL) at T2, before (pre-3D) and after (post-3D) the booster dose is shown. F, The correlation between the levels of anti-RBD and neutralization titer at T post-3D for all fragile patients is shown. Each black dot represents 1 sample. Spearman test: rho: .8965, P < .0001). Abbreviations: HCW, health care workers; HM, hematological malignancies; ID, immune-rheumatological diseases; IQR, interquartile range; ND, neurological disorders; ST, solid tumors; T2: 5–8 weeks from T0; Tpre-3D, 5 months from T2; Tpost-3D, 2–4 weeks from Tpre-3D.
Figure 5.
Figure 5.
Kinetics of T-cell response after 2 and 3 doses of vaccine in diseases groups. A, S-specific T-cell response expressed as pg/mL of IFN-γ was quantified before and after the booster dose in HM, ST, ID, ND and HCW. Differences were evaluated by Wilcoxon paired test. HM: median T2: 116.5 pg/mL (IQR 23.2–436.6 pg/mL); median pre-3D: 7.24 pg/mL (IQR 2.3–94.6 pg/mL); median post-3D: 68.5 pg/mL (IQR 9.5–378.3 pg/mL). *** P < .001. ST: median T2: 122.8 pg/mL (IQR 23.0–250.8 pg/mL); median pre-3D: 41.3 pg/mL (IQR 10.0–104.7 pg/mL); median post-3D: 163.1 pg/mL (IQR 95.2–522.7 pg/mL). ****P < .0001. ID: median T2: 158.45 pg/mL (IQR 10.6–354.8 pg/mL); median pre-3D: 49.4 pg/mL (IQR 4.8–402.3 pg/mL); median post-3D: 590.2 pg/mL (IQR 92.4–2223.0 pg/mL). *P < .05, ***P < .001. ND: median T2: 152.8 pg/mL (IQR 42.9–358.6 pg/mL); median pre-3D: 50.6 pg/mL (IQR 8.3-170.3 pg/mL); median post-3D: 167.5 pg/ml (IQR 31.6-624.5 pg/mL). *P < .05, ***P < .001. HCW: median T2: 335.9 pg/mL (IQR 199.0–679.0 pg/mL); median pre-3D: 190.8 pg/mL (IQR 88.7–437.2 pg/ml); median post-3D: 448.9 pg/mL (IQR 197.3–862.2 pg/mL). **P < .01, ***P < .001, ****P < .0001. B, S-specific T-cell response at Tpost-3D was compared among groups and was expressed as pg/mL. Differences were evaluated by Kruskal-Wallis test. *P < .05; **P < .01; ****P < .0001. HM: median = 68.6 pg/mL (IQR 9.5–378.3 pg/mL); ST: 163.1 pg/mL (IQR 95.2–522.7 pg/mL); ID: 590.2 pg/mL (IQR 92.4–2223.0 pg/mL); ND: 167.5 pg/mL (IQR 31.6–624.5 pg/mL) and HCW: 448.9 pg/mL (IQR 197.3–852.2 pg/mL). Abbreviations: HCW, health care workers; HM, hematological malignancies; ID, immune-rheumatological diseases; IQR. interquartile range; ND, neurological disorders; ST, solid tumors; T2, 5–8 weeks from T0; Tpre-3D, 5 months from T2; Tpost-3D, 2–4 weeks from Tpre-3D.
Figure 6.
Figure 6.
Impact of different therapy on immune response. Independently from the diseases, the patients were divided on the basis of therapy in 4 groups: untreated (white dots) or treated by therapy with a low (light violet dots), medium (dark violet dots), and high (blue dots) impact on the immune system. A group of HCW was added as a control. The immunogenicity of 2 or 3 doses of vaccine was compared among groups. A, The levels of anti-RBD in the 4 patient groups and in HCW are shown. Differences were evaluated by Kruskal-Wallis test. **P < .01; ***P < .001; ****P < .0001. Response after 2 doses: no therapy: median = 94.2 BAU/mL (IQR .4–1133.0 BAU/mL); low impact: 1144.0 BAU/mL (IQR 368.1–11,360.0 BAU/mL); medium impact: 420.3 BAU/mL (IQR 17.4–1563.0 BAU/mL); high impact: 0.2 (IQR 0.1–6.4 BAU/mL); HCW: 2405.0 BAU/mL (IQR 1343–3848 BAU/mL). Response after the third dose: no therapy: median = 1748 BAU/mL (IQR 95.4–3917.0 BAU/mL); low impact: 3044 BAU/mL (IQR 998.8–6175.0 BAU/mL); medium impact: 1088.0 BAU/mL (IQR 380.1–2536.0 BAU/mL); high impact: 3.5 (IQR .4–39.6 BAU/mL); HCW: post-3D: 4608.0 BAU/mL (IQR 3302.0–6030.0 BAU/mL). B, The level of neutralizing antibodies in the 4 groups is shown. Differences were evaluated by Kruskal-Wallis test. *P < .05; ****P < .0001. Response after 2 doses: no therapy: median = 80 reciprocal of dilution (IQR 10–160); low impact: 80 reciprocal of dilution (IQR 20–160); medium impact: 40 reciprocal of dilution (IQR 6.2–160.0); high impact: 5 reciprocal of dilution (IQR 5–20); HCW: 160 (IQR 80–320). Response after the third dose: no therapy: median = 120 reciprocal of dilution (IQR 10–560); low impact: 320 reciprocal of dilution (IQR 140–400); medium impact: 160 reciprocal of dilution (IQR 80–320); high impact: 5 reciprocal of dilution (IQR 5–10); HCW: 320 reciprocal of dilution (IQR 160–640). C: The T-cell response, analyzed by quantifying IFN-γ in the 4 groups is shown. Differences were evaluated by Kruskal-Wallis test. Response after 2 doses: no therapy: median = 74.9 pg/mL (IQR 2.7–338.4 pg/mL); low impact: 105.9 pg/mL (IQR 26.3–291.9 pg/mL); medium impact: 69.2 pg/mL (IQR 18.1–297.3 pg/mL); high impact: 186.3 pg/mL (IQR 22.7–390.0); HCW: 331.9 pg/mL (IQR 189.9–765.0 pg/mL). Response after the third dose: no therapy: median = 127.2 pg/mL (IQR 15.8–192.0 pg/mL); low impact: 158.9 pg/mL (IQR 87.2–536.4 pg/mL); medium impact: 243.4 pg/mL (IQR 69.3–799.7 pg/mL); high impact: 545.3 pg/mL (IQR 171.9–2049.0). HCW: 448.9 pg/mL (IQR 197.3–852.2 pg/mL). Abbreviations: HCW, health care workers; IQR, interquartile range; RBD, receptor binding domain; T2, 5–8 weeks from T0; Tpost-3D, 2–4 weeks from Tpre-3D.

References

    1. Passamonti F, Cattaneo C, Arcaini L, et al. . Clinical characteristics and risk factors associated with COVID-19 severity in patients with haematological malignancies in Italy: a retrospective, multicentre, cohort study. Lancet Haematol 2020; 7:e737–745. - PMC - PubMed
    1. Salvarani C, Bajocchi G, Mancuso P, et al. . Susceptibility and severity of COVID-19 in patients treated with bDMARDS and tsDMARDs: a population-based study. Ann Rheum Dis 2020; 79:986.2–988. Available at:https://ard.bmj.com/lookup/doi/10.1136/annrheumdis-2020-217903. - DOI - PubMed
    1. Saini KS, Tagliamento M, Lambertini M, et al. . Mortality in patients with cancer and coronavirus disease 2019: a systematic review and pooled analysis of 52 studies. Eur J Cancer 2020; 139:43–50. Available at:https://linkinghub.elsevier.com/retrieve/pii/S0959804920304627. - PMC - PubMed
    1. Laroni A, Schiavetti I, Sormani MP, Uccelli A. COVID-19 in patients with multiple sclerosis undergoing disease-modifying treatments. Mult Scler J 2020; 27:2126–36. - PubMed
    1. El Sahly HM, Baden LR, Essink B, et al. . Efficacy of the mRNA-1273 SARS-CoV-2 vaccine at completion of blinded phase. N Engl J Med 2021; 385:1774–85. Available at:https://www.nejm.org/doi/10.1056/NEJMoa2113017. Accessed 29 December 2021. - DOI - PMC - PubMed

Publication types