. 2022 Jun 27;38(13):3385-3394.
doi: 10.1093/bioinformatics/btac356.

An automated multi-modal graph-based pipeline for mouse genetic discovery

Affiliations

An automated multi-modal graph-based pipeline for mouse genetic discovery

Zhuoqing Fang et al. Bioinformatics. .

Abstract

Motivation: Our ability to identify causative genetic factors for mouse genetic models of human diseases and biomedical traits has been limited by the difficulties associated with identifying true causative factors, which are often obscured by the many false positive genetic associations produced by a GWAS.

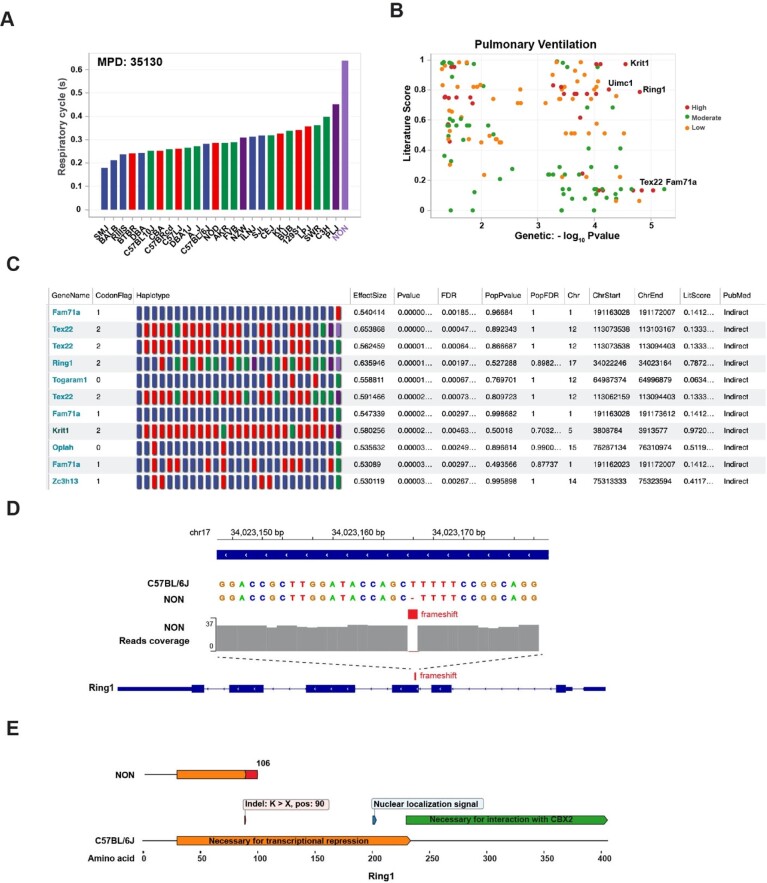
Results: To accelerate the pace of genetic discovery, we developed a graph neural network (GNN)-based automated pipeline (GNNHap) that could rapidly analyze mouse genetic model data and identify high probability causal genetic factors for analyzed traits. After assessing the strength of allelic associations with the strain response pattern; this pipeline analyzes 29M published papers to assess candidate gene-phenotype relationships; and incorporates the information obtained from a protein-protein interaction network and protein sequence features into the analysis. The GNN model produces markedly improved results relative to that of a simple linear neural network. We demonstrate that GNNHap can identify novel causative genetic factors for murine models of diabetes/obesity and for cataract formation, which were validated by the phenotypes appearing in previously analyzed gene knockout mice. The diabetes/obesity results indicate how characterization of the underlying genetic architecture enables new therapies to be discovered and tested by applying 'precision medicine' principles to murine models.

Availability and implementation: The GNNHap source code is freely available at https://github.com/zqfang/gnnhap, and the new version of the HBCGM program is available at https://github.com/zqfang/haplomap.

Supplementary information: Supplementary data are available at Bioinformatics online.


Figures

Fig. 1.
Fig. 1.
Overview of the GNNHap pipeline. (A) This flowchart shows the major steps used to analyze the mouse genetic model data. This pipeline uses the datasets in a MPD and another database with SNP, indel and SV alleles generated from analysis of whole-genome sequence data from 53 inbred strains. The HBCGM modules uses the variant database to assemble haplotype blocks for strains that were analyzed in the phenotypic dataset, and it then statistically assesses the correlation between the alleles within the haplotype blocks and the measured strain responses. The output (candidate genes based upon the calculated genetic association) is passed to the GNN module, which assesses the relationship (literature score) between the MeSH term (which is a surrogate for the phenotype) and gene candidates. The final output is a list of prioritized gene candidates that are visualized by a web application. (B) The heterogeneous graph consists of PPIs, gene–MeSH associations and a MeSH relational network that was constructed using a hierarchical tree structure with 16 edge types (relationships). A potential association between a candidate gene and a MeSH term (indicated by a ‘?’), which is considered as a missing link in the heterogenous graph, is quantitatively evaluated by this computational pipeline. (C) The genes are initially represented by their amino acid sequences, which are then transformed into statistical embeddings using the UniRep (Alley et al., 2019) model. For the literature analysis, the phenotype (represented by the MeSH term) is converted into sentence embeddings using SentenceTransformers (Reimers and Gurevych, 2019). Three stacked modules are then used to refine the gene and MeSH feature vectors: a graph convolutional network (GCN); a relational graph convolutional network (RGCN); and a graph attention network (GAT). The gene embeddings are passed to the GCN module to obtain the PPI information, while MeSH embeddings were passed to the RGCN module to generate the MeSH–MeSH relationship. The GAT module is run on the gene–MeSH association graph to further refine the embeddings of the genes and MeSH terms, which is accomplished by exchanging information between gene and MeSH terms. Finally, two fully connected layers (LinkPredictor) are used to reduce the dimensions of the latent vector and to predict the probability that the gene and MeSH terms are associated. The numbers shown in the panel indicate the dimensions of the input and output vectors
Fig. 2.
Fig. 2.
GNNHap analysis correctly identifies a genetic factor contributing to agenesis of the CC. (A) CC length measurements made at the mid-sagittal plane in 21 inbred strains (MPD: 10806) indicate that the CC is absent in BTBR mice. (B) The graphical output of the GNNHap analysis of this dataset is shown, and it identified Draxin as one of the two most likely candidate genes. (C) The GNNHap data that was evaluated for 10 genes with the strongest genetic association with CC dimensions are shown. The chromosome (Chr) and the starting (chrStart) and ending (chrEnd) position of each haplotype block are also shown. The unique color of the square within the haplotype diagram indicates that only the first five genes have a BTBR-unique haplotype. The popPvalue, which assesses the relationship of the alleles in the candidate gene with population structure, was calculated as described in Wang et al. (2021). The alleles in the Draxin haplotype blocks are not associated with population structure, while the Parp10 alleles are. PubMed identification numbers are only provided if a MeSH term and gene have a direct link in the literature graph. However, the literature analyses (MeSH term: Corpus Callosum, D002386) reveal that only Draxin has a direct association with the CC. In contrast, all the other candidate genes have an indirect relationship with this MeSH term, which could result from MeSH term relationships identified with other proteins that are associated with these candidates
Fig. 3.
Fig. 3.
NZW/LacJ, TallyHo, MOLF and SPRET mice produce a non-functional Tlr5 protein. (A) The monocyte counts measured in 30 inbred strains are shown (MPD: 24317), and NZW/LacJ mice have the highest value among the analyzed strains. (B) The graph output by the GNNHap analysis of this dataset is shown. It identified Tlr5 and Krtap5-1 as the two candidate genes with high impact alleles that had the strongest genetic association with the phenotypic pattern. Multiple haplotype blocks within Tlr5 and Krtap5-1 had NZW/LacJ-specific haplotypes. (C) The GNNHap data evaluated for the top-ranked candidate genes are shown. The literature analyses (MeSH term: Monocytes, D009000) of these candidate genes revealed that only Tlr5 had a direct association with monocytes. (D) NZW/LacJ, TallyHo, MOLF and SPRET mice have a 1-bp frameshift deletion (rs223247201) in Exon 4 of Tlr5 that is not present in the 49 other strains with available genomic sequence. (E) This deletion generates a termination codon after amino acid 7 of the Tlr5 protein. The protein domains present in the full length (C57BL/6) and truncated (NZW/LacJ, TallyHo, MOLF and SPRET) Tlr5 proteins are shown
Fig. 4.
Fig. 4.
A frameshift indel generates a non-functional Nid1 protein in PL/J mice. (A) Eye examinations performed on 41 inbred strains (MPD: 26710) show that PL/J mice have a high incidence (∼50%) of corneal opacities. (B) The graphical output of the GNNHap analysis of this dataset is shown. For this analysis, GNNHap was set to analyze candidate genes with high impact indels, and Nid1 was identified as one of the three highest ranked candidate genes. (C) The data evaluated by GNNHap for 10 genes with the strongest genetic association are shown. The chromosome (Chr) and the starting (chrStart) and ending (chrEnd) positions of each haplotype block are also shown. The popPvalue assesses the relationship of the alleles in the candidate gene with population structure, which is calculated as described in Wang et al. (2021), and PubMed identification numbers are only provided if the MeSH term and gene have a direct link in the literature graph. The unique color of the square on the right in the haplotype diagram indicates that all these candidate genes have a PL/J-unique haplotype with a high impact allele (codon flag: 2). However, only two have an allelic pattern that is not associated with population structure (Nid1, Trappc1), and the literature analysis reveals that only Nid1 has a direct association with cataract (MeSH term: D002386). In contrast, the relationship of all other candidate genes with cataract was indirect, which could result from other proteins that are associated with these candidate genes. (D) PL/J has a 1-bp frameshift deletion in Exon 3 of Nid1, which is not present in the 52 other strains with available genomic sequence. (E) This frameshift deletion generates a termination codon after amino acid 279 of the PL/J Nid1 protein. The protein domains present in full length (C57BL/6) and PL/J Nid1 proteins are indicated
Fig. 5.
Fig. 5.
NON/ShiLtJ mice produce a non-functional Ring1 protein. (A) The expiratory flow measurements for 27 inbred strains obtained after inhalational methacholine challenge (10 mg/ml) (MPD: 35130) are shown. NON/ShiLtJ mice had the highest expiratory measurement, which was twice the average of the other strains. (B) The graph output by the GNNHap analysis of this dataset identified Ring1 as one of the top candidate genes. The dot color indicates whether the gene has a SNP allele that causes a low, medium or high impact change. (C) The GNNHap data for 11 genes with the strongest genetic association are shown. The unique color of the square in the haplotype diagram indicates that they all have a NON/ShiLtJ-unique haplotype. However, only five have a high impact allele (codon flag: 2), and only two have an allelic pattern that is not associated with population structure (Nid1, Trappc1). The literature analysis (MeSH term: Cataract, D002386) reveals that only Nid1 has a direct association with cataract. In contrast, the relationship of all other candidate genes with cataract was indirect, which could result from other proteins that are associated with those candidate genes. (D) NON/ShiLtJ mice have a 1-bp deletion in exon 4 of Ring1 (within amino acid 90) that is not present in 52 other strains with available genomic sequence. (E) This deletion generates a termination codon after amino acid 106. The protein domains present in the full length (C57BL/6) and NON/ShiLtJ (NON) Ring1 proteins are shown

References

    1. Agrawal S. et al. (2003) Cutting edge: different Toll-like receptor agonists instruct dendritic cells to induce distinct Th responses via differential modulation of extracellular signal-regulated kinase-mitogen-activated protein kinase and c-Fos. J. Immunol., 171, 4984–4989. - PubMed
    1. Alley E.C. et al. (2019) Unified rational protein engineering with sequence-based deep representation learning. Nat. Methods, 16, 1315–1322. - PMC - PubMed
    1. Arslan A. et al. (2020) High throughput computational mouse genetic analysis. BioRxiv. https://www.biorxiv.org/content/10.1101/2020.09.01.278465v2. - DOI
    1. Arslan A. et al. (2022) Analysis of structural variation among inbred mouse strains identifies genetic factors for autism-related traits. BioRxiv. https://www.biorxiv.org/content/10.1101/2021.02.18.431863v1. - DOI
    1. Bera K. et al. (2022) Predicting cancer outcomes with radiomics and artificial intelligence in radiology. Nat. Rev. Clin. Oncol., 19, 132–146. - PMC - PubMed

Publication types