

Foodborne Illness Outbreaks Reported to National Surveillance, United States, 2009-2018
- PMID: 35608555
- PMCID: PMC9155876
- DOI: 10.3201/eid2806.211555
Foodborne Illness Outbreaks Reported to National Surveillance, United States, 2009-2018
Abstract
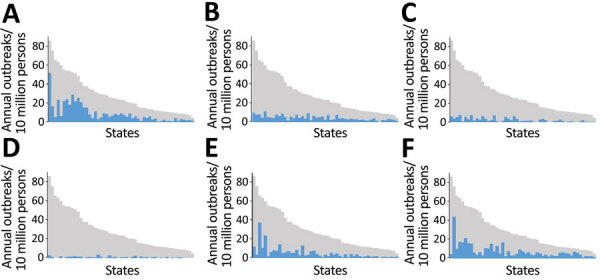
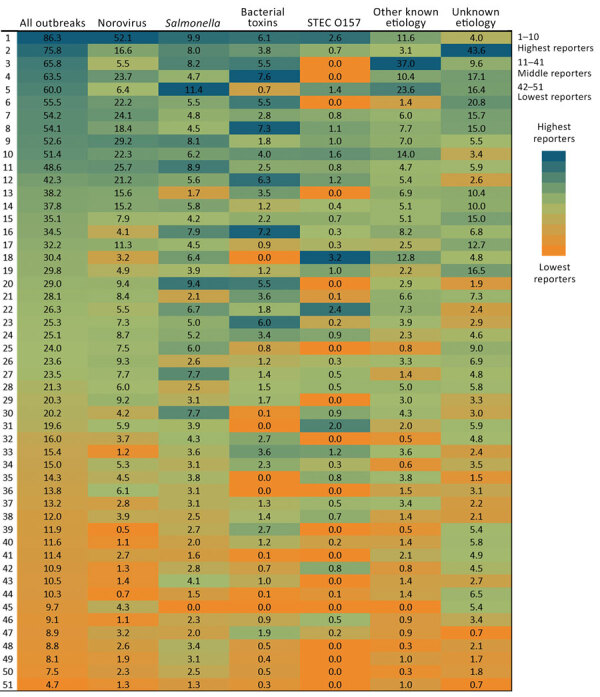
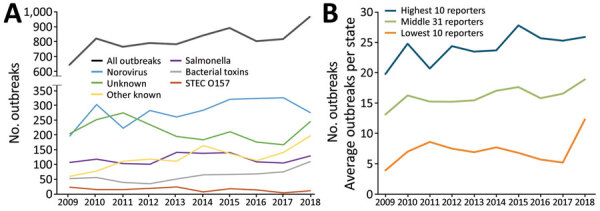
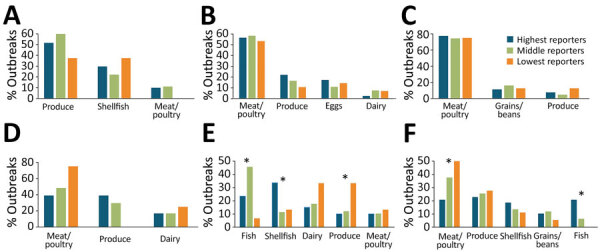
Foodborne outbreaks reported to national surveillance systems represent a subset of all outbreaks in the United States; not all outbreaks are detected, investigated, and reported. We described the structural factors and outbreak characteristics of outbreaks reported during 2009-2018. We categorized states (plus DC) as high (highest quintile), middle (middle 3 quintiles), or low (lowest quintile) reporters on the basis of the number of reported outbreaks per 10 million population. Analysis revealed considerable variation across states in the number and types of foodborne outbreaks reported. High-reporting states reported 4 times more outbreaks than low reporters. Low reporters were more likely than high reporters to report larger outbreaks and less likely to implicate a setting or food vehicle; however, we did not observe a significant difference in the types of food vehicles identified. Per capita funding was strongly associated with increased reporting. Investments in public health programming have a measurable effect on outbreak reporting.
Keywords: Salmonella; Shiga toxin–producing Escherichia coli; United States; bacteria; enteric infections; food safety; foodborne diseases; infectious disease outbreaks; norovirus; public health surveillance; viruses.
Figures
References
-
- Interagency Food Safety Analytics Collaboration. Foodborne illness source attribution estimates for Salmonella, Escherichia coli O157, Listeria monocytogenes, and Campylobacter using multi-year outbreak surveillance data, United States. Atlanta and Washington: US Department of Health and Human Services; 2020.
-
- Katz R. State foodborne illness reporting laws, 2011–2013. Inter-university Consortium for Political and Social Research. 2014. [cited 2022 Apr 15]. https://www.icpsr.umich.edu/web/HMCA/studies/34935
-
- Keene BK, Kanwat CP. Enteric disease outbreak investigation and surveillance survey. Presented at: Council for State and Territorial Epidemiologists 2007 Annual Conference; June 24–28, 2007; Atlantic City, NJ, USA.
Publication types
MeSH terms
LinkOut - more resources
Full Text Sources
Medical
Molecular Biology Databases
