. 2022 Jul 8;7(13):e159832.
doi: 10.1172/jci.insight.159832.

IL-13-programmed airway tuft cells produce PGE2, which promotes CFTR-dependent mucociliary function

Affiliations

IL-13-programmed airway tuft cells produce PGE2, which promotes CFTR-dependent mucociliary function

Maya E Kotas et al. JCI Insight. .

Abstract

Chronic type 2 (T2) inflammatory diseases of the respiratory tract are characterized by mucus overproduction and disordered mucociliary function, which are largely attributed to the effects of IL-13 on common epithelial cell types (mucus secretory and ciliated cells). The role of rare cells in airway T2 inflammation is less clear, though tuft cells have been shown to be critical in the initiation of T2 immunity in the intestine. Using bulk and single-cell RNA sequencing of airway epithelium and mouse modeling, we found that IL-13 expanded and programmed airway tuft cells toward eicosanoid metabolism and that tuft cell deficiency led to a reduction in airway prostaglandin E2 (PGE2) concentration. Allergic airway epithelia bore a signature of PGE2 activation, and PGE2 activation led to cystic fibrosis transmembrane receptor-dependent ion and fluid secretion and accelerated mucociliary transport. These data reveal a role for tuft cells in regulating epithelial mucociliary function in the allergic airway.

Keywords: Allergy; Chloride channels; Eicosanoids; Inflammation; Pulmonology.


Figures

Figure 1
Figure 1. Single-cell sequencing reveals expansion and allergic activation of tuft cells in nasal polyps.
(A) Uniform manifold approximation and projection (UMAP) of scRNA-Seq of epithelial cells from healthy ethmoid sinus (control; n = 4) or nasal polyp (n = 5) (total cells = 116,358) reveals 10 cell types. (B) Expanded view of inset in A showing tuft cells and ionocytes identified by hierarchical subclustering. (C) Expression of tuft cell and ionocyte marker genes in tuft and ionocyte subclusters. (D) Percentage of ionocytes and tuft cells among total epithelial cells in control or polyp. Error bars indicate mean ± SEM. *P < 0.05 by Mann-Whitney t test with correction for multiple comparisons. (E) RNA in situ hybridization for POU2F3 (red) and immunofluorescence for E-cadherin (shown in green) identifies increased numbers of tuft cells (arrow) in nasal polyp epithelium as compared with control ethmoid (representative of 3 samples from 3 patients of each type). Scale bars: 60 μm. (F) Shared tuft cell marker genes (“common markers”) and differentially expressed genes (DEGs) (“polyp tuft markers”) in tuft (dark orange) and nontuft cells (light orange) from control (light purple) and polyp (dark purple) epithelium. Expression of representative (G) common tuft cell marker POU2F3 and polyp tuft markers (H) ALOX5 and (I) PTGS1.
Figure 2
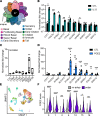
Figure 2. Pan-epithelial gene signatures in nasal polyps are imparted by IL-13 and prostaglandin E2.
(A) Among all DEGs for each cell type, 87 genes were upregulated in at least 9 cell types in polyp epithelium compared with controls and defined as pan-epithelial. (B) Fold change in normalized gene expression for tracheal epithelial cells cultured at air liquid interface (ALI) and stimulated with IL-13 (n = 10 wells from 6 donors, *P < 0.05; **P < 0.01 by ANOVA with Tukey correction). (C) Fold change in normalized SLC6A8 gene expression in human tracheal epithelial cells cultured at ALI and stimulated with indicated eicosanoids (n = 9 donors, **P < 0.01 by ANOVA with Dunnett’s correction). Represents similar responses for all genes as shown in D. (D) Fold change in normalized gene expression for tracheal epithelial cells cultured at ALI and stimulated with prostaglandin E2 (PGE2) (n = 10 wells from 6 donors, **P < 0.01; ***P < 0.001; ****P < 0.0001 by ANOVA with Tukey correction). (E) UMAP of scRNA-Seq data from surgical sinus tissue of participants with CRSwNP (“polyp”) or patients with CRS without nasal polyps (CRSsNP) (“no polyp”) whole polyp or nonpolyp sinus tissue (16). Epithelial clusters encircled with dashed line. (F) PGE2 response gene score in polyp and nonpolyp epithelial clusters. *P < 0.05; **P < 0.01; ****P < 0.0001 by linear mixed model. Statistical calculations relating to this figure are included in Supplemental Table 7. For B and D, data shown as mean ± SEM. For C, horizontal line shows mean with bars indicating range.
Figure 3
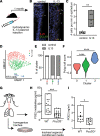
Figure 3. IL-13 expands and programs airway tuft cells toward PGE2 production.
(A) T2 inflammatory mouse model system. (B) Representative sections of mouse nasal epithelium after 1 month of IL-13 overexpression or IgG control. Stars mark dual staining IL-25+ and DCLK1+ tuft cells. Bar indicates 50 μm. (C) Quantification of tuft cells in nasal epithelium in control and systemic IL-13 expression. **P < 0.01 by t test. (D) Subclustering of tuft cells from control or IL-13–overexpressing mouse nasal epithelium. (E) Percentage of tuft cells derived from control or systemic IL-13 conditions in each subcluster in D. (F) Human polyp allergic tuft cell gene score in mouse nasal epithelial tuft cell subclusters. ****P < 0.0001 by linear regression model. (G) Schematic of protocol to measure (H) PGE2 metabolites (PGEMs) in whole tracheal tissue from WT or Pou2f3–/– mice exposed to systemic IL-13 or (I) PGE2 in media from tracheal organoids derived from WT or Pou2f3–/– mice. (H and I) *P < 0.05; ***P < 0.001 by t test. For C, H, and I, line is at mean and bars indicate max/min (range).
Figure 4
Figure 4. Tuft cell and PGE2 activation are common features of upper and lower allergic airway disease.
(A) T2 (3 gene) score, (B) polyp tuft score, and (C) PGE2 score in RNA-sequenced bulk epithelial brushings from sinus tissue of control patients (light purple) or patients with CRS without asthma or nasal polyps (“CRSsNP”; gray) or CRS with asthma and nasal polyps (“Polyp,” dark purple). (D) Correlation between PGE2 score and polyp tuft cell score in sinus. (E) Correlation between PGE2 score and T2 score in sinus. (AE) n = 8 control, n = 7 CRSsNP, n = 24 polyp participants, as in Supplemental Table 1. (F) Polyp tuft score and (G) PGE2 score in RNA sequencing of bulk epithelial brushings of the bronchus of healthy participants or asthmatic participants classified as either T2 low or T2 high. (F and G) n = 16 healthy, n = 8 T2 low, n = 11 T2 high. For AC, F, and G, bars represent 25th–75th percentiles with line at median, error bars indicating range, and whiskers extending from largest value (upper whisker) no farther than 1.5 × IQR from the hinge (where IQR is the distance between the first and third quartiles) to smallest value no farther than 1.5 × IQR (lower whisker).
Figure 5
Figure 5. PGE2 regulates epithelial CFTR-dependent fluid secretion and mucociliary transport.
(A) Human tracheal epithelial organoids cultured for 21 days in the absence or presence of daily stimulation with 1 μg/mL PGE2, or with PGE2 + EP2 inhibitor (EP2inh) or PGE2 + EP4 inhibitor (EP4inh). Original magnification, 20×; scale bar, 100 μm. representative of at least 2–3 wells per experiment in at least 4 independent experiments with different tracheal and sinus epithelial donors. (B) Diameter of organoids in A. Each dot represents 1 of 200 randomly selected organoids per well × 3 replicate wells per condition. Line indicates median diameter. ****P < 0.0001, ***P < 0.001, *P < 0.05, by 1-way ANOVA with Holm-Šidák correction. (C) Diameter of chronically PGE2-treated organoids as in A and B immediately after acute stimulation with PGE2 ± CFTR inhibitor 172 (CFTRinh). Value ± 95% CI at each time point represents 20 serially imaged organoids per condition. Representative of 2 independent experiments. ****P < 0.0001 by 2-way ANOVA. (D) Short-circuit current measured in human nasal epithelial cells at ALI after inhibition of epithelial sodium channel–dependent current with amiloride, followed by treatment with PGE2 or cAMP activation by forskolin/IBMX, then by CFTR inhibition, and finally by ATP-dependent activation. Donor-normalized quantification of short-circuit currents shown in right panel, with each dot representing treatment of an individual epithelial donor. **P < 0.01 by 2-way ANOVA. (E) Particle transport speed on the surface of tracheal epithelial cells cultured at ALI and stimulated with PGE2 ± CFTR inhibitor 172. Each dot represents 1 tracked particle on the surface of at least 3 replicate wells from each of 3 donors per condition. ****P < 0.0001 by 2-way ANOVA of log-transformed speeds. Line indicates mean.

Similar articles

Cited by

References

    1. Kristjansson RP, et al. A loss-of-function variant in ALOX15 protects against nasal polyps and chronic rhinosinusitis. Nat Genet. 2019;51(2):267–276. doi: 10.1038/s41588-018-0314-6. - DOI - PubMed
    1. Moffatt MF, et al. A large-scale, consortium-based genomewide association study of asthma. N Engl J Med. 2010;363(13):1211–1221. doi: 10.1056/NEJMoa0906312. - DOI - PMC - PubMed
    1. Jarvis D, et al. Asthma in adults and its association with chronic rhinosinusitis: the GA2LEN survey in Europe. Allergy. 2012;67(1):91–98. doi: 10.1111/j.1398-9995.2011.02709.x. - DOI - PubMed
    1. Jackson ND, et al. Single-cell and population transcriptomics reveal pan-epithelial remodeling in type 2-high asthma. Cell Rep. 2020;32(1):107872. doi: 10.1016/j.celrep.2020.107872. - DOI - PMC - PubMed
    1. Plasschaert LW, et al. A single-cell atlas of the airway epithelium reveals the CFTR-rich pulmonary ionocyte. Nature. 2018;560(7718):377–381. doi: 10.1038/s41586-018-0394-6. - DOI - PMC - PubMed

Publication types

Substances