. 2022 Jul 1;132(13):e158047.
doi: 10.1172/JCI158047.

Donor T cell DNMT3a regulates alloreactivity in mouse models of hematopoietic stem cell transplantation

Affiliations

Donor T cell DNMT3a regulates alloreactivity in mouse models of hematopoietic stem cell transplantation

Yiouli P Ktena et al. J Clin Invest. .

Abstract

DNA methyltransferase 3a (DNMT3a) is an important part of the epigenetic machinery that stabilizes patterns of activated T cell responses. We hypothesized that donor T cell DNMT3a regulates alloreactivity after allogeneic blood and marrow transplantation (allo-BMT). T cell conditional Dnmt3a KO mice were used as donors in allo-BMT models. Mice receiving allo-BMT from KO donors developed severe acute graft-versus-host disease (aGVHD), with increases in inflammatory cytokine levels and organ histopathology scores. KO T cells migrated and proliferated in secondary lymphoid organs earlier and demonstrated an advantage in trafficking to the small intestine. Donor T cell subsets were purified after BMT for whole-genome bisulfite sequencing (WGBS) and RNA-Seq. KO T cells had global methylation similar to that of WT cells, with distinct, localized areas of hypomethylation. Using a highly sensitive computational method, we produced a comprehensive profile of the altered epigenome landscape. Hypomethylation corresponded with changes in gene expression in several pathways of T cell signaling and differentiation. Additionally, Dnmt3a-KO T cells resulted in superior graft-versus-tumor activity. Our findings demonstrate a critical role for DNMT3a in regulating T cell alloreactivity and reveal pathways that control T cell tolerance. These results also provide a platform for deciphering clinical data that associate donor DNMT3a mutations with increased GVHD, decreased relapse, and improved survival.

Keywords: Bone marrow transplantation; Cellular immune response; Epigenetics; Transplantation.


Figures

Figure 1
Figure 1. DNMT3a-deficient T cells result in accelerated experimental aGVHD.
Lethally irradiated recipients received BMT from syngeneic (Syn), allogeneic WT (Allo-WT), or Dnmt3a-KO donors (Allo-KO). Haploidentical B6→F1 model: (A) overall survival, (B) clinical GVHD score, (C) survival in the absence of T cells and with T cell–depleted BM only. Data from 3 experiments; Syn n = 15, Allo n = 28 each. (D) Histopathological organ-specific GVHD scores on day +7; n = 4–5 per group. (E) Serum cytokine levels by multiplex bead assay on day +7. Data from 3 experiments; Syn n = 8, Allo n = 17 each. (F) BM cellularity, T cell chimerism, and peripheral blood counts on day +14; n = 4–5 per group. (G) Fully mismatched B6→BALB/cJ model. Left to right: Survival, clinical GVHD score, weight loss. Data from 2 experiments; Syn n = 10, Allo n = 20 each. *P < 0.05, **P < 0.01, ***P < 0.001, ****P < 0.0001, Mann-Whitney U test, Mantel-Cox log-rank test for survival data. ALC, absolute lymphocyte count; ANC, absolute neutrophil count; Hb, hemoglobin; Plt, platelets.
Figure 2
Figure 2. DNMT3a loss in CD8+ T cells is sufficient to result in increased GVHD.
(AC) Survival in mixing experiments wherein CD4+ and CD8+ WT and KO T cells were separately isolated and coinjected at a CD4/CD8 ratio of 2:1 in various combinations. Data from 2 experiments; Syn, WT, KO n = 8 each, mixed groups n = 16 each. (D) Survival in the B6→Bm1 model in which donor and recipient differ only in MHC I and graft contains solely CD8+ T cells. Data from 2 experiments; Syn n = 9, Allo n = 16 each. (E) Histopathological organ-specific GVHD scores in the B6→Bm1 model on day +7; n = 5 per group. (F) B6→Bm12 model in which donor and recipient differ only in MHC II and graft contains solely CD4+ T cells: survival at a TBI dose of 11 Gy. Data from 2 experiments, syn n = 10, allo n = 19 each. (G) B6→Bm12 with a TBI dose of 9 Gy: survival and clinical GVHD score. Note that all three groups maintained 100% survival. (H) Histopathological GVHD scores. Data from 2 experiments; Syn n = 9, Allo n = 14 each. *P < 0.05, **P < 0.01, ****P < 0.0001, Mann-Whitney U test, Mantel-Cox log-rank test for survival.
Figure 3
Figure 3. Increased GVHD correlates with the emergence of a distinct CD4+CD8+ T cell population in recipients of Dnmt3a-KO T cells.
Flow cytometry of CD4 versus CD8 on splenic T cells, showing the marked expansion of the DP population on day +7 in the B6→F1 (A) and B6→Bm1 (B) models, but not in a B6→F1 model with BM only (C) or a syngeneic B6→B6 model with BMT from either WT or KO donors (D). TCD, T cell–depleted.
Figure 4
Figure 4. Loss of DNMT3a expression results in a trafficking advantage for donor T cells to SLOs.
Purified WT and KO B6 T cells were stained with CSFE and e450, respectively (and vice versa in replicate experiments) and were coadoptively transferred at a 1:1 ratio (3 × 10⁶ to 5 × 10⁶ cells each) into lethally irradiated allogeneic F1 animals. Spleen (A) and lymph node (not shown) flow cytometry was performed 24 and 48 hours later. Data from 2 experiments; n = 6 per time point per group. (B) On day +4, most cells lost the proliferation dye. WT and KO populations were distinguished via allelic differences between CD45.1/2 and CD90.1/2. Data from 2 experiments; n = 8 per group (except MLNs n = 5). (C) Serum chemokine levels by multiplex bead assay in the B6→F1 model on day +7. Data from 3 experiments; Syn n = 8, Allo n = 17 each. *P < 0.05, **P < 0.01, ***P < 0.001, Mann-Whitney U test or Mantel-Cox log-rank test for survival data.
Figure 5
Figure 5. Loss of DNMT3a results in distinct areas of localized genomic hypomethylation.
Splenic WT and KO CD4+, CD8+, and CD4+CD8+ T cells were isolated by flow cytometry on day +10 in the B6→F1 model, and underwent DNA and RNA extraction for WGBS and RNA-Seq. (A) Similar distribution of MMLs across all purified subsets. (B) Box plots of the JSD showing the comparison of KO and WT CD8+ T cell genomic features annotated by chromatin state and gene-regulatory function as an example. The JSD captures methylation discordance, whether due to dMMLs, methylation entropy, or other statistical factors (66). Differences localize over enhancer elements and promoters bearing bivalent marks. EnrichR analysis (90) of pathways enriched in the genes differentially methylated between experimental groups using the Mouse Gene Atlas (C) and KEGG 2021 Human databases (D). SP, single-positive. (E) The Ccr9 gene promoter as an example of a top-ranked differentially methylated region between DNMT3a WT and KO CD8+ T cells. The peak in JSD indicates differential methylation, and the negative peak in dMML indicates hypomethylation in the KO cells.
Figure 6
Figure 6. Areas of differential methylation correlate with changes in gene transcription.
(A) PCA of whole-genome transcriptomes from RNA-Seq samples; n = 4 per group. (B) Volcano plot (log10 P values vs. log2 fold changes in expression) of differentially expressed transcripts in KO vs. WT CD4+ T cells and (C) in KO vs. WT CD8+ cells. sig, significance. (D) Heatmap cluster of top-ranked differentially expressed genes between T cell subsets. Each column represents a biological replicate. (E) Representative GSEA enrichment plots of selected immune-related gene sets overrepresented in KO vs. WT CD8+ T cells derived from the MSigDB C7 database. adj., adjusted.
Figure 7
Figure 7. Alterations in methylome and transcriptome provide mechanistic clues for enhanced GVHD severity.
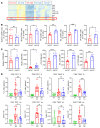
(A) Close-up view of the heatmap presented in Figure 6D. (B) CCR9 expression by flow cytometry in the migration experiments presented in Figure 4B. On day +4, most of the CCR9+ cells in the spleen are WT, while the cells that have started migrating toward the MLNs, PPs, IELs, and LP are mostly KO. Data from 2 experiments; n = 8 per group (except MLNs n = 5). (C) MFI of CCR9. (D) PD-1 and TIM3 expression on CD4+ and CD8+ cells on day +7 in the B6→F1 model (top row: percentage of splenic T cells; bottom row: absolute numbers). No differences were detected in LAG3 expression. Data from 2 different experiments; Syn n = 8, Allo n = 9 per group. *P < 0.05, **P < 0.01, ***P < 0.001, ****P < 0.0001, Mann-Whitney U test or Mantel-Cox log-rank test for survival data.
Figure 8
Figure 8. DNMT3a-KO T cells convey superior GVT effects.
P815 tumor cells (500 cells per animal) were added to the inoculum on day 0 using the B6→F1 model. Tumor burden was monitored by BLI as described in Methods. (A) BLI images. (B) Tumor-related deaths (C) Average and individual tumor burden represented as photons per second. Data show 1 of 2 replicate experiments; Syn n = 5, Allo n = 10 per group per experiment. *P < 0.05, **P < 0.01, ***P < 0.001, Mann-Whitney U test or Mantel-Cox log-rank test for survival data. Radiance, p/s/cm2/sr. Color scale: min, 4.00 × 10⁴; max, 7.00 × 10⁸.

Similar articles

Cited by

References

    1. Mary M. Horowitz. Thomas’ Hematopoietic Cell Transplantation: Stem Cell Transplantation. Fifth ed: Wiley; 2015:8–17.
    1. Barrett AJ. Understanding and harnessing the graft-versus-leukaemia effect. Br J Haematol. 2008;142(6):877–888. doi: 10.1111/j.1365-2141.2008.07260.x. - DOI - PubMed
    1. Auletta JJ, Cooke KR. Bone marrow transplantation: new approaches to immunosuppression and management of acute graft-versus-host disease. Curr Opin Pediatr. 2009;21(1):30–38. doi: 10.1097/MOP.0b013e3283207b2f. - DOI - PubMed
    1. Blazar BR, et al. Advances in graft-versus-host disease biology and therapy. Nat Rev Immunol. 2012;12(6):443–458. doi: 10.1038/nri3212. - DOI - PMC - PubMed
    1. Ferrara JL, et al. The pathophysiology of acute graft-versus-host disease. Int J Hematol. 2003;78(3):181–187. doi: 10.1007/BF02983793. - DOI - PubMed

Publication types