. 2022 Jul 1;132(13):e155350.
doi: 10.1172/JCI155350.

Specific in situ inflammatory states associate with progression to renal failure in lupus nephritis

Affiliations

Specific in situ inflammatory states associate with progression to renal failure in lupus nephritis

Rebecca Abraham et al. J Clin Invest. .

Abstract

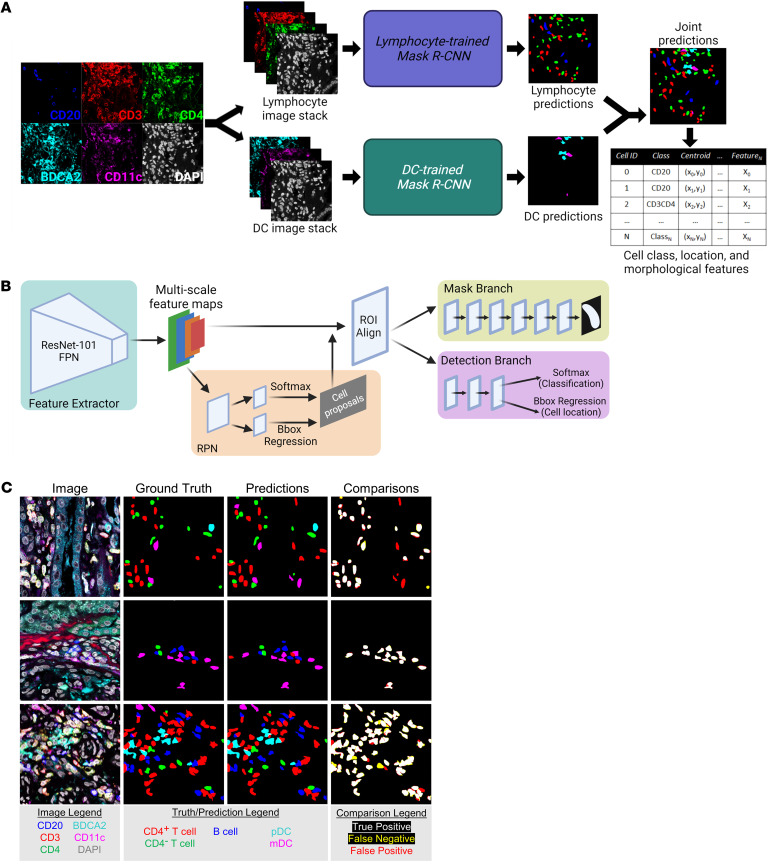
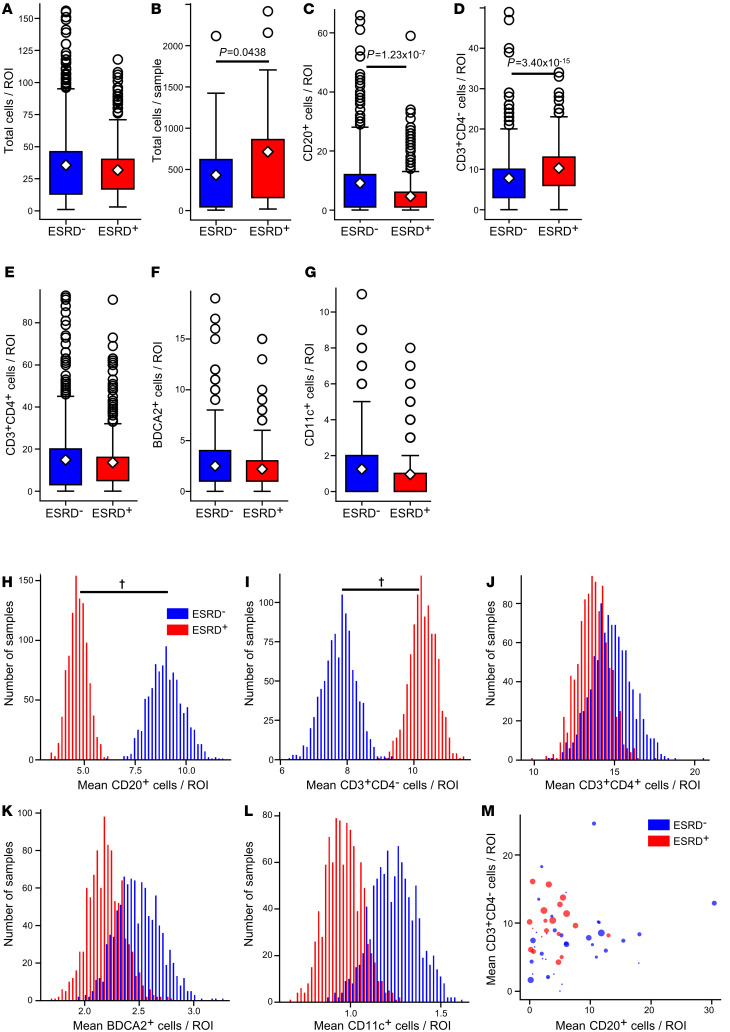
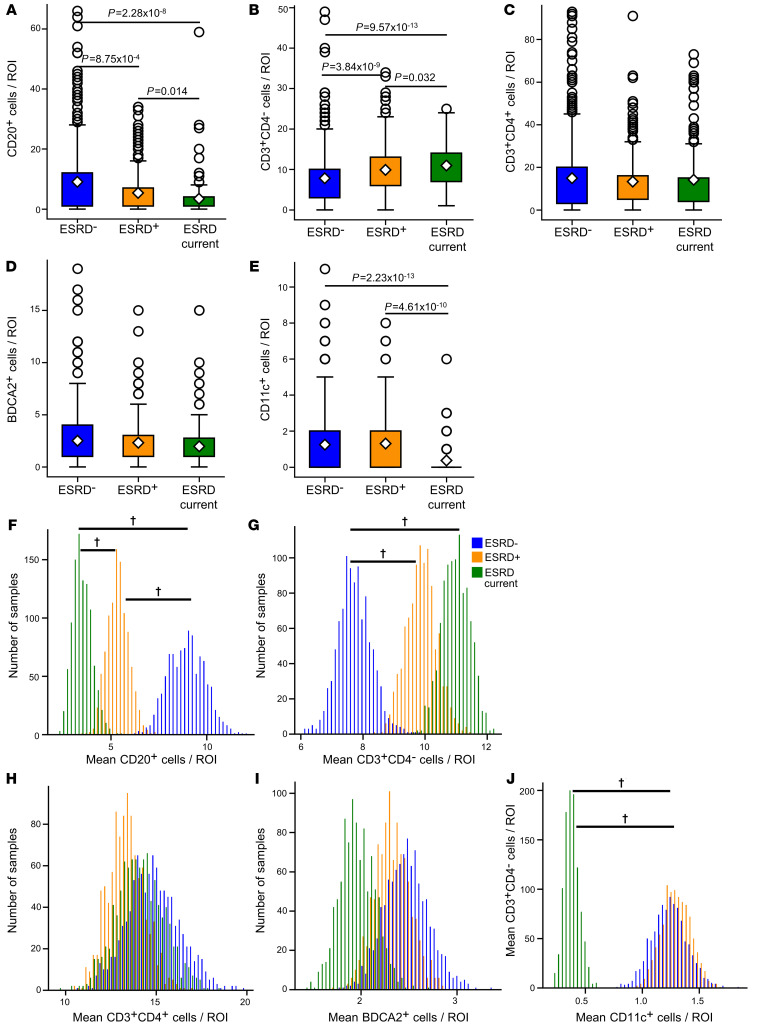
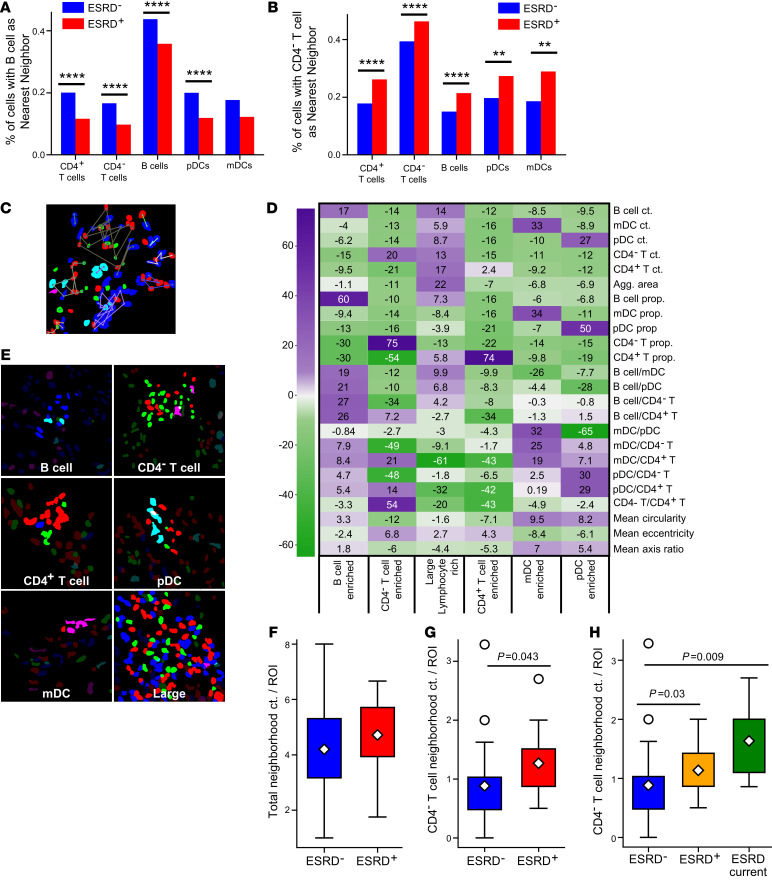
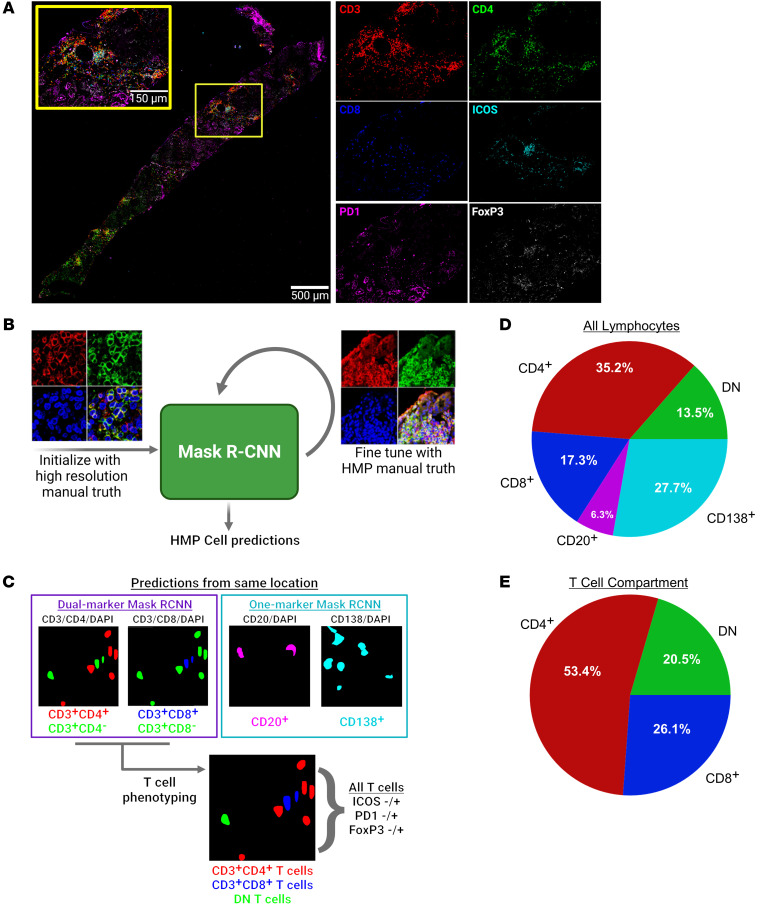
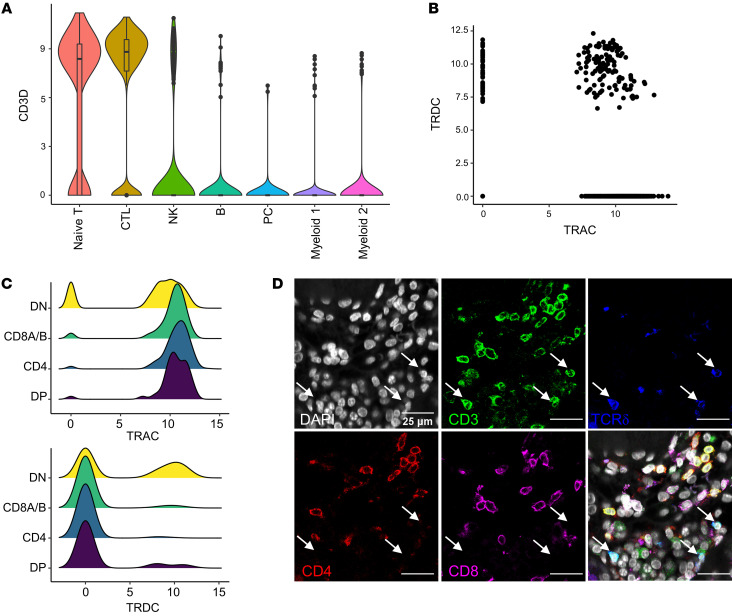
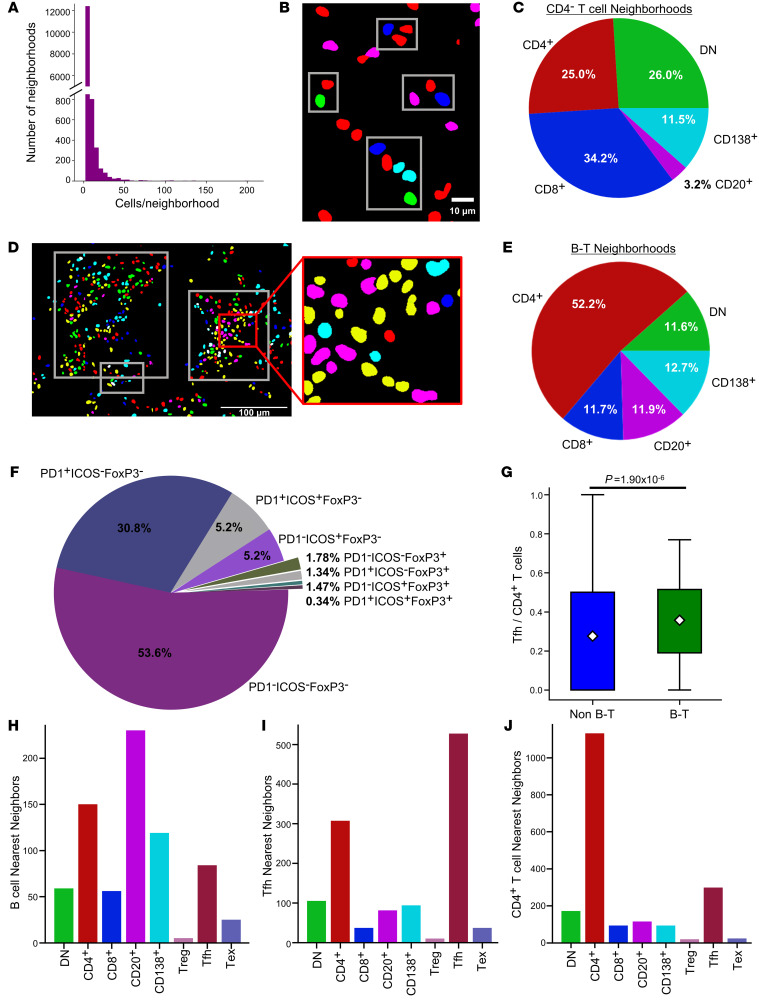
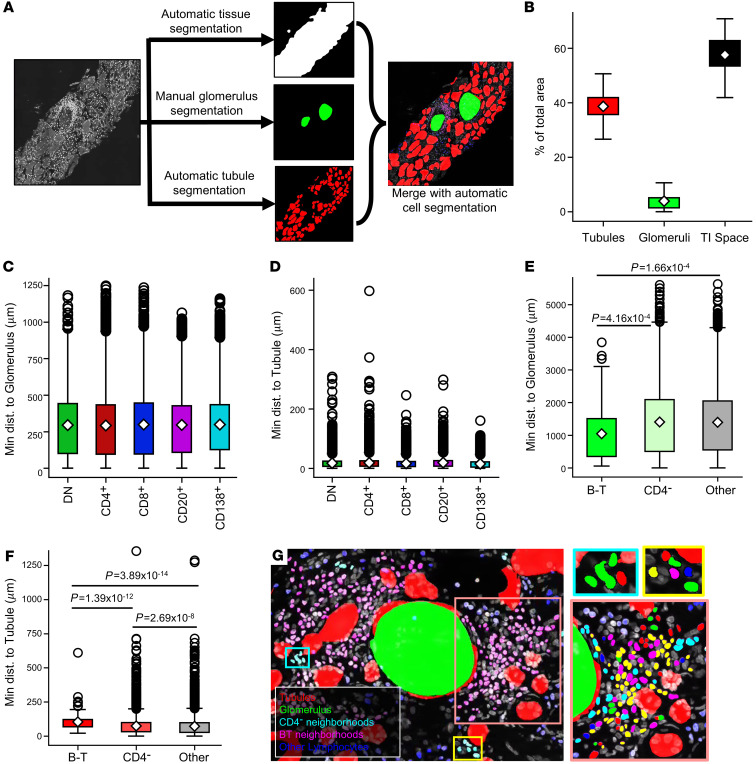
BACKGROUNDIn human lupus nephritis (LN), tubulointerstitial inflammation (TII) on biopsy predicts progression to end-stage renal disease (ESRD). However, only about half of patients with moderate-to-severe TII develop ESRD. We hypothesized that this heterogeneity in outcome reflects different underlying inflammatory states. Therefore, we interrogated renal biopsies from LN longitudinal and cross-sectional cohorts.METHODSData were acquired using conventional and highly multiplexed confocal microscopy. To accurately segment cells across whole biopsies, and to understand their spatial relationships, we developed computational pipelines by training and implementing several deep-learning models and other computer vision techniques.RESULTSHigh B cell densities were associated with protection from ESRD. In contrast, high densities of CD8+, γδ, and other CD4-CD8- T cells were associated with both acute renal failure and progression to ESRD. B cells were often organized into large periglomerular neighborhoods with Tfh cells, while CD4- T cells formed small neighborhoods in the tubulointerstitium, with frequency that predicted progression to ESRD.CONCLUSIONThese data reveal that specific in situ inflammatory states are associated with refractory and progressive renal disease.FUNDINGThis study was funded by the NIH Autoimmunity Centers of Excellence (AI082724), Department of Defense (LRI180083), Alliance for Lupus Research, and NIH awards (S10-OD025081, S10-RR021039, and P30-CA14599).

Keywords: Adaptive immunity; Autoimmunity; Lupus.


Conflict of interest statement

Conflict of interest: The authors have declared that no conflict of interest exists.

Figures

Figure 1
Figure 1. Instance segmentation of immune cells in high-resolution fluorescence microscopy images of LN kidney biopsies.
(A) Automatic instance segmentation of 5 immune cell classes was performed by combining predictions from 2 instances of Mask R-CNN: one trained to segment CD20+, CD3+CD4, and CD3+CD4+ lymphocytes and one trained to segment pDCs and mDCs. Cell location, class, and morphological features were calculated from joint predictions. (B) The Mask R-CNN architecture comprises a ResNet Feature Pyramid Network (FPN) backbone used for feature extraction, a region proposal network (RPN) used to generate cell proposals, and two parallel branches used for (a) semantic segmentation (mask branch) and (b) classification (softmax layer) and localization (bounding box [Bbox] regression) of cell proposals. (C) Representative segmentations produced by the multinetwork pipeline showed strong agreement with the expert-defined manual segmentations. Magnification for all images 63x (zoom factor 1.7). This figure was created with BioRender.com.
Figure 2
Figure 2. Higher CD4 T cell density and lower B cell density associated with progression to ESRD.
(A) Local cell density comparison for ESRD patients (n = 437 ROIs) and ESRD+ patients (n = 428) for all cells. (B) Total cells per patient grouped by ESRD status. Local cell density by cell class compared between ESRD and ESRD+ patient for (C) CD20+ cells, (D) CD3+CD4 cells, (E) CD3+CD4+ cells, (F) BDCA2+ cells, and (G) CD11c+ cells. For all box plots, the population mean is represented by a white diamond, and quartile ranges are defined by the whisker boundaries and upper and lower box boundaries. Outliers are represented as open circles. All cell density comparisons were done with a Mann-Whitney U test with a Bonferroni’s correction for multiple comparisons, with significant P values noted. Bootstrapped sample means of ESRD (blue) and ESRD+ (red), ROIs for (H) CD20+ cells/ROI, (I) CD3+CD4 cells/ROI, (J) CD3+CD4+ cells/ROI, (K) BDCA2+ cells/ROI, and (L) CD11c+ cells/ROI. (M) Average B cell and CD4 T cell count per ROI for each patient biopsy. Point size is weighted by the TI chronicity score for each patient. 95% confidence interval does not overlap with 0.
Figure 3
Figure 3. Local cell densities are associated with progressively worse renal outcomes.
Local cell density compared across ESRD patients (n = 437 ROIs), ESRD+ patients (n = 266), and ESRD current patients (n = 162) for (A) CD20+ cells, (B) CD3+CD4 cells, (C) CD3+CD4+ cells, (D) BDCA2+ cells, and (E) CD11c+ cells. For all box plots, the population mean is represented by a white diamond, and quartile ranges are defined by the whisker boundaries and upper and lower box boundaries. Outliers are represented as open circles. All cell density comparisons were done with a Mann-Whitney U test with a Bonferroni’s correction for multiple comparisons, with significant P values noted. Bootstrapped sample means of ESRD (blue), ESRD+ (orange), and ESRD current (green) ROIs for (F) CD20+ cells/ROI, (G) CD3+CD4 cells/ROI, (H) CD3+CD4+ cells/ROI, (I) BDCA2+ cells/ROI, and (J) CD11c+ cells/ROI. 95% confidence interval does not overlap with 0. The data set analyzed in this figure is the same as the data set introduced in Figure 2.
Figure 4
Figure 4. Specific cellular neighborhoods associated with renal failure.
Proportions of cells that have (A) CD20+ B cells and (B) CD4 T cells as nearest neighbors in ESRD+ and ESRD patients (χ2 test for independence with Bonferroni’s correction for multiple comparisons). (C) Neighborhoods of automatically detected cells were detected by DBSCAN. Automatic cell segmentations and representative neighborhoods (highlighted in E) are shown for images taken at 63x magnification with a zoom factor of 1.7. (D) Heatmap showing test statistics for each feature from leave-one-out t tests used to define 6 types of cell neighborhoods, colored by the magnitude of the test statistic. (E) Representative neighborhoods from each defined class. (F and G) The abundance of neighborhoods between the patient cohorts, normalized by the number of ROIs per patient, was compared by Mann-Whitney U test with a Bonferroni’s correction for (F) all cell neighborhoods and (G) CD4 T cell neighborhoods. A 3-group comparison for CD4 neighborhoods, splitting the ESRD+ population into ESRD+ and ESRD current patients is shown in H. Significant P values after correcting for multiple comparisons are noted. The data set analyzed in this figure is the same as the data set introduced in Figure 2. For all box plots, the population mean is represented by a white diamond, and quartile ranges are defined by the whisker boundaries and upper and lower box boundaries. Outliers are represented as open circles.
Figure 5
Figure 5. Cell detection, segmentation, and phenotyping in highly multiplexed fluorescence microscopy images.
(A) Representative composite of a full biopsy section, shown with merged and with isolated panels of CD3, CD4, CD8, ICOS, PD1, and FoxP3. Scale bar: 150 μm; 500 μm (inset). (B) Schematic of procedure for training and fine-tuning a Mask R-CNN for instance segmentation of cells in highly multiplexed microscopy images. High resolution, 63x, zoom factor=1.7 (left); multiplexing image: 63x, zoom factor=1 (right). (C) Dual-marker and single-marker cell predictions are used to establish base lymphocyte classes. All T cell predictions are further described by ICOS, PD1, and FoxP3 expression. (D) Breakdown of frequencies of the 5-base classes in the HMP data set. (E) Frequencies of CD4+, DN, and CD8+ T cells within the T cell compartment. Images in AC were created with BioRender.com.
Figure 6
Figure 6. Identifying γδ T cells in LN.
(A) Distribution of CD3D in cell clusters identified in scRNA-Seq data from LN kidney samples. (B) Expression of TRAC and TRDC in T cells identified in scRNA-Seq data. (C) Comparison of TRAC and TRDC expression in identified double-negative (DN), CD8+, CD4+, and double-positive (DP) T cells. (D) Representative image of DN (CD4CD8) γδ (TCRd+) T cells in LN biopsy, marked by white arrows. Scale bar: 25 μm.
Figure 7
Figure 7. Identification of distinct CD4 and B-T neighborhoods.
(A) Distribution of sizes of all cell neighborhoods in the HMP data set. (B) Representative CD4 clusters (red, CD4+ T cells; blue, CD8+ T cells; green, DN T cells). Scale bar: 10 μm. (C) Distribution of the 5 main lymphocyte classes in the CD4 T cell neighborhoods. (D) Representative B-T aggregates (outlined by white boxes) (green, DN; red, non-Tfh CD4+; yellow, Tfh; blue, CD8+; magenta, CD20+; cyan, CD138+ cells). Scale bar: 100 μm. (E) Distribution of the 5-base classes of lymphocytes in B-T neighborhoods. (F) Distribution of CD4+ T cell phenotypes in B-T neighborhoods. (G) Comparison of proportion of CD4+ T cells that are Tfh cells in identified B-T aggregates and non B-T aggregates (Mann-Whitney U Test, P = 1.9 × 10⁻⁶). The population mean is represented by a white diamond, and quartile ranges are defined by the whisker boundaries and upper and lower box boundaries. Outliers are represented as open circles. The nearest neighbors of (H) CD20+ B cells, (I) Tfh cells, and (J) CD4+ T cells within B-T aggregates. The data set analyzed in this figure is the same as the data set introduced in Figure 5.
Figure 8
Figure 8. Structural segmentation reveals B-T neighborhood proximity to glomeruli.
(A) Structural segmentation of biopsies required 3 steps: (a) automatic segmentation of the tissue in the composite was accomplished through filtering and thresholding the DAPI channel, (b) glomeruli were hand-segmented on the DAPI channel of each biopsy, and (c) a U-Net was trained to segment tubular structures (including both tubules and blood vessels) in 512 × 512 DAPI tiles. Structural segmentations were merged with the coordinate space of the detected lymphocytes to calculate proximity to kidney structures (magnification 63x, zoom factor 1 in A and G). (B) The TI space was the largest compartment, followed by tubular structures and then glomeruli. (C) Lymphocyte proximity to glomeruli varies slightly across detected classes. (D) Minimum distance of detected lymphocytes to a tubule segmentation also varies across class. Means and P values for all 2-way comparisons in C and D are reported in Supplemental Tables 4 and 5. (E) B-T neighborhoods were significantly closer to glomeruli than all other neighborhood classifications. (F) Conversely, B-T neighborhoods were significantly farther from tubular structures than all other aggregates. CD4 neighborhoods were also significantly farther from tubules than all other non–B-T neighborhoods. The population mean is represented by a white diamond, and quartile ranges are defined by the whisker boundaries and upper and lower box boundaries. Outliers are represented as open circles. (E and F) Significant P values (P < 0.05) are noted on plots (Mann-Whitney U test with Bonferroni’s correction). (G) Representative B-T and CD4 neighborhoods and cell constituents (for zoom panels at right, green, DN T cells; red, non-Tfh CD4+ T cells; blue, CD8+ T cells; magenta, CD20+ cells; cyan, CD138+ cells; yellow, Tfh cells). The data set analyzed in this figure is the same as the data set introduced in Figure 5.

Comment in

Similar articles

Cited by

References

    1. Tan EM, Kunkel HG. Characteristics of a soluble nuclear antigen precipitation with sera of patients with systemic lupus erythematosus. J Immunol. 1966;96(3):464–471. - PubMed
    1. Dubois EL, ed. Lupus Erythematosus. 2 ed. W.B Saunders; 1974.
    1. Mohan C, Putterman C. Genetics and pathogenesis of systemic lupus erythematosus and lupus nephritis. Nat Rev Nephrol. 2015;11(6):329–341. doi: 10.1038/nrneph.2015.33. - DOI - PubMed
    1. McGaha TL, Madaio MP. Lupus nephritis: animal modeling of a complex disease syndrome pathology. Drug Discov Today Dis Models. 2014;11:13–18. doi: 10.1016/j.ddmod.2014.08.002. - DOI - PMC - PubMed
    1. Markowitz G, D’Agati VD. Classification of lupus nephritis. Curr Opin Nephrol Hypertens. 2009;18(3):220–225. doi: 10.1097/MNH.0b013e328327b379. - DOI - PubMed

Publication types