. 2022 Sep 12;73(16):5414-5427.
doi: 10.1093/jxb/erac234.

Asymmetric wall ingrowth deposition in Arabidopsis phloem parenchyma transfer cells is tightly associated with sieve elements

Affiliations

Asymmetric wall ingrowth deposition in Arabidopsis phloem parenchyma transfer cells is tightly associated with sieve elements

Xiaoyang Wei et al. J Exp Bot. .

Abstract

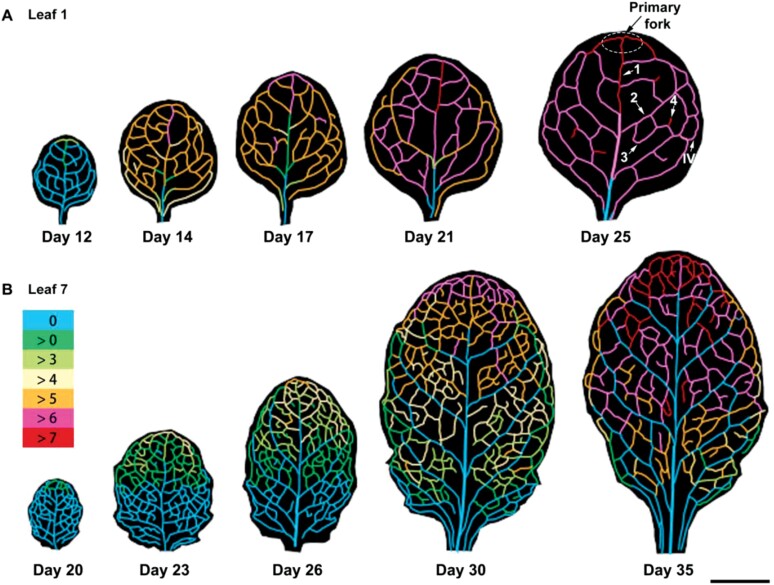
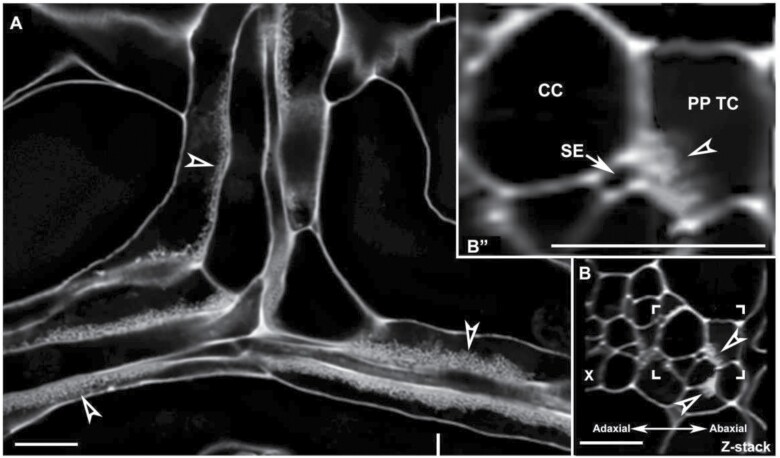
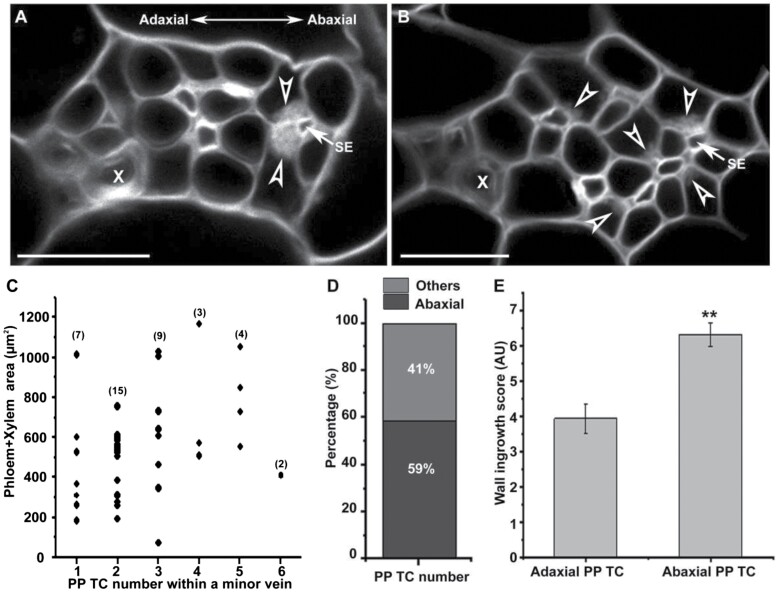
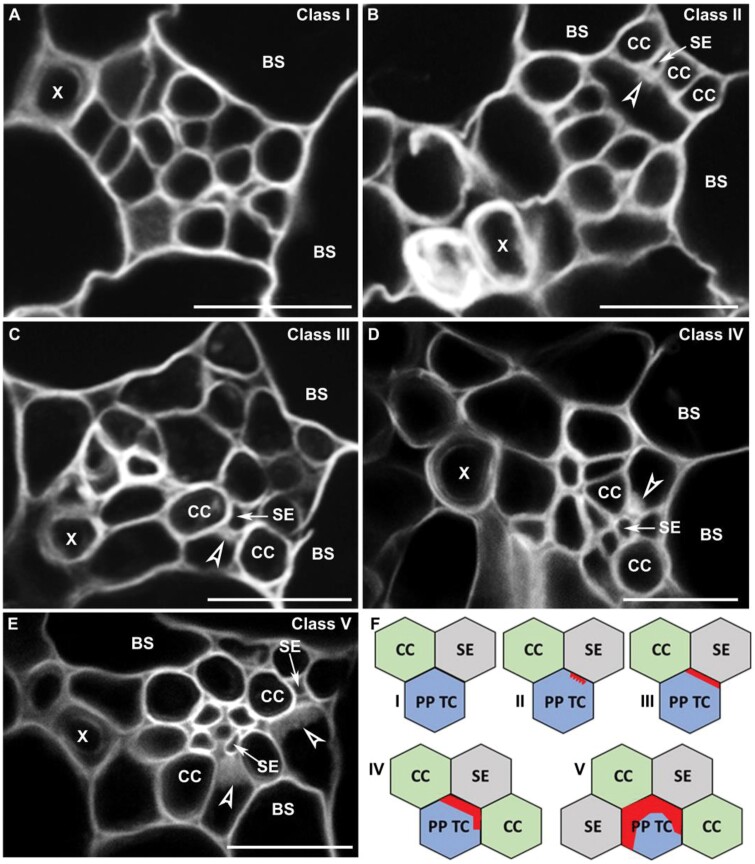
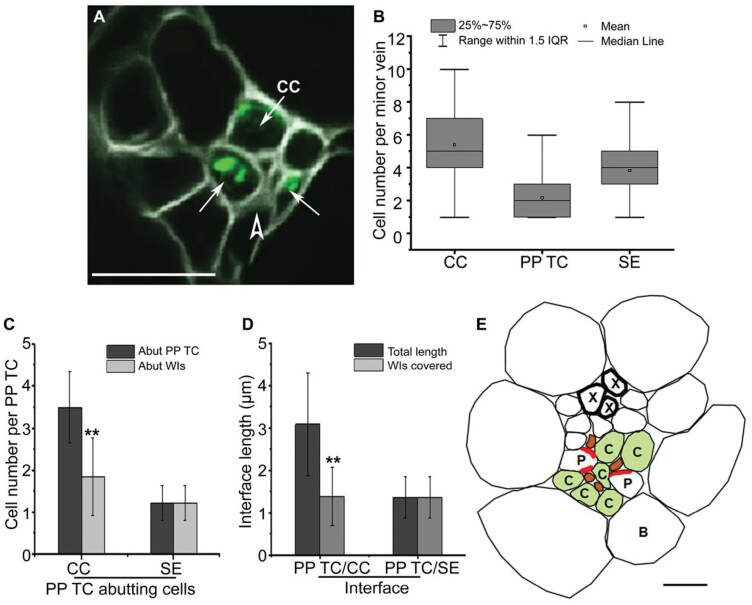
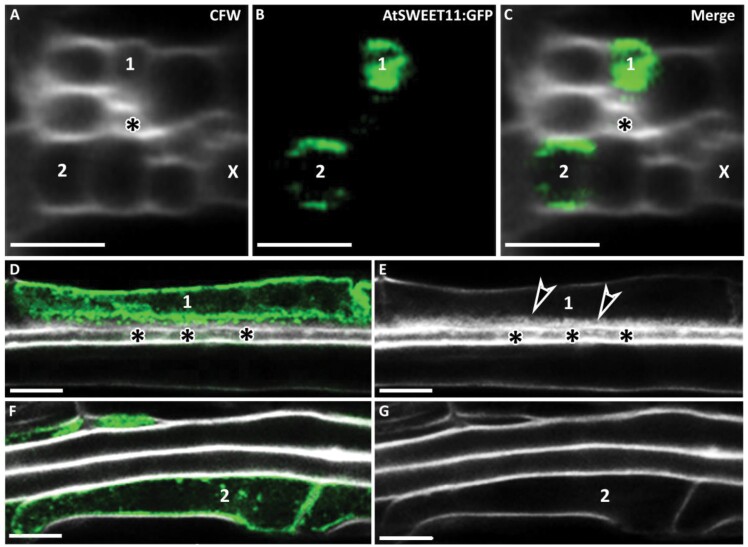
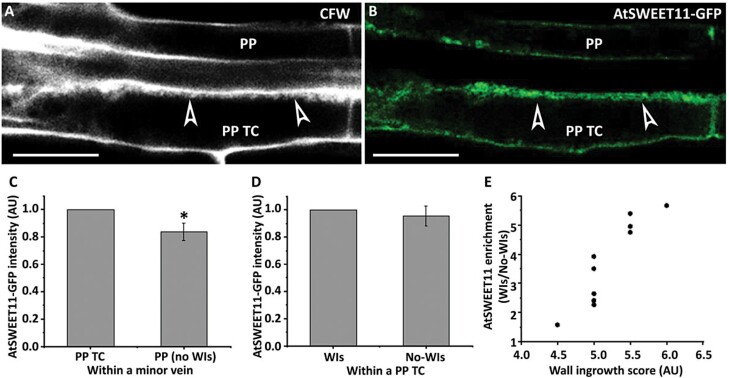
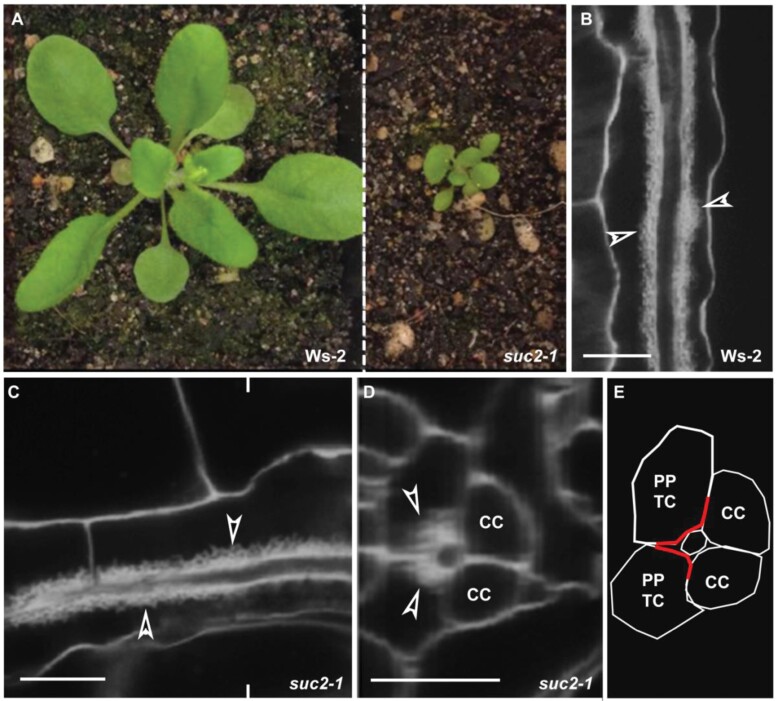
In Arabidopsis, polarized deposition of wall ingrowths in phloem parenchyma (PP) transfer cells (TCs) occurs adjacent to cells of the sieve element/companion cell (SE/CC) complex. However, the spatial relationships between these different cell types in minor veins, where phloem loading occurs, are poorly understood. PP TC development and wall ingrowth localization were compared with those of other phloem cells in leaves of Col-0 and the transgenic lines AtSUC2::AtSTP9-GFP (green fluorescent protein) and AtSWEET11::AtSWEET11-GFP that identify CCs and PP cells, respectively. The development of PP TCs in minor veins, indicated by deposition of wall ingrowths, proceeded basipetally in leaves. However, not all PP cells develop wall ingrowths, and higher levels of deposition occur in abaxial- compared with adaxial-positioned PP TCs. Furthermore, the deposition of wall ingrowths was exclusively initiated on and preferentially covered the PP TC/SE interface, rather than the PP TC/CC interface, and only occurred in PP cells that were adjacent to SEs. Collectively, these results demonstrate a tight association between SEs and wall ingrowth deposition in PP TCs and suggest the existence of two subtypes of PP cells in leaf minor veins. Compared with PP cells, PP TCs showed more abundant accumulation of AtSWEET11-GFP, indicating functional differences in phloem loading between PP and PP TCs.

Keywords: Arabidopsis; AtSUC2; AtSWEET11; companion cells; minor vein; phloem loading; phloem parenchyma transfer cell; sieve elements; wall ingrowths.


Figures

Fig. 1.
Fig. 1.
Schematic illustration of PP TC development in Arabidopsis leaves. Wall ingrowths in soil-grown Col-0 plants were quantified following Nguyen et al. (2017) in different sections of veins of each order. The shapes and vein patterns of the representative images are based on leaf scans, with the different colours representing wall ingrowth deposition scores derived from 3–7 leaves at each growth stage, and from 1–4 confocal images per vein. (A) Juvenile leaves (leaf 1) from 12- to 25-day-old plants. (B) Leaf 7 from 20- to 35-day-old plants. Vein classes are indicated by arrows in leaf 1 of a 25-day-old plant: (1) midrib, (2) secondary vein, (3) tertiary vein, (4) quaternary vein, and (IV) intramarginal vein. The primary fork is circled and indicated by an arrow. The key in (B) shows the colours denoting the PP TC score. Scale bar: 0.5 cm.
Fig. 2.
Fig. 2.
PP TC morphology and typical distribution in minor veins of mature leaves as assessed by confocal microscopy. (A) A single confocal section from an optical stack. In minor veins of a mature leaf, wall ingrowth deposition in PP TCs was abundant and highly polarized. Levels of wall ingrowth deposition varied in different PP TCs (arrowheads). (B) Orthogonal reconstruction of a confocal Z-stack through a vein shown in (A) at the location marked by indented lines indicated that most wall ingrowth deposition occurred at sites adjacent to the PP/SE interface. (Bʹʹ) Magnified image of the boxed region shown in (B). Note that wall ingrowths (arrowhead) in the PP TC occur primarily adjacent to the SE (arrow). Arrowheads indicate wall ingrowths; PP TC, phloem parenchyma transfer cell; SE, sieve element, indicated by an arrow; CC, companion cell; X, xylem. Pictures are representative images from different veins. Scale bars: 10 µm.
Fig. 3.
Fig. 3.
Wall ingrowth deposition was more abundant in abaxially positioned PP TCs than in adaxially positioned PP TCs. Confocal images were collected from mature leaf 7 from 5-week-old seedlings with inflorescences. (A) A typical leaf minor vein with two abaxially positioned PP TCs containing wall ingrowths (arrowheads). (B) A leaf minor vein with multiple PP TCs (indicated by arrowheads denoting wall ingrowth deposition) positioned at different sites throughout the phloem. (C) Counts of the number of PP TCs per size of vascular bundle (phloem+xylem area) derived from cross-sections of 40 minor veins. No correlation was seen between the number of PP TCs and the combined area of xylem and phloem cells, indicating that vein size does not control PP TC development. Numbers in parentheses indicate the replicates from each minor vein class. (D) Proportions of PP TCs located on different sites of the phloem in leaf minor veins. From 339 PP TCs present in 156 minor veins, 200 PP TCs were abaxially positioned PP TCs (defined as directly adjacent to or just one cell away from the abaxial bundle sheath cells) while 139 PP TCs were located in the middle and adaxial sites of the phloem. (E) Wall ingrowth scores were higher in abaxially compared with adaxially positioned PP TCs. Wall ingrowth scores were determined in eight minor veins (from three leaves) with multiple PP TCs, with the comparison made between the most adaxially and most abaxially positioned PP TC cells. Arrowheads indicate wall ingrowth deposition; PP TC, phloem parenchyma transfer cell; SE, sieve element (indicated by an arrow); X, xylem. Asterisks in (E) indicate significant differences (Student’s t-test, P<0.01). Samples for (A–D) were vibratome-cut cross-sections whereas (E) used whole mount leaves. Scale bars: 10 µm.
Fig. 4.
Fig. 4.
Development of wall ingrowth deposition in PP TCs in relation to neighbouring SEs and CCs. Cross-section images were collected from vibratome-cut cross-sections through maturing leaf 7 of 4- to 5-week-old Col-0 seedlings and the extent of wall ingrowth deposition in PP TCs was grouped into five representative classes. (A) Class I—no discernible wall ingrowths; (B) Class II—nascent wall ingrowth deposition positioned at the PP TC/SE interface; (C) Class III—substantial levels of wall ingrowth deposition entirely covering the PP TC/SE interface; (D) Class IV—extensive levels of wall ingrowth deposition cover the entire PP TC/SE interface and a small portion of the PP TC/CC interface; (E) Class V—massive levels of wall ingrowth deposition cover the entire PP TC/SE interface and considerable portions of neighbouring PP TC/CC interfaces. (F) Schematic figures illustrating the five representative classes of the extent of wall ingrowth deposition in PP TCs. Arrowheads indicate wall ingrowth deposition; arrows indicate sieve elements (SE); Red blocks in (F) indicate areas of wall ingrowth deposition as defined by Class I–Class V; PP TC, phloem parenchyma transfer cell; CC, companion cell; BS, bundle sheath; X, xylem. Images are representative images from three or more independent samples. Scale bars: 10 µm.
Fig. 5.
Fig. 5.
Minor vein structure and localization of wall ingrowth deposition in leaf vascular tissue in Arabidopsis. (A) Confocal imaging of a vibratome cross-section through an fixed minor vein from mature transition leaf 7 of the pAtSUC2:AtSTP9-GFP line expressing AtSTP9–GFP under control of the pAtSUC2 promoter and localized to the plasma membrane of CCs (arrows). Sections were counter-stained with calcofluor white. Arrows indicate AtSTP9–GFP-expressing CCs, with the plasma membrane plasmolysed as a consequence of fixation. The arrowhead indicates wall ingrowths in the PP TC. (B) Phloem cell numbers in each minor vein of mature leaves. The average cell numbers were obtained from cross-sections of 145 leaf minor veins. (C) Numbers of CCs and SEs that abut a PP TC (n=36 PP TCs from 26 independent minor veins) (dark grey) and numbers of CCs and SEs around a PP TC that abut wall ingrowths (light grey). (D) Lengths of PP TC/CC (n=160) and PP TC/SE (n=84) interfaces, and lengths of the PP TC/CC and the PP TC/SE interfaces containing wall ingrowths. (E) Schematic diagram of vascular components in a minor vein of mature Arabidopsis leaves. X, xylem; P, PP TC; C, CC; B, bundle sheath. Red blocks in the PP TCs in (E) represent wall ingrowths. Asterisks in (C) and (D) indicate a significant difference by the Student’s t-test (**P<0.01). Scale bars: 10 µm.
Fig. 6.
Fig. 6.
Adjacent SEs are required for wall ingrowth deposition in PP TCs in minor veins of Arabidopsis. Leaf 1 from 27-day-old seedlings of the transgenic line pAtSWEET11::AtSWEET11-GFP was fixed and cleared using ClearSee, stained with calcofluor white (CFW), and imaged by confocal microscopy. (A–C) Cross-sections were generated from confocal optical stacks using orthogonal sectioning. (A) Cross-section of a minor vein in a mature juvenile leaf stained with CFW and showing two PP cells (labelled 1 and 2) and an adjacent SE (asterisk). (B) AtSWEET11–GFP fluorescence in PP cells 1 and 2. (C) Merged image of (A) and (B), indicating the presence of two PP cells showing AtSWEET11–GFP expression. PP cell 1 was adjacent to an SE (asterisk) and showed strong AtSWEET11–GFP fluorescence, whereas PP cell 2 showed weaker fluorescence and was not immediately adjacent to an SE. (D, E) PP cell 1 expressing AtSWEET11–GFP (D) showed abundant wall ingrowth deposition (arrowheads in E) on the interface adjacent to an SE (asterisk). (F, G) PP cell 2 had no detectable wall ingrowth deposition (G), but expressed AtSWEET11–GFP (F). X, xylem. Arrowheads indicate wall ingrowth deposition. Scale bars: 5 µm.
Fig. 7.
Fig. 7.
PP TCs have higher levels of AtSWEET11 compared with PP cells. Leaf 1 from 27-day-old seedlings was fixed in 4% (w/v) formaldehyde, cleared using ClearSee solution, and stained with calcofluor white. (A) Cell wall labelling using calcofluor white. Arrowheads indicate wall ingrowth deposition in the PP TC, but no deposition in the PP cell. (B) AtSWEET11–GFP fluorescence of the same region shown in (A). (C) Relative fluorescence intensity of AtSWEET11–GFP in PP TCs and PP cells in minor veins. (D) Relative fluorescence intensities of AtSWEET11–GFP in PP TCs where wall ingrowth (WI) deposition had occurred or not. Four pairs of PP TCs and PP cells from four different leaf samples were compared and analysed to generate (C) and (D). (E) AtSWEET11 enrichment, as measured by the ratio of AtSWEET11–GFP fluorescence on the side of the cell with wall ingrowths against the opposite side of the cell, as a result of an enlarged plasma membrane area caused by wall ingrowth deposition. Data were obtained from 10 PP TCs in eight different leaves. The asterisk in (C) indicates a significant difference by Student’s t-test (*P<0.05). Pictures are representative images from four independent samples. Scale bars: 10 µm.
Fig. 8.
Fig. 8.
Wall ingrowth deposition is unaffected in suc2-1 plants. Confocal images were collected from leaf 1 of 25-day-old Ws-2 (wild-type control) and heterozygous suc2-1+/– plants. In 25-day-old Ws-2 plants, PP TCs were fully mature in leaf 1 (Nguyen et al., 2017). (A) suc2-1 seedlings were much smaller than Ws-2. (B, C) Wall ingrowth deposition was abundant in leaf minor veins of both Ws-2 (B) and suc2-1 (C). (D) Orthogonal reconstruction of a confocal Z-stack through the suc2-1 vein shown in (C) at the location marked by indented lines. (E) Schematic image of phloem cells shown in (D). Arrowheads in (B–D) indicate wall ingrowth deposition in PP TCs. Red lines in (E) represent interfaces covered by wall ingrowths. Scale bars: 10 µm.

Similar articles

Cited by

References

    1. Adams WW 3rd, Cohu CM, Amiard V, Demmig-Adams B.. 2014. Associations between the acclimation of phloem-cell wall ingrowths in minor veins and maximal photosynthesis rate. Frontiers in Plant Science 5, 24. - PMC - PubMed
    1. Amiard V, Demmig-Adams B, Mueh KE, Turgeon R, Combs AF, Adams WW 3rd. 2007. Role of light and jasmonic acid signaling in regulating foliar phloem cell wall ingrowth development. New Phytologist 173, 722–731. - PubMed
    1. Amiard V, Mueh KE, Demmig-Adams B, Ebbert V, Turgeon R, Adams WW 3rd. 2005. Anatomical and photosynthetic acclimation to the light environment in species with differing mechanisms of phloem loading. Proceedings of the National Academy of Sciences, USA 102, 12968–12973. - PMC - PubMed
    1. Bezrutczyk M, Zollner NR, Kruse CPS, Hartwig T, Lautwein T, Kohrer K, Frommer WB, Kim JY.. 2021. Evidence for phloem loading via the abaxial bundle sheath cells in maize leaves. The Plant Cell 33, 531–547. - PMC - PubMed
    1. Cayla T, Le Hir R, Dinant S.. 2019. Live-cell imaging of fluorescently tagged phloem proteins with confocal microscopy. Methods in Molecular Biology 2014, 95–108. - PubMed

Publication types

MeSH terms

Substances